ES1! S&P500 Might Lose Momentum As Tariffs Deal Not Set...price could probably be testing all time highs. Before plunging....
if the volumes comes with it and reaches the all times high levels, that could be a nice short entry point for potential profits.
Otherwise, it could probably just fill the gap on week open and keep going down in a regular pattern until August as Trumps Tariffs Deals deadline is around that time possiblily...
ISP1! trade ideas

Stock Index: ES, NQ, YM Weekly Update📈 S&P 500, Nasdaq & Dow Jones – All-Time Highs, But Caution Creeping In
🟩 S&P 500 | Nasdaq | Dow Jones
All three indices hit new all-time highs to close out June.
Powered by:
🔋 AI optimism
💰 Solid earnings
🕊️ Dovish Fed tone and falling bond yields
SPX continued its breakout run
Nasdaq surged as big tech led the charge
Dow followed with slower but steady strength
⚠️ But Watch the Signs Beneath the Surface
Consumer confidence dropped sharply
Home sales weakened
Fed speakers remained non-committal on cuts
All three indices now look extended — particularly Nasdaq
Momentum remains bullish, but these rallies are now resting on softening macro, yield compression, and hope that the Fed stays on hold.
🧠 Key Takeaway
Price action is euphoric — but fundamentals are flashing mixed signals.
When tech leads the market at extremes, volatility risk is elevated.

Sellers have returnedSellers returned during the shortened session on Friday, July 4. The issue now is this profit-taking or has this market gotten so high that new sellers are entering the market. We will not have the final answer on that until next week and we see what type of follow through if any occurs in this market.

A positive close going into a holiday weekendA positive close in the S&P 500 daily chart is expected as we go into a holiday weekend. Buyers are present and ideally a close above 6345 would be an indicator of confidence as the weekend begins.

July 9, the next key date for the S&P 5001) Caution: the S&P 500 is now in short-term technical overbought territory and may enter a retracement (without jeopardizing the underlying uptrend)
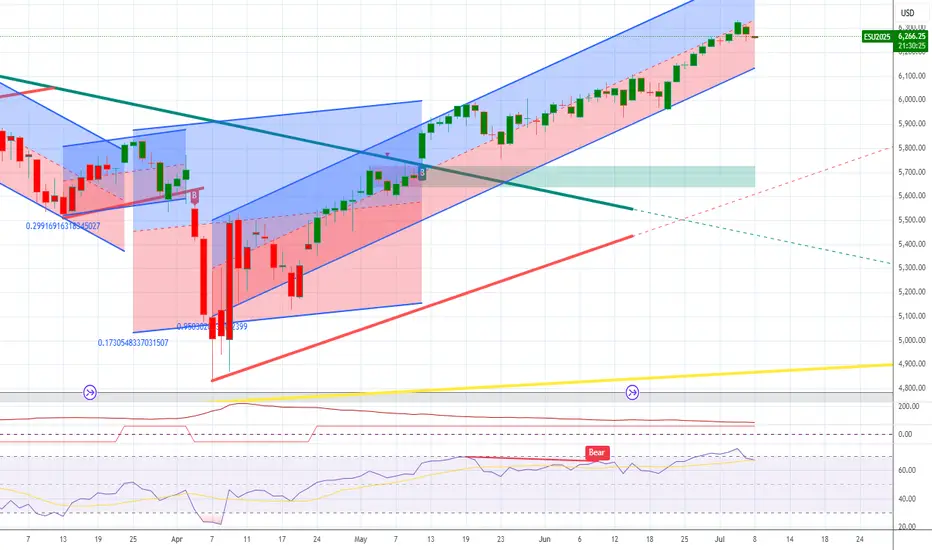
Over the past two weeks, the S&P 500 future contract has technically broken above its all-time high of 6,150 points, thereby validating a signal that the underlying uptrend is continuing. The market has risen for several consecutive sessions without pausing, and is now overbought in the short term. From a purely technical point of view, the market is therefore exposed to a reversal, and a test of its former all-time high is a possible scenario for deflating short-term overboughtness and waiting for dynamic support.
The chart below shows the monthly, weekly and daily Japanese candlesticks for the S&P 500 future contract. You can see that there is still potential on the long-term timeframes, but the short-term framework (daily timeframe) is overbought in terms of momentum (momentum being represented here by the RSI technical indicator). The market will need to be able to hold the 6000/6150 technical support in order to preserve the uptrend in place since the beginning of April.
2) The US labor market remains resilient according to the latest NFP report, which is good news for the macro-economic situation, but postpones the FED rate cut
The US job market has just delivered an unexpected signal: the unemployment rate has fallen to 4.1% of the working population, after several months of stability around 4.2%. Although this drop may seem modest, it comes at a time when the Federal Reserve (Fed) is closely monitoring the labor market for signs of a more pronounced slowdown in economic activity. This drop in unemployment suggests that, despite the monetary tightening of the past two years, the US economy remains resilient. It is now unlikely that the FED will resume cutting the federal funds rate on Wednesday July 30.
3) BEWARE of the Wednesday July 9 deadline for trade agreements between the USA and its trading partners
US President Donald Trump has confirmed that the USA plans to send a series of official notifications to several trading partners from this Friday July 4, setting unilateral tariffs that will take effect from August 1. A dozen letters will be sent initially, followed by further mailings over the next few days. This marks a new stage in his strategy of pressuring foreign countries to conclude agreements before the deadline he had announced for Wednesday July 9.
At this stage, it seems unlikely that the Wednesday July 9 deadline will be extended. So it's important to bear in mind that the trend at the very beginning of next week will be directly influenced by the news coming in on the trade war/diplomacy. The S&P 500 index will react very directly to this information. We need trade agreements with China, India, the European Union and Japan if we are not to jeopardize the S&P 500's fundamental uptrend.
DISCLAIMER:
This content is intended for individuals who are familiar with financial markets and instruments and is for information purposes only. The presented idea (including market commentary, market data and observations) is not a work product of any research department of Swissquote or its affiliates. This material is intended to highlight market action and does not constitute investment, legal or tax advice. If you are a retail investor or lack experience in trading complex financial products, it is advisable to seek professional advice from licensed advisor before making any financial decisions.
This content is not intended to manipulate the market or encourage any specific financial behavior.
Swissquote makes no representation or warranty as to the quality, completeness, accuracy, comprehensiveness or non-infringement of such content. The views expressed are those of the consultant and are provided for educational purposes only. Any information provided relating to a product or market should not be construed as recommending an investment strategy or transaction. Past performance is not a guarantee of future results.
Swissquote and its employees and representatives shall in no event be held liable for any damages or losses arising directly or indirectly from decisions made on the basis of this content.
The use of any third-party brands or trademarks is for information only and does not imply endorsement by Swissquote, or that the trademark owner has authorised Swissquote to promote its products or services.
Swissquote is the marketing brand for the activities of Swissquote Bank Ltd (Switzerland) regulated by FINMA, Swissquote Capital Markets Limited regulated by CySEC (Cyprus), Swissquote Bank Europe SA (Luxembourg) regulated by the CSSF, Swissquote Ltd (UK) regulated by the FCA, Swissquote Financial Services (Malta) Ltd regulated by the Malta Financial Services Authority, Swissquote MEA Ltd. (UAE) regulated by the Dubai Financial Services Authority, Swissquote Pte Ltd (Singapore) regulated by the Monetary Authority of Singapore, Swissquote Asia Limited (Hong Kong) licensed by the Hong Kong Securities and Futures Commission (SFC) and Swissquote South Africa (Pty) Ltd supervised by the FSCA.
Products and services of Swissquote are only intended for those permitted to receive them under local law.
All investments carry a degree of risk. The risk of loss in trading or holding financial instruments can be substantial. The value of financial instruments, including but not limited to stocks, bonds, cryptocurrencies, and other assets, can fluctuate both upwards and downwards. There is a significant risk of financial loss when buying, selling, holding, staking, or investing in these instruments. SQBE makes no recommendations regarding any specific investment, transaction, or the use of any particular investment strategy.
CFDs are complex instruments and come with a high risk of losing money rapidly due to leverage. The vast majority of retail client accounts suffer capital losses when trading in CFDs. You should consider whether you understand how CFDs work and whether you can afford to take the high risk of losing your money.
Digital Assets are unregulated in most countries and consumer protection rules may not apply. As highly volatile speculative investments, Digital Assets are not suitable for investors without a high-risk tolerance. Make sure you understand each Digital Asset before you trade.
Cryptocurrencies are not considered legal tender in some jurisdictions and are subject to regulatory uncertainties.
The use of Internet-based systems can involve high risks, including, but not limited to, fraud, cyber-attacks, network and communication failures, as well as identity theft and phishing attacks related to crypto-assets.

SPX inflection point: Parabolic Up or Breakdown? See here the entire futures contract (ES front contract) history for the S and P. What becomes very clear from connecting the lows is that the S and P has been growing parabolic over its futures chart *entire* history.
So we are now at an inflection point in the stock market history. For the first time this year, we below the parabolic arc. It reclaimed it in May to only right now be bumping up against two major intersecting resistance lines.
If we break through, hold on to your hats because we are going wayyyyy higher. Just to keep the parabolic growth curve would put us 50% higher by next year. If we breakdown, look out below. There is no support below this parabolic arc and the implosion could be catastrophic.
Either way good luck and happy trading!

Neutral zone structureThe daily chart in the S&P 500 has created a neutral zone structure. This implies a sideways move, which is what I'm looking for but with a positive close.


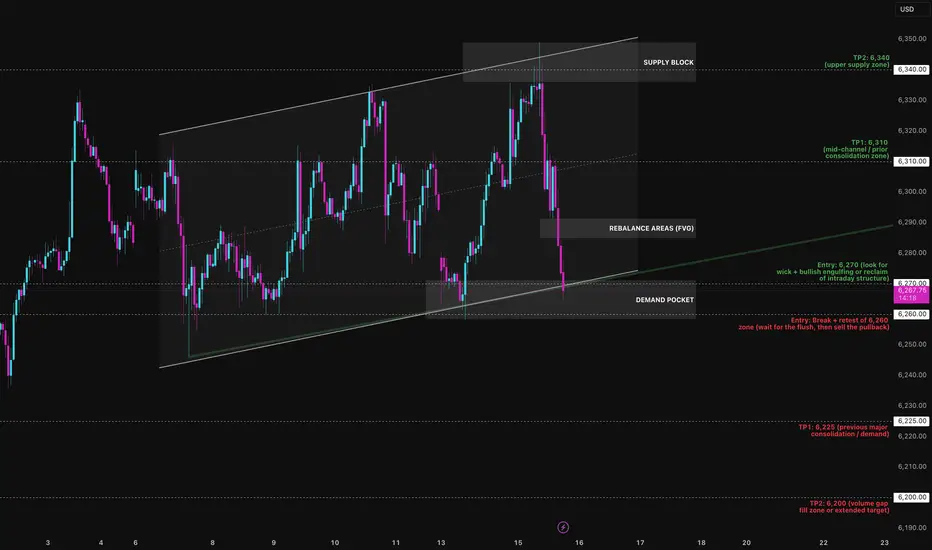
Bounce or Burial? The MES Funeral is Loading…The Micro E-mini S&P is walking a tightrope. After weeks of controlled movement within a rising parallel channel, price has now slammed into the lower boundary and the next move will define the week's direction.
I've mapped the channel from the July 2 low, with multiple precise touches on both upper and lower boundaries. Currently, MES is printing a heavy rejection from the 6360 supply zone, falling nearly 90 points back to the channel’s base near 6270.
Preferred Bias: Short-term Bearish Until Reclaimed
While the macro structure is still technically bullish (channel intact), momentum, supply pressure, and volume structure suggest sellers are gaining the upper hand:
- Mid-channel equilibrium (EQ) at 6310 was sliced without bounce
- No absorption yet at 6270 demand box
- Previous rally legs show decreasing impulsiveness — weakening buyers
Unless bulls aggressively defend 6270 with a reclaim candle or V-shape wick, this looks like a liquidity tap + structural breakdown loading up.
Bearish Play: “Channel Collapse Incoming”
Entry: Break + retest of 6,255–6,260 zone
SL: 6,275 (above retest structure)
TP1: 6,225
TP2: 6,180
Confluences:
- Channel break
- No support bounce at EQ
- Supply rejection at 6360
- Volume void below 6250
Bullish Play (Countertrend Fade): “Defend the Line”
Entry: Bounce off 6,270 with bullish engulfing or reclaim
SL: 6,255 (invalidate structure)
TP1: 6,310 (mid-channel)
TP2: 6,340–6,360 (supply reload zone)
Only valid if buyers show up with real intent don’t pre-empt.
This is a textbook inflection zone. If the lower trend line breaks and retests from below, momentum favours the bears. If bulls trap and reverse this drop at 6270, we could see a fast grind back to 6360 but as of now, all signs lean toward breakdown over bounce.
DIYWallSt Trade Journal:The Importance of Your First Trade **07/14/25 Trade Journal, and ES_F Stock Market analysis **
EOD accountability report: +158.75
Sleep: 7 hours
Overall health: Good
** VX Algo System Signals from (9:30am to 2pm) **
— 8:00 AM Market Structure flipped bullish on VX Algo X3!
— 10:30 AM VXAlgo NQ X1DD Buy Signal
— 11:50 AM VXAlgo ES X1 Sell Signal
— 1:00 PM VXAlgo NQ X1DD Buy Signal
**What’s are some news or takeaway from today? and What major news or event impacted the market today? **
I need to really be careful with my first trade and making sure it is a high probability trade, otherwise a bad early start is likely to ruin my whole day.
News
— 1:42 PM *TRUMP TO UNVEIL $70 BILLION IN AI AND ENERGY INVESTMENTS
— 4:08 PM *S&P 500 ENDS HIGHER AS STOCKS RISE AFTER TRUMP SAYS OPEN TO DEALS ON TARIFFS
**What are the critical support levels to watch?**
--> Above 6295= Bullish, Under 6285= Bearish
Video Recaps -->https://www.tradingview.com/u/WallSt007/#published-charts

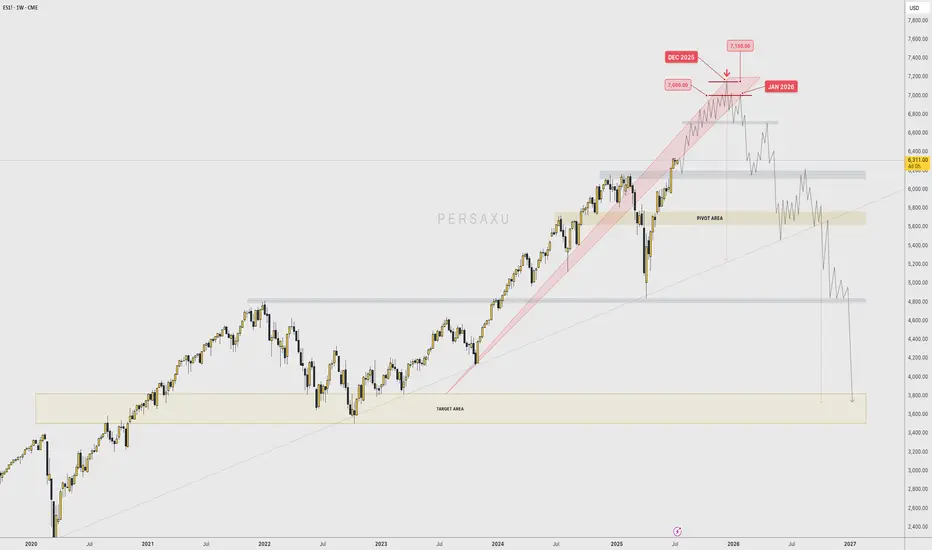
BEAR WITH ME... First of all, I'm getting into the field of other players and trying to call their type of shots.
I don't intend to come across as ignorant when it comes to this market, since I only trade gold and I have seen FOREX traders try to predict gold and get it completely wrong.
I have NO ARGUMENTS WHATSOEVER with which I could back this PREDICTION up; NOT PROJECTION...
As a matter of fact, Technically speaking , the " PROJECTION " would actually be BULLISH , because price is entering a "discovery" phase, In which there is no previous high to "top" a potential impulse with.
When price is making ATH, YOU CAN'T CALL THE TOP UNTIL THE TOP IS FORMED.
That being said, I only want to have this on my profile for personal use and see if my "prediction" comes a reality between December 2025 and February 2026.
--
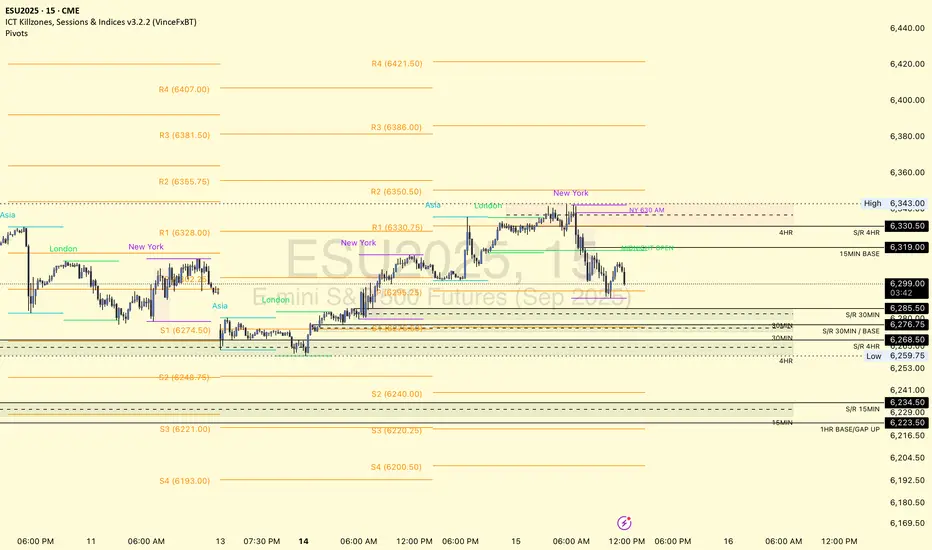
Live Setup for ES NY am session (14 July, 2025)MY bias: I expect price to make move lower at NY am session and target 6,259 price level.


SP500 ES Weekly Recap | ATH Deviation → Pullback or Powell Pump?Overview:
ES made a new all-time high last week, sweeping the previous high with strong momentum.
However, the move ended up being a deviation, and the price quickly reversed — suggesting short-term exhaustion.
Bearish Scenario (Baseline):
🔻 Rejection from ATH
🔻 Possible retracement targets:
12H Swing Low (turquoise line)
Weekly Fair Value Gap (purple zone)
I believe a pullback into those levels could provide bullish continuation setups for new highs. I’ll look for LTF confirmation once price reaches those zones.
Bullish Scenario (Catalyst-Driven):
🚨 If Fed Chair Powell resigns this week (a circulating macro rumor), the market may not wait for retracement.
This could lead to an aggressive breakout, driving ES and risk assets straight into new ATHs again.
Plan:
✅ Watch for LTF confirmation after pullback
✅ Stay open to both scenarios
✅ Focus on HTF bullish structure as long as key levels hold

DIYWallSt Trade Journal: Starting Down $400 & Patience Pays Off 07/09/25 Trade Journal, and ES_F Stock Market analysis
EOD accountability report: -271
Sleep: 4.5 hours
Overall health: Good
VX Algo System Signals from (9:30am to 2pm) 4/4 success
10:00 AM VXAlgo ES X1 Sell Signal
10:36 AM VXAlgo ES X3 Sell Signal
11:00 AM Market Structure flipped bearish on VX Algo X3!
1:33 PM Market Structure flipped bullish on VX Algo X3!
What’s are some news or takeaway from today? and What major news or event impacted the market today?
I took some short positions overnight and got caught in the big push up this morning and started the day with -400, I was very tempted to go big and tried to trade it back but decided it was better off just to wait for a better day to recover the account instead.
Consider yesterday was a big manipulation day and today was another one but squeezing to the upside for a rug pull downwards.
News
*(US) FOMC JUN MINUTES: COUPLE OF PARTICIPANTS NOTED THEY WOULD BE OPEN TO CONSIDERING A RATE CUT AS SOON AS THE JULY MEETING IF DATA EVOLVE AS THEY EXPECTED (Bowman and Waller have said as much since the FOMC meeting)
What are the critical support levels to watch?
--> Above 6290= Bullish, Under 6280= Bearish
Video Recaps -->https://www.tradingview.com/u/WallSt007/#published-charts

Backtest $ES 15 minTest for analysis of trend with OBR in 15 min. Testing the possibility to OBR in NYSE:ES

MES Futures – ORB Strategy Long from London Open Range BreakDescription:
Executed a clean ORB long trade on MES during the London session, with confirmation from the 5-min chart and structure mapped on the 15-min.
Setup Breakdown:
Session: London Open
Strategy: Opening Range Breakout (ORB)
Entry: Break of ORB high with confluence from 15-min demand zone + EMA support
Stop: Below session low and structural demand
Target: Previous session high & key 1HR supply zone
T echnical Context:
Price rejected from previous session low and formed a clear ORB range.
After consolidation, a strong bullish candle broke above the range high with increasing volume and EMA cross.
Trade was managed up to the previous session high and partials secured before price met the diagonal resistance trend line.
Key Zones:
✅ Entry Zone: 6270.00
🟥 Stop Loss: ~6260.25
🎯 Target Area: 6287.75 (Previous Session High)
🟥 15-min Supply overhead could pose resistance
Staakd Rating: ★★★★☆
(Rated 4/5 for textbook ORB play, clean risk:reward, and structure alignment)

Wait and seeThe S&P 500 daily chart structurally is in a “wait and see”mode. It is waiting for additional information regarding tariffs and the Fed minutes coming out on Wednesday. I think the bias is still for moved to the upside.

07/08/25 Trade Journal, and ES_F Stock Market analysis EOD accountability report: +220
Sleep: 7 hours
Overall health: Good
VX Algo System Signals from (9:30am to 2pm) 4/4 success
— 9:30 AM Market Structure flipped bullish on VX Algo X3! :check:
— 10:30 AM VXAlgo NQ X1 Buy Signal :check:
— 12:24 PM Market Structure flipped bullish on VX Algo X3! :check:
— 1:30 PM Market Structure flipped bearish on VX Algo X3! :check:
What’s are some news or takeaway from today? and What major news or event impacted the market today?
After taking losses, I usually set a lock out on my account after $200 profit to build back small wins and confidence. so luckily I was locked out pretty early today and avoided most of the market whipsaw. But on days like these, if you don't walk away after you make money, you could eventually get triggered and tilted by the whipsaw. a lot of orb traders probably died today.
News
*HOWARD LUTNICK ON TARIFFS: EXPECT ANOTHER 15-20 LETTERS TO GO OUT OVER THE NEXT 2 DAYS- CNB
*Trump announces 50% tariff on copper imports, threatens 200% tariff on pharmaceuticals and maybe chips
What are the critical support levels to watch?
--> Above 6280= Bullish, Under 6260= Bearish
Video Recaps -->https://www.tradingview.com/u/WallSt007/#published-charts

Profit takingMondays structure in the S&P 500 daily chart implies profit-taking in a move back toward the upside is expected.

Market UpdateI have had no trade signals on my strategy for two days.
The market is very so but it will not last forever.
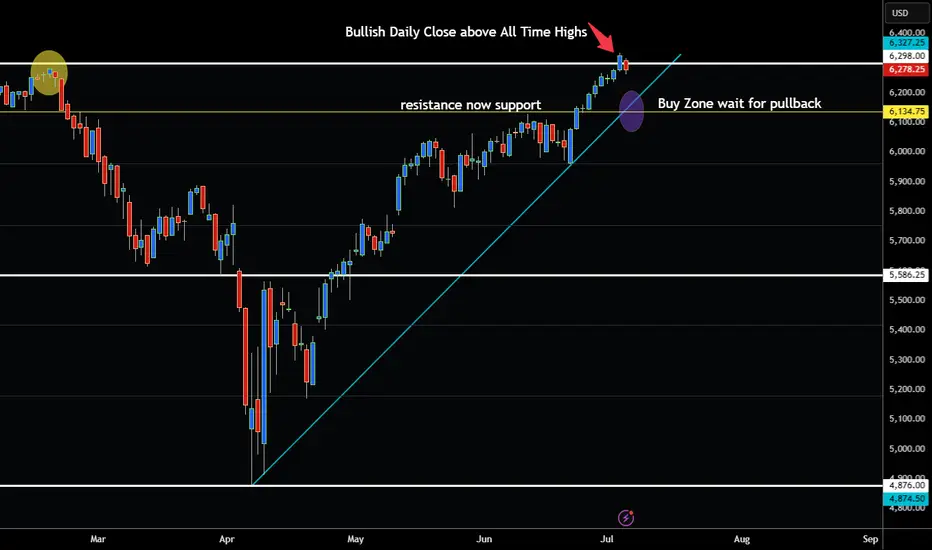
S&P 500 BULLISH BREAKOUT ABOVE ALL TIME HIGHS!Hey Traders taking a look at the S&P500 this week it is clear that we are in a strong bull market.
Notice that we broke above 6300 on the ES Futures Contract last week on July 3. This level is extremely important because it was the all time high from Feburary 2025. So now that the market has closed above this level buying opportunities can be considered at the trendline.
6135-6150 look like a good place to grab this bull again by the horns. 😁
So if your bullish wait for the pullback no need to chase the market imo. Eventually it will pullback lets see what happens July 9 WED with the Tarrifs.
Expect Volatility!
However if your bearish be very careful I don't think there is a good risk to reward ratio to shorting at this time.
Good Luck & Always use Risk Management!
(Just in we are wrong in our analysis most experts recommend never to risk more than 2% of your account equity on any given trade.)
Hope This Helps Your Trading 😃
Clifford