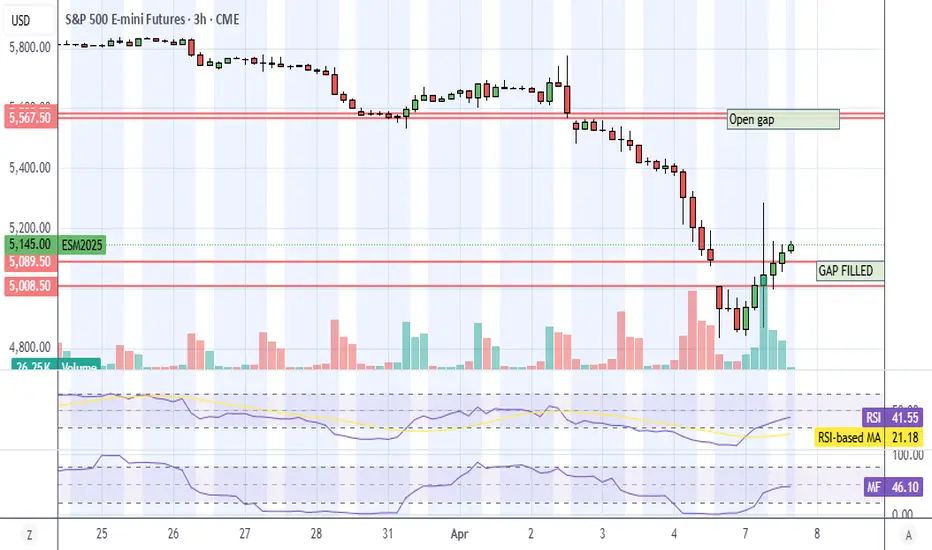
ES 3hr UpdateNot sure if I will have time to post an update tomorrow morning, futures are red, RSI looks like it's headed to oversold, foreign investors are ditching US assets, nobody trusts Trump. Index futures, stocks, bonds, and the US dollar all selling off.
With Trump gaming the market, it's easy to get whipsawed into a loss. Get caught holding puts when "news" comes out, and you're toast. I'm expecting "news" because of the bond selloff, Trump is rate sensitive because of his real estate interests.
I plan on buying gold if the US dollar loses support. See my gold posts. It's the only high confidence play I could come up with. If you like to leverage with options, you can do GLD calls, UUP puts, UDN calls, or bet on Euros, Swiss francs, or yen.
ISP1! trade ideas

AMP Futures - How to add more levels for Parrallel ChannelIn this idea we will demonstrate how to apply more levels to the Parallel Channel drawing tool using the TradingView platform.

April 10th Trade Journal & Market AnalysisEOD accountability report: +$3087.50
Sleep: 6 hour, Overall health: going thru Flu symptoms
**Daily Trade Recap based on VX Algo System **
10:27 AM VXAlgo ES X1 Buy signal (double buy signal)
12:30 PM VXAlgo NQ X1 Buy Signal (triple buy signal)
1:45 PM VXAlgo NQ X3 Buy Signal (triple buy signal) + market structure = A+ set up
Took some time off the last few days from trading futures to
re-organize the options account and long term port, got back into trading futures today.

Bottom in: S&P defended the Oct 2022 trendlineS&P successfully defended the Oct 2022 trendline
Weekly RSI oversold at 30
Bearish case
Nasdaq still under the Oct 2022 trendline

Can buyers maintain upward pressure?Trumps deferring tariffs for 90 days created in enthusiastic response from buyers in the S&P 500. The next challenge will be can these buyers maintain this upward momentum. The expectation for Thursday is higher highs but not a large move to the upside.

ES UpdateTrump is obviously gaming the market, so there's really no point in even looking at charts or indicators, lol. It's hard to take him seriously now.
The gap will fill, maybe as soon as tomorrow morning. Then we get another huge pump sometime within the next week when he repeals the China tariffs and sets then to 10% or something.
Just hold your favorite stock and wait it out. I bet he exempts AAPL, auto parts, and whatever else from the China tariffs. GM and even PDD went up today in anticipation.
I had a few GM puts, saw the jump, tried to climb on as fast as possible. I prioritized my retirement account ahead of my options play, but I made a little money, hopefully more the next few days, lol.
Expecting a melt up, then a jump when he caves in to China, no shorting anything for the next week until everything stabilizes. NVDA and TSLA still have other issues aside from tariffs, so those will be targets. Gotta let the short squeeze complete first, I have a 3 day rule. Wait 3 days, lol.

S&P - What will happen next for the S&P?The S&P 500 has been dropping quickly after Trump's tariff policies were announced. It fell from 5750 to 4900, and is now at 5053, all in just a few days. This is a sharp decline, and sellers are clearly in control right now.
However, after such a big drop, it's common to see a short-term bounce before the market continues to fall. There is strong resistance between 5400 and 5500, which lines up with the golden pocket (a key level in technical analysis). This could make it harder for the S&P to rise past these levels.
Looking further down, there is another strong support area between 4500 and 4600. This level also matches the golden pocket on the daily chart, making it an important point for potential support. If the market keeps falling, we could see this area tested before any significant recovery.
Right now, it seems likely that the market will keep going lower. My main expectation is that we’ll get a small rally first, which could trick some traders into thinking the market is recovering, before continuing down. However, with all the uncertainty around the news and policies right now, it's also possible the market could keep dropping sharply without much of a rally.
Keep a close eye on the markets and stick to good risk management practices. If you don’t, it could really hurt your portfolio. Stay alert and adjust your strategy as things change.
Thanks for your support.
- Make sure to follow me so you don't miss out on the next analysis!
- Drop a like and leave a comment!

MES1! - Micro E - Mini S&P 500 Futures (Liquidity Grab Zone)Here I have the S&P Micro Futures showing consolidation in a tight range with about a 200 point spread to trade in. I have created this box to warn traders especially novice traders that this is a dangerous trade zone meant to grab liquidity (take your money). I would highly suggest to sit on your hands and wait for the price action to move out of the Liquidity Grab Box with a confirmed candle body close above or below the zone, at least 30 - 60 mins and with volume before taking a trade.
It seems that this consolidation is setting up for the next drop lower or higher depending on the tariff/trade war data we receive. Good Luck to all, preserve your capital and let the setups come to you, don't chase the price action, it will lead you into a trap.

S&P 500 Testing Key SupportThis analysis aims to provide you with a clear understanding of the market’s direction and potential inflection points on the Weekly timeframe.
Bearish/Bullish Trend Analysis
Trend Condition:
Bullish Trends: 3
Bearish Trends: 11
Overview: The market shows a predominant bearish outlook with 11 trend lines indicating a downward movement. However, there are 3 bullish trends emerging, suggesting some areas of resistance or potential reversal points.
Price Action and Momentum Zones
Current Price and Change:
Currently, the S&P 500 Futures are at 4,979.75, down 117.00 points or approximately -2.30%.
Market Behavior: This week’s sharp decline is consistent with the dominant bearish trend but the presence of a few bullish lines hints at possible undercurrents of recovery or resistance.
Momentum Zones:
The index has recently entered a lower price band, testing significant support levels that could dictate the next movements within this bearish trend.
Fibonacci Retracement Levels
Current Position Relative to Levels:
The futures are hovering around the 50.0% Fibonacci retracement level.
Key Fibonacci Levels:
23.6% → 5,537.68
38.2% → 5,148.66
50.0% → 4,834.25
61.8% → 4,519.84
Analysis: The proximity to the 50.0% level at 4,834.25 is noteworthy, as this level often acts as a moderate support in downtrends. Remaining around this level could suggest a stabilization or minor corrective rally if buying interest increases.
Overall Market Interpretation
Despite the downturn this week, the S&P 500 Futures showing some bullish signals could indicate a complex market environment where traders are assessing whether the current levels present buying opportunities or if the bearish trend will persist.
Summary
The S&P 500 Futures have faced a significant decline early in the trading week. With the market currently testing the 50.0% Fibonacci level, this could be a crucial juncture. The market's next steps will depend heavily on whether it can sustain above this level, potentially leading to a stabilization or a continued descent. Monitoring these Fibonacci levels will be key in predicting the short-term future of the market.

Futures electronic hoursFutures electronic hours
💡 This idea focuses on trading futures during the electronic trading hours — the periods outside the regular cash session, where unique price behavior often occurs due to lower liquidity and algorithmic dominance.
📊 Core Strategy:
During electronic hours (typically post-market/pre-market), futures like ES, NQ, or CL often show sharp moves driven by global macro news, low-volume liquidity zones, or overnight positioning. These moves can offer high-probability setups when combined with key levels from the regular session.
🧠 How to use it:
1. Mark key support/resistance levels from the previous regular session.
2. During electronic hours (e.g., 6 PM – 9 AM ET), monitor price interaction with these levels.
3. Look for rejection, breakout, or fakeout signals, ideally with volume spikes.
4. Use tight risk management due to increased volatility and spreads.
⏱️ Electronic hours are often overlooked but can offer clean technical setups for experienced traders, especially in quiet news environments or after major macro releases.
📌 Works well with futures contracts like ES, NQ, CL, and GC. Can also be adapted for FX and crypto markets which trade 24/7.

ewtsu es1! minor wave C developping
Elliott wave set up
minor wave C developping
minute wave ((IV)) unfolding - FIB 5193/5303
ICHIMOKU leading span B - 5316 / span A 5180
Static level 5180 - 5393 - VP AREA
invalidation : minute wave ((IV)) unfolding 5303

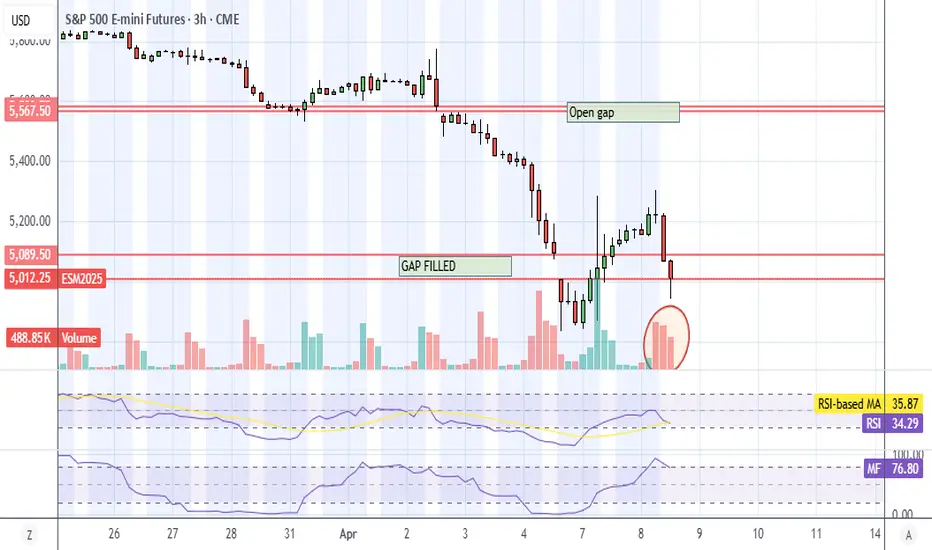
ES UpdateI won't be able to post before work, so here's an early update....
RSI is barely touching oversold, I expect it to go a bit further, but don't expect a tank. Probably a double bottom because the algos want their money back, lol.
Daily and weekly RSI also oversold, and the algos appear to be looking strictly at indicators and not the news. They freakin pumped right before tariff announcements TWICE, lol. SO possible reversal tomorrow afternoon or Thu. Keep an eye out, they'll pump the market every time a country makes a deal. That's my prediction...

Calling it nowBased of range projections, and price respecting Apr,4 daily FVG -, price is not slowing down, Last year low of (4,702.00) will get ran. Come back when im right😳

$MES1! Could Drop to Oct 2022's Fib 0.618 Level @ 4,520Monthly (April 2025)
- #TheStrat: 2u-2d-2d continuation
- Price stopped at the monthly 0.50 fib (Oct 2022 - Feb 2025)
Weekly (Mon April 7 - Sat, April 12)
- 2u-2d-2d continuation
- 4072 - 4520 is the range of 0.786 and 0.618, respectively.
- 4834 is the 0.5 fibonacci, short term reversal
Daily (Wed, April 9)
- 2u-2u-2d reversal
- potential support is 0.5 fib @ 4834
- RSI at 20 (low) and MACD still red

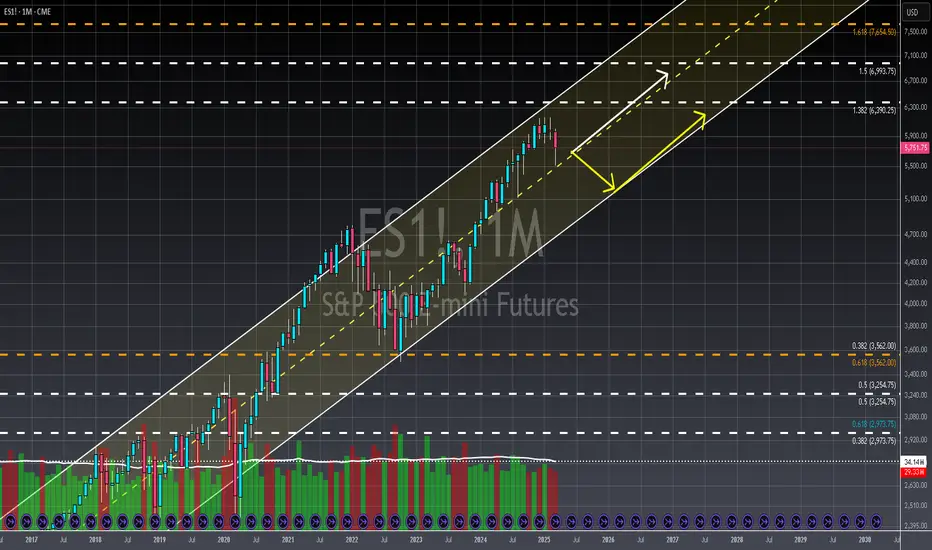
ES1! - Monthly - Grand Scheme of ThingsClick Here🖱️ and scroll down👇 for the technicals, and more behind this analysis!!!
________________________________________________________
________________________________________________________
..........✋NFA👍..........
📈Technical/Fundamental/Target Standpoint⬅️
1. Long-Term Perspective: While recent market volatility may induce panic, it's crucial to acknowledge the S&P 500's overarching upward trend. Periods of consolidation are inherent to sustained rallies, allowing the market to build momentum for further advances. However, given prevailing economic uncertainties—including inflation, tariffs, and signs of rally exhaustion—a healthy correction towards Q1-Q2 2024 price levels is plausible.
2. Short- to Medium-Term Outlook: A near-term retest of the 6,000 level is anticipated, followed by a subsequent retracement. In this period of heightened uncertainty, a cautious approach is recommended for bullish positions.
3. Technical Considerations: Current weekly and monthly chart patterns remain in development. In light of this, prioritizing the preservation of existing gains is paramount, a strategy that appears to be underemphasized in current market discussions.
==============================
...🎉🎉🎉Before You Go🎉🎉🎉…
==============================
Leave a like👍 and/or comment💬.
We appreciate and value everyone's feedback!
- RoninAITrader
New tariffs on China push the S&P 500 lowerThe possibility of a trade war with China increased as the US added another layer of tariffs on China bringing the total to 104%. This new uncertainty implies continued downward pressure in the S&P 500. I am looking for a sideways price movement.

ES Update, 104% China Tariff Edition, lol.As you can see, MFI hit overbought before open. Unfortunately, I didn't have time to post before work.
Stupid algos pumping before bad news again, they even pumped China, so I bought some MCHI (China ETF) puts in the morning. WHy would anyone pump CHina before a tariff announcement?!?!
I don't see Xi or Trump backing down, if anyone falters, it'll be COngress. The issue is that it will take a 2/3 majority in both houses to override a veto, so they probably won't be able to muster up enough support until next week at the earliest Then Trump can sit on the bill for 10 days before he vetos.
There's not a parts supplier in China that's gonna pay 104% tariff, which means stop ship on everything. And we're looking at bare minimum of 11 days before tariffs can be repealed, probably gonna be at least 3 weeks. Even at that pace, it's gonna create a shipping backlog, empty shelves, parts shortage, and temporary layoffs at manufacturing plants just like COVID did.
What's this all mean? IF YOU NEED ANYTHING THAT'S MADE IN CHINA, GO SHOPPING RIGHT NOW! I'm not kidding. It may cause issues even with stuff like frozen dinners because China makes all of the containers.
ANyways, the algos screwed up again. RSI probably goes deep into oversold again. We get a huge ass bounce when COngress gets their shit together in a week or two. Even then, some companies will have lingering effect because I can guarantee there will be a shipping backlog when the tariff is lifted.

VPO charts with MAsI have added the US02Y treasury to my RSI and WOW.
I set up some volume templates using CC colors. Kept it very minimal. Sessions in light blue teal. Days in blue. Weeks in yellow. Months in purple. Could add more or change as desired.
I turned off boxes for most but I like the weekle box. In fact the more I can turn price into boxes the better. Let me now finish talking to Grok and I'll send some examples.

ybr 4-7-25wealth building yellow brick road for 4-7-25 collecting $76.50 with $923.50 risk breakeven 419.23 ... 39 days to expire ... roi year 76%

The Trump PatternWhen Donald Trump took office in 2017, the U.S. stock market experienced dramatic fluctuations—marked by steep declines followed by eventual rebounds.
This pattern, which we'll call the "Trump Pattern," repeated itself during his presidency and is now emerging again as a point of interest for investors.
While the specific causes of these market shifts varied, key factors—particularly tariffs, inflation concerns, and Federal Reserve (FED) actions—played critical roles in the market's rise and fall during Trump’s presidency.
The Trump Pattern: The Market Fall and Recovery
🏁 1. The Start of the Trump Presidency (2017)
When Donald Trump was elected in 2016, the market responded with a combination of excitement and uncertainty. Initially, the market surged due to tax cut expectations, deregulation, and optimism about a business-friendly administration. But as Trump's presidency fully began in January 2017, concerns over trade wars and tariff policies began to dominate investor sentiment.
The market initially dipped after Trump began pursuing a protectionist trade agenda, especially with China.
As concerns about tariffs escalated, stock markets reacted negatively to potential trade wars.
💶 2. The Tariff Crisis of 2018
The first major example of the "Trump Pattern" emerged in 2018 when Trump began implementing tariffs, particularly on Chinese imports, and announced new tariffs on steel and aluminum. This caused major market disruptions.
The S&P 500 fell dramatically during this period, dropping by as much as 8.6% from its February peak in 2019.
Companies that relied heavily on international trade, like Apple, General Motors, and Ford, experienced significant stock price declines. In fact, Apple’s stock fell 9.5% on days when new tariffs were announced, as their costs for manufacturing overseas rose.
The uncertainty surrounding the global economy, combined with rising tariffs, created fears of a trade war, leading to sharp market declines.
📈 3. Market Recovery: FED Rate Cuts and Tax Cuts
Despite the tariff-induced volatility, the market didn’t stay down for long. After significant market falls, the Federal Reserve (FED) began implementing interest rate cuts to combat slowing economic growth. These actions helped stabilize the market and even fueled a rebound.
FED rate cuts made borrowing cheaper for consumers and businesses, stimulating economic activity and boosting investor confidence.
Additionally, tax cuts, a cornerstone of Trump’s economic policy, provided further support, particularly for corporations.
As a result, after the initial market drop in 2018 and early 2019, the market rebounded, continuing to climb as investors reacted positively to these fiscal and monetary policies.
🎯 The 2024 and 2025 "Trump Pattern" Emerges Again
Fast forward to 2024 and 2025, and we’re seeing echoes of the "Trump Pattern" once again. New tariffs, introduced in 2025, have reignited concerns about a trade war. These tariffs, particularly on Chinese imports, have once again caused market volatility.
The stock market has fallen in recent months due to concerns about these tariffs and the impact they might have on global trade. For example, when new tariffs were introduced in early 2025, the market saw a sharp sell-off, with the S&P 500 falling by over 1.8% in a single day.
Companies that rely on international trade, like Tesla and Ford, have seen their stock prices drop in response to concerns about increased production costs.
The broader market decline, much like in 2018, was driven by fears that tariffs could slow down the global economy and hurt corporate profits.
However, there is optimism that the same pattern will unfold, where the market eventually recovers after these initial drops.
⚠️ 4. FED Rate Cuts Again?
As inflation concerns persist, the Federal Reserve is likely to step in once again. Like previous cycles, we expect the FED to cut interest rates to stimulate the economy. This would be aimed at reducing borrowing costs, encouraging investment, and helping businesses weather the impact of higher tariffs and global uncertainty.
The FED’s actions are typically a key driver of market recovery in the "Trump Pattern." Investors have come to expect that a market downturn triggered by political or economic disruptions can be offset by the FED’s supportive monetary policies.
⚖️ Navigating the Trump Pattern: What Should Investors Do?
The "Trump Pattern" highlights that during periods of heightened uncertainty, especially due to trade policies like tariffs, the market will often experience short-term declines followed by long-term recovery. Here are a few strategies investors might want to consider:
Stay Diversified : During periods of volatility, having a diversified portfolio can help cushion against the risks posed by market swings.
Invest in Domestic Companies : Companies that rely less on international supply chains might fare better during periods of trade policy changes and tariff uncertainty.
Focus on Growth : Once the initial market decline subsides, look for sectors that stand to benefit from a recovering economy, such as tech or consumer discretionary stocks.
Look for Inflation Hedges : Given the potential for inflation, consider investments that tend to perform well during these times, such as real estate or commodities like gold.
📝 Conclusion: The Trump Pattern in Action
The "Trump Pattern" demonstrates how the market tends to react in cycles during the early months of each presidency. Typically, the market falls at the start due to the uncertainty surrounding Trump’s trade policies, particularly tariffs. However, after these initial drops, the market often rebounds thanks to FED rate cuts and other policies aimed at stimulating the economy.
Looking ahead to 2025, we're already seeing signs of this pattern in action as tariffs are back on the table and market volatility has followed. However, history suggests that patience might pay off. Once the FED steps in and cuts rates, a market rebound is likely, following the same trend we saw in 2017-2019.

ES (SPX) Intraday ChartBTW, what the hell kind of intraday chart is this? Strangest trading day I've ever seen.
Did anyone else look at the chart and just laugh? Algos run amok trying their best to prop up the market.
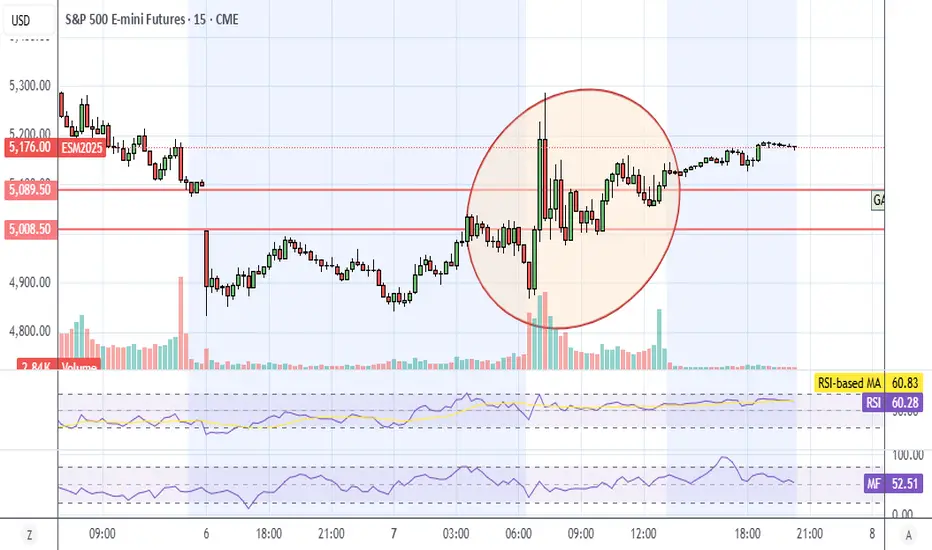
ES UpdateLike I said over the weekend, the algos are definitely on, explains the whipsaw Fri and today. Everything is oversold so they had to pump it and try to get their money back.
Problem is, Trump is gonna announce 50% tariff on China tomorrow. CHina ain't backing down, not their style.
QUote:
"Therefore, if China does not withdraw its 34% increase above their already long term trading abuses by tomorrow, April 8th, 2025, the United States will impose ADDITIONAL Tariffs on China of 50%, effective April 9th."
Source:
www.cbsnews.com
Might have to short something tomorrow morning, lol.