ES Monthly chart for some of you youngstersIf you think the market can't go any lower, you're mistaken. It's been a while since it's happened (housing bubble crash), but monthly indicators can go oversold. We're not there yet.
If congress doesn't step in and rescind the tariffs, the stock market will get cut in half like it did back then. It's gonna be nearly impossible for corporations to match even preCOVID level profits with such huge tariffs.
I do not recommend going long on anything until congress steps in. That may happen as early as this weekend, or they can wait until the market tanks 50%, lol..... who knows.
ISP1! trade ideas
SPX scenarios in weekly chartHello
These 2 scenarios for S&P is more probable ones and as you elliotticians know there is a doubt in wave (4). In scenario 1 wave (4) is acceptable due to Alternation and in scenario 2 it made a Running Flat. In both scenarios there is one strategy for today market which is another correction starting from here.
In smaller time frames you need to find a bearish impulse wave to get in this correction.
S&P 500 - Elliott Wave Bearish BreakdownThis S&P 500 E-mini Futures (ES) daily chart highlights a potential bearish Elliott Wave structure following rejection from a key resistance zone.
- The market encountered strong resistance near the 5,600 level, leading to a sharp decline.
- A five-wave impulsive bearish structure appears to be forming, with Waves (1) and (2) already completed.
- If this pattern continues, Waves (3), (4), and (5) could drive prices lower, targeting key support levels in the coming weeks.
Traders should watch for confirmation of Wave (3) acceleration, as it is typically the strongest wave in an impulse. A break below recent lows could confirm further downside, while a strong bounce from lower levels may indicate a correction or trend reversal.
Risk management remains crucial, as volatility can increase during corrective and impulsive waves. Keep an eye on macroeconomic factors and technical confluences for additional confirmation.
Combined US Indexes - Lower High checked; Lower Low next...As expected from previous analysis, there is a lower high likely as the TD Sell Setup is Perfected. This just missed the target but has the TD Bear Trend intact
Following, a Bearish Engulfing pattern plus a Gap Down occurred yesterday.
Breaking back into Extension Zone box... and likely to protrude out the other side.
MACD is turning down in the bearish zone too.
So, looking for a lower low now...
April 3rd Daily Trade Recap EOD accountability report: +$161.25
Sleep: 6 hour, Overall health: not good at all.
**Daily Trade Recap based on VX Algo System **
9:42 AM Market Structure flipped bullish on VX Algo X3!
10:30 AM Market Structure flipped bearish on VX Algo X3!
11:11 AM VXAlgo ES 10M Buy signal (double signal)
12:04 pm Market Structure flipped bullish on VX Algo X3!
1:31pm Market Structure flipped bearish on VX Algo X3!
1:40 PMVXAlgo NQ 10M Buy Signal double signal
Another wild day, market went extremely bearish and has been rejecting the 5 min resistance and playing out as expected.
ID: 2025 - 0073.18.2025
Trade #7 of 2025 executed. So simple, yet far from easy...
Trade entry at 30 DTE (days to expiration).
This trade has a little more hot sauce and fire built into it.
Unbalanced butterfly, close to expiration, will adjust the wing widths as the market adjusts either up or down. Goal is to be out of this trade in under two weeks before GAMMA really begins kicking in.
The reason I like going in closer to expiration after big market moves, is the volatility is better, and fills are quicker, and spreads are tighter. The downside of playing super long DTE strategies is that when the market gets spooked or turbulent, the bid/ask spreads become a mile wide.
Happy Trading!
-kevin
be careful from this market makers playIts a very straight forward approach.
make it look like we have a double bottom and rugpull:
fomo pump to vwap
clean the funky high
then nuke toplongers on trump news
I hope this wont get many views, i know you're watching market maker.
dont worry im not going viral so you keep doing you.
green rectangle is a gap thats why its my target.
i wont short this without oscilators data
ES UpdateGap is still open but market is cycling down. RSI is not oversold yet. Probably a bounce when RSI hits oversold, but I don't expect a big one until the daily gets oversold.
Market took such a big shit that firms had to sell gold futures for to cover losses and margin calls. So gold is red now as well. SO that play also appears to be done. Too bad I didn;t just short something before close like XLF or AAPL.
Gaps are so huge, I have no idea how to play this. I don;t recommend going long today though, unless its just a day trade.
Understanding MACD In TradingThe Moving Average Convergence Divergence (MACD) is a trend-following momentum indicator that measures the relationship between two moving averages of an asset’s price. Developed by Gerald Appel in the late 1970s, MACD is designed to provide insights into both trend strength and momentum.
Unlike simple moving averages, which merely smooth price data over a specific period, MACD goes a step further by identifying when short-term momentum is shifting in relation to the long-term trend. This makes it a valuable tool for traders looking to enter or exit positions at optimal points.
1. Why is MACD important in trading?
Trend Confirmation: Identifies whether an asset is in an uptrend or downtrend.
Momentum Strength: Measures how strong a price movement is.
Reversal Signals: Detects potential changes in trend direction.
Entry and Exit Points: Helps traders determine when to buy and sell.
2. MACD Components
The MACD Line: Identifies whether an asset is in an uptrend or downtrend.
This line is derived by subtracting the 26-period Exponential Moving Average (EMA) from the 12-period EMA.
When the MACD Line is positive, it indicates bullish momentum; when negative, it suggests bearish momentum.
The Signal Line: Measures how strong a price movement is.
A 9-period EMA of the MACD Line.
It smooths out MACD fluctuations, making it easier to identify crossovers.
The Histogram: Detects potential changes in trend direction.
The difference between the MACD Line and the Signal Line.
A positive histogram suggests increasing bullish momentum, while a negative histogram suggests growing bearish momentum.
3. MACD Formula
The Moving Average Convergence Divergence (MACD) is one of the most widely used technical indicators in trading. It helps traders identify trends, momentum shifts, and potential buy or sell opportunities by analyzing the relationship between two moving averages.
By calculating the difference between a short-term and long-term exponential moving average (EMA), MACD provides insight into market direction and strength.
//@version=6
indicator("MACD Indicator", overlay=false)
// MACD parameters
shortLength = 12
longLength = 26
signalLength = 9
// Calculate MACD
macdLine = ta.ema(close, shortLength) - ta.ema(close, longLength)
signalLine = ta.ema(macdLine, signalLength)
histogram = macdLine - signalLine
// Plot MACD components
plot(macdLine, color=color.blue, title="MACD Line")
plot(signalLine, color=color.red, title="Signal Line")
plot(histogram, color=color.green, style=plot.style_columns, title="Histogram")
Explanation:
Short EMA (12-period) and Long EMA (26-period) are calculated.
The MACD Line is the difference between these EMAs.
A Signal Line (9-period EMA of MACD Line) is calculated.
The Histogram represents the difference between the MACD Line and the Signal Line.
4. Interpreting MACD signals
MACD Crossovers
A crossover occurs when the MACD Line and Signal Line intersect:
Bullish Crossover: When the MACD Line crosses above the Signal Line, it signals a potential uptrend and a buying opportunity.
Bearish Crossover: When the MACD Line crosses below the Signal Line, it suggests a potential downtrend and a selling opportunity.
MACD Divergences
Divergences occur when MACD moves in the opposite direction of the price, signaling a potential reversal:
Bullish Divergence: If price makes lower lows, but MACD makes higher lows, it suggests weakening downward momentum and a possible bullish reversal.
Bearish Divergence: If price makes higher highs, but MACD makes lower highs, it signals weakening upward momentum and a potential bearish reversal.
Histogram Interpretation
The MACD histogram visually represents momentum shifts:
When bars are increasing in height, momentum is strengthening.
When bars shrink, it suggests momentum is weakening.
Zero Line Crossings
The MACD crossing the zero line indicates momentum shifts:
MACD crossing above zero → Bullish trend initiation.
MACD crossing below zero → Bearish trend initiation.
5. Trend & Momentum Analysis
Traders use MACD to confirm trends and analyze market momentum:
If MACD Line is above the Signal Line, an uptrend is in place.
If MACD Line is below the Signal Line, a downtrend is dominant.
A widening histogram confirms strong momentum in the trend’s direction.
A narrowing histogram warns of potential trend weakening.
MACD works best in trending markets and should be used cautiously in sideways markets.
6. MACD Based Trading Strategies
Entry Strategies
Buy when MACD Line crosses above the Signal Line in an uptrend.
Sell when MACD Line crosses below the Signal Line in a downtrend.
Exit Strategies
Exit long trades when a bearish crossover occurs.
Close short positions when a bullish crossover occurs.
Position Management
If the histogram is expanding, traders can hold positions.
If the histogram is contracting, it may signal weakening momentum.
7. Limitations of MACD
While MACD is a powerful tool, traders must consider:
It lags behind price movements (since it is based on moving averages).
It can generate false signals in choppy markets.
Customization is required to suit different trading styles.
8. Optimization
Optimizing MACD for Different Market Conditions
Day Traders & Scalpers: Use faster settings like (5, 13, 6) for quick signals.
Swing Traders: Stick with the default (12, 26, 9) setting for balanced signals.
Long-Term Investors: Use slower settings like (24, 52, 18) for a broader market perspective.
9. Key Takeaways
MACD is a momentum and trend-following indicator that helps traders identify market direction, strength, and potential reversals.
Since MACD is a lagging indicator, it may generate false signals, especially in sideways markets.
Combining MACD with RSI, moving averages, and volume indicators improves accuracy and reduces risk.
MACD should be used alongside risk management strategies and other confirmation tools for best results.
MACD remains one of the most effective technical indicators, widely used across different markets. It helps traders identify trends, confirm momentum, and optimize trade entries and exits. However, it should always be used with additional tools to minimize false signals.
Stay sharp, stay ahead, and let’s make those moves. Until next time, happy trading!
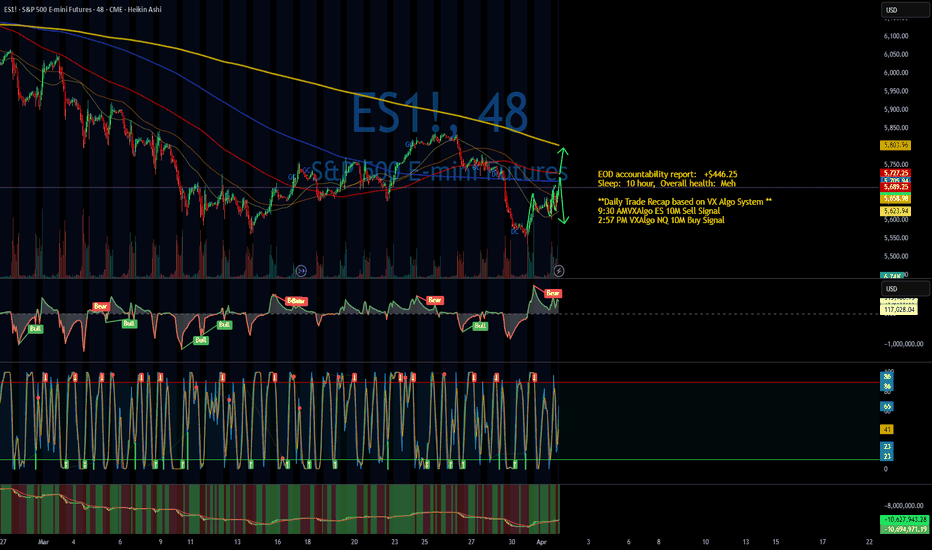
Daily Trade Recap based on VX Algo System EOD accountability report: +$2,337.50
Sleep: 5 hour, Overall health: not gud
**
Daily Trade Recap based on VX Algo System **
9:36 AM VXAlgo NQ 48M Buy Signal,
9:44 AM Market Structure flipped bullish on VX Algo X3!
11:13 AM VXAlgo ES 10M Sell Signal (lost $525 on this play)
1:21 PM VXAlgo ES 10M Sell Signal
2:05 PM VXAlgo NQ 48M Sell Signal
2:40 PM VXAlgo ES 10M Buy signal (triple signal)
Overall a pretty wild day, I'm extremely glad that we have a system that works and reads the MM very well.
The only thing we need to do is be extremely disciplined and pull the trigger without hesitation.
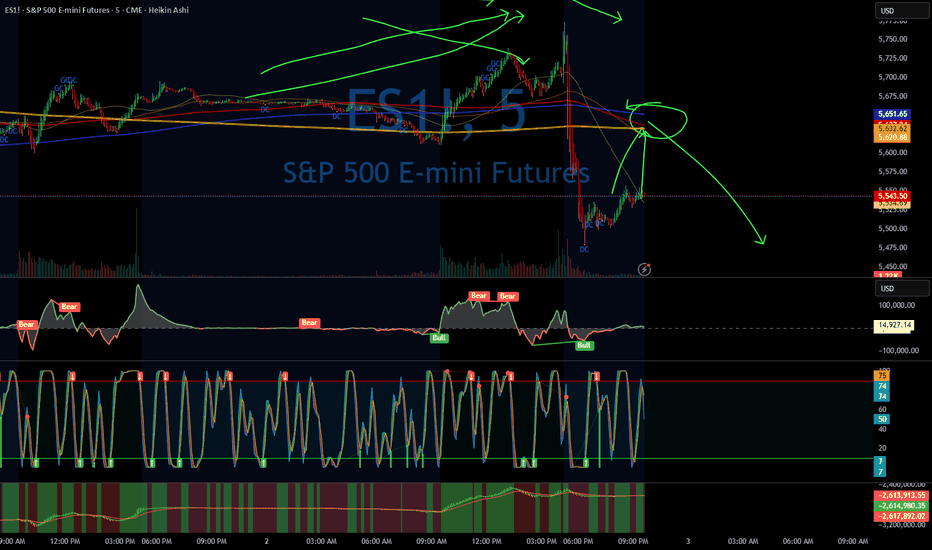
ES Open Gap AlerrtKinda expected that there will be an open gap after the break. Algos are trying desperately to bring futures back up, and much like I told you the other day, they're selling gold futures to do it. So much gold future that it's not tracking spot price, lol. I don't think I've ever seen that aside from when oil futures went negative during COVID.
Probably gonna just stick with gold, RSI is not oversold yet, so it may drop further before rebounding to fill teh gap.
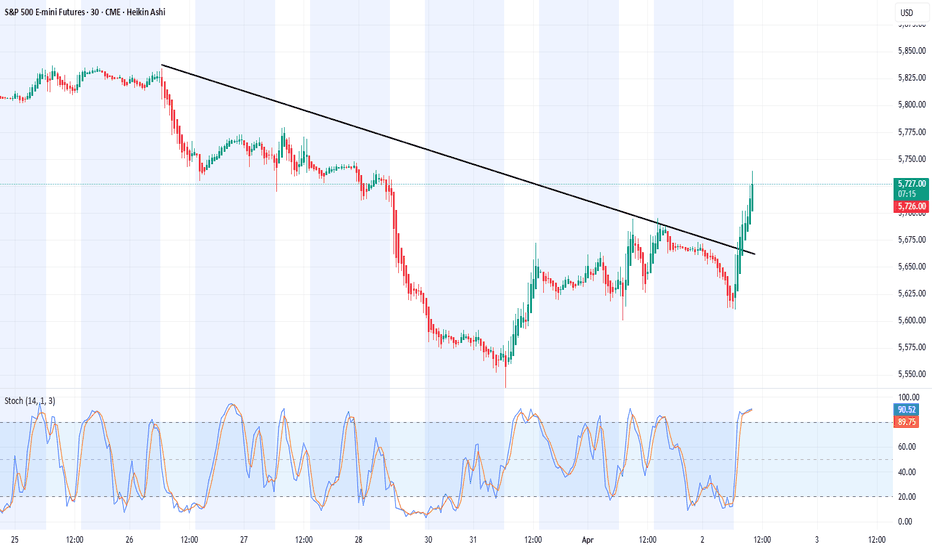
Up and Away with a Cup and HandleThis pattern forecasts 5750 for the Jun e-mini's. We might even hit that today! Considering how ugly the opening call was, this day has been a miracle. You might recall I forecasted this 2 days ago, but even a blind pig can roll across an acorn every once in a while.
Q1 Recap and What’s AheadThe first quarter of 2025 saw significant price movements in many different asset classes. Traders saw equity indices broadly selling off with the ES contract falling near 10% from the highs while Gold continued to push higher to all time high levels. There are many factors contributing to the price movement, including a shift in the administration in the U.S., geopolitical tensions globally, and critical tariff announcements looming. There are also questions about the Fed environment and the strategy that will be implemented this year to begin cutting interest rates. Looking at the CME Fed Watch Tool today, it seems the market is pricing another rate pause for the May meeting and a near 60% chance of rate cuts coming in June.
There is a large slate of economic date coming out for the rest of the week that could add great volatility to this uncertain market, including:
Tariff Announcement
Initial Jobless Claims
Nonfarm Payroll
Unemployment Rate
Average Hourly Earnings
This morning, traders saw the ADP Nonfarm Employment Change come in higher than expected and the markets are having a mixed reaction. President Trump will be speaking at 3:00 P.M. Central Time to introduce the tariff plan and how it will be rolled out, adding a level of clarity for the market moving forward into Q2.
If you have futures in your trading portfolio, you can check out on CME Group data plans available that suit your trading needs tradingview.com/cme/
*CME Group futures are not suitable for all investors and involve the risk of loss. Copyright © 2023 CME Group Inc.
**All examples in this report are hypothetical interpretations of situations and are used for explanation purposes only. The views in this report reflect solely those of the author and not necessarily those of CME Group or its affiliated institutions. This report and the information herein should not be considered investment advice or the results of actual market experience.
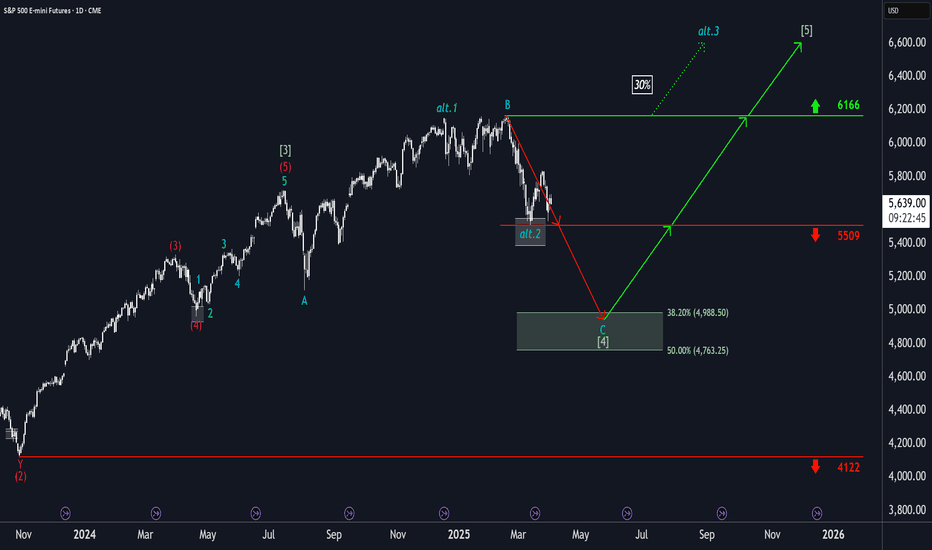
S&P500: Persistent SupportThe S&P 500 continued its recovery following its reaction to the support at 5509 points. However, in our primary scenario, we expect the index to fall below this mark to ultimately complete wave in green within our color-matched Target Zone (coordinates: 4988 points – 4763 points). Within this range, there are entry opportunities for long positions, which could be hedged with a stop 1% below the Zone’s lower boundary. Once the corrective movement has reached its low, the final upward movement of the green wave structure should commence. In the process, the index should gain significantly and reach the high of wave above the resistance at 6166 points. If this mark is surpassed prematurely, our alternative scenario with a 30% probability will come into play.
ES shorts with statistical projectionsWeekly manipulation targets were hit on Monday, leaving way for bearish price action for the rest of the week. I have been bearish since Tuesday, with the bullish daily manipulation targets being hit as well. I am looking for lower prices into the bearish targets for the week.


