S&P futures daily chart reviewThe very basic structure of price action is Spike, Pullback and Channel, final flag, double top and reverse to test the start of the channel. I would expect a minor reversal soon, since the market is so badly oversold, but there will be sellers above and a second leg will take the market to target. The lower probability event is a continued move straight to target. IN either case, the bull case is being badly damaged, and may lead to a 2022 multi-leg selloff.
For the first time since 2022, the trade is bearish, and bears are making money.
ISP1! trade ideas


ES Morning Update March 11thYesterday marked the largest red day in ES since the August 5 capitulation low. After deep sell-offs, squeezes typically come from my core setup: The Failed Breakdown—which triggered at 9:30 PM, now up +75 points, as outlined in the plan sent out yesterday evening.
As of now:
• Hold the runner
• Next targets: 5668, 5688, 5703
• If 5628 fails, expect a dip to 5609 first

ES1!: Bearish bearish bearish, intra-day levels I feel like I want to be kind this week and share my levels just because so many people are being silly and trying to long a very clear sentiment shift.
Listen, I get it, it was bullish and then it wasn't.
The market makes things reality faster than the human brain and emotions can accept.
You need to be quick to change your tune guys or you're going to continue to sustain losses.
I have been doing this for too long and can come across as harsh to some, but I just don't have time for stupidity.
Market is bearish, until it isn't. Stop trying to get cute.
That said, I am expecting a bounce very soon, we statistically speaking should see a re-test of the ema 200 breakdown within the next few days, if not tomorrow.
The numbers on the levels in the chart represent the probability associated with hitting the levels as a %.
Stick to day trading IMO and play the levels/support and resistance.
Not advice and please please please be safe and use your brain, no your emotions.

LONG ON ESLearning a new strategy, lets see how it does. Been in sell mode for a while now, hoping for a push up. Marked out daily areas and zones.

ES Daily Update - RSI oversold, MFI is not quite there yetHey look, I'm back.
TBH, I got a day job and took a break from day trading, but the Trump tank lured me back into the market the past month, lol. Bit of a rough restart the first week, but made $10k each of the past 3 weeks including today.
I figured something like this was gonna happen today so I carried TSLA puts from Friday. As you can see, futures left an open gap last night, so that caused me to get out of my puts waaaay too early, got into calls too early as well, lost all my profit for the day but made it up in the last hour and bailed, lol. $10k swing 3 times for a lot of heartburn.
Daily RSI hit oversold as did the 3hr, but it looks like MFI needs to hit oversold before we get a pump to fill that open gap. So far, everything is just dumping the Trump pump from November.
Not planning on shorting anything again until the open gap fills, will take another shot at going long if 3 hr RSI and MFI hit oversold again tomorrow or Wed. There's also that Friday afternoon pump that's worth playing if indicators line up.
Sorry, no premarket updates, I'm on east coast time zone and at work at 9:30.

ES at the $5,150 Critical Level: Fibonacci 50% RetracementThe weekly chart of the ES shows that the price action is currently retracing to key Fibonacci levels, with the 50% retracement zone sitting around $5,150. Historically, this mid-point retracement has been significant—as it often marks a confluence area where buyers step in and support emerges. In past cycles, when the ES has retraced to a similar 50% level, it has frequently served as a bottom, with momentum indicators (such as the divergence signals and MACD) confirming a reversal.
In the current setup, the presence of negative divergences on the momentum indicator suggests that, despite recent price declines, the selling pressure may be beginning to wane. Additionally, any potential bearish crossover in the MACD could be the last sign of weakness before a turnaround. When similar conditions occurred in previous recession-linked corrections—where fiscal stimulus or other external supports had temporarily masked underlying issues—the eventual unwinding of those supports led to a consolidation near these Fibonacci levels before a recovery ensued.
Given this historical context, a drop toward the $5,150 level could represent a critical turning point. If the ES finds strong support at this level, mirroring past instances where the 50% retracement served as a bottom, it might signal the exhaustion of the downtrend and set the stage for a rebound. This technical confluence—Fibonacci support, divergence signals, and MACD cues—suggests that the market is at a juncture where previous stimulus-driven recoveries eventually gave way to bottom formations, which could be repeated in today’s environment.

Generational Dip Buy in SPYAfter a period of significant volatility, there are signs that the market may have found a potential bottom. Price action suggests a shift in momentum, with recent support levels holding strong and bullish indicators beginning to align. The broader trend could be setting up for an upward move as buyers start to step in. It may be worth watching for further confirmation of this reversal, as a continuation of this pattern could lead to an extended rally in the near term. Stay tuned for price action to confirm the direction.

AnticipationThe break to lower prices in the daily chart of the S&P 500 is an example of the stock market reacting to what I refer to as the anticipation of a recession which has not occurred this means the market is responding to the possibility of a recession not the reality of being in a recession. It can be difficult for market to maintain directional movement based on anticipation characteristics.

brick by brick Asian Session: 3-Minute Precision Entries 🚀
🔹 1H Trend → 3M Entry
🔹 3M Trailing Stop for Risk Management
🔹 Multiple Re-Entries Within Trend
🎯 Plan: Follow the 1H trend, enter on 3M confirmations, trail stops, and re-enter when setups align.
#AsianSession #PriceAction #Scalping

S&P 500 Mini Futures - FIBS - 11 March 2025Firstly - look at these fibs! Study them! Look at the levels how well respected they are! Amazing!
So, for some reason, playing around in the past. DXY and Stocks 0.236 is the majic number.
Having said that. Not for certain and only posting as an idea. Trend based fib pulled ABC as depicted in green. Which gives fibs. Currently 0.382 support. Not sure if were yet going to hit 0.236. If we do it's pointing to around June/July upswing.
Anyway, also at 0.382 speed fan support. 0.236 seems to align with the 0.75. Depicted in blue how I pulled the levels for the speed fan.
Similar BTC ideas can be found here:
Just an idea. Happy trading. :) Using Fibs in this example as a guide.

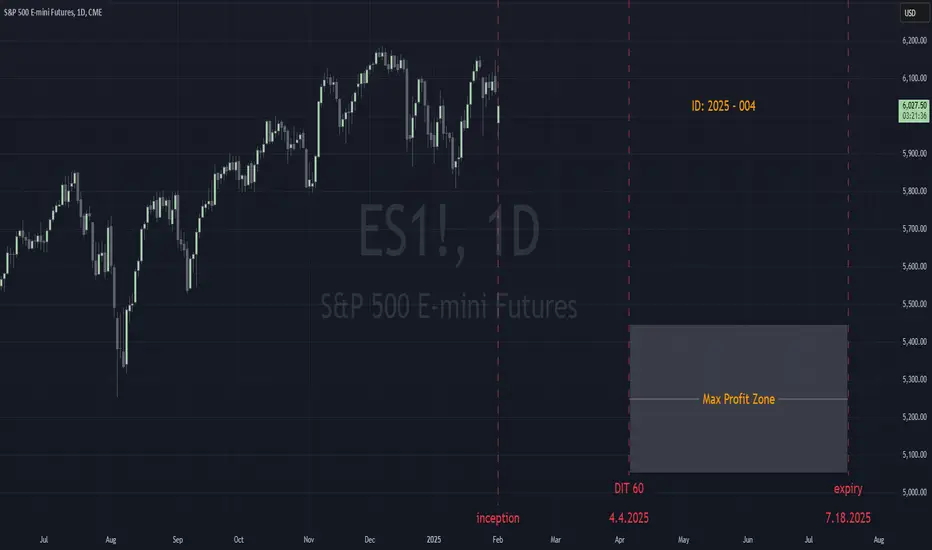
ID: 2025 - 0042.3.2025
4rd trade of 2025 executed.
Trade entry at 165 DTE (days to expiration).
Trade construct is a PDS (put debit spread) at Delta 15 combined with a PCS (put credit spread) at Delta 15. Overlapping short strikes give it the "unbalanced" butterfly nomenclature.
Sizing and strike selection is designed to keep the risk/reward "AT EXPIRATION" to a 1:1 risk profile. This lets charm work it's magic (second order greek), while exploiting the fact that this is a non-directional bias. The process is a disciplined and systematic approach letting time decay evaporate the extrinsic time value from the short options until target profit is achieved.
IF target profit is not captured after 60 DIT (days in trade), then target is reduced by 50% for the next 30 days.
Happy Trading!
-kevin
ID: 2025 - 0031.27.2025
3rd trade of 2025 executed.
Trade entry at 144 DTE (days to expiration).
Trade construct is a PDS (put debit spread) at Delta 15 combined with a PCS (put credit spread) at Delta 15. Overlapping short strikes give it the "unbalanced" butterfly nomenclature.
Sizing and strike selection is designed to keep the risk/reward "AT EXPIRATION" to a 1:1 risk profile. This lets charm work it's magic (second order greek), while exploiting the fact that this is a non-directional bias. The process is a disciplined and systematic approach letting time decay evaporate the extrinsic time value from the short options until target profit is achieved.
IF target profit is not captured after 60 DIT (days in trade), then target is reduced by 50% for the next 30 days.
Happy Trading!
-kevin

ID: 2025 - 0052.18.2025
Trade #5 of 2025 executed. So simple, yet far from easy...
Trade entry at 178 DTE (days to expiration).
Trade construct is a PDS (put debit spread) at Delta 15 combined with a PCS (put credit spread) at Delta 15. Overlapping short strikes give it the "unbalanced" butterfly nomenclature.
Sizing and strike selection is designed to keep the risk/reward "AT EXPIRATION" to a 1:1 risk profile. This lets charm work it's magic (second order greek), while exploiting the fact that this is a non-directional bias. The process is a disciplined and systematic approach letting time decay evaporate the extrinsic time value from the short options until target profit is achieved.
IF target profit is not captured after 60 DIT (days in trade), then target is reduced by 50% for the next 30 days.
Happy Trading!
-kevin

es 5575-80 is a backtest of a break outin the past es has respected these break out backtest lines. i expect a reaction and repeated holds at this line.

Putting the current pullback from ATHs into context ES FuturesCME_MINI:ES1!
Big Picture:
ATH on December 6th, 2024: 6,184.50
There has been no significant correction or pullback since the ATH.
Currently, the market has pulled back ~8.20% from the ATH.
The previous correction (over a 10% pullback, but less than a 20% downturn) occurred after ES futures hit an all-time high of 5,856 on July 15th, 2024. The market bottomed out on August 5th, 2024.
Currently, ES futures are trading below the 50% retracement level from the ATH on December 6th, 2024, and the swing low on August 5th, 2024, at 5,719.25.
Given the current "risk-off" sentiment, let's review the updated price map for ES Futures.
Key Levels:
Important level to reclaim if no correction: 5,795.25 - 5,800
Key LVN (Low Volume Node): 5,738 - 5,696
Mid 2024 range: 5,574.50
Key Support: 5,567.25 - 5,528.75
2024 YTD mCVAL (Market Composite Value Area Low): 5,449.25
2022 CVAH (Composite Value Area High): 5,280
Key Support: 5,567.25 - 5,528.75
This zone is important in the event of a 10% pullback, which could lead to a bounce thereafter.
On our regular 4-hour time frame, which we use for weekly analysis and preparation, higher lows have been breached, and ES futures are now trading below the lows from November 4th, 2024, January 13th, 2025, and February 28th, 2025.
The probable next downside target is the 50% retracement of the 2024 range, which stands at 5,574.50.
Unless we see a sustained bounce that reclaims the 5,795.25 - 5,800 zone, the key support level at 5,567.25 - 5,528.75 is likely to be tested, aligning with our expected 10% pullback.
Note that a bear market (i.e., a pullback greater than 20%) wouldn't begin until prices drop to around 4,900, which is still about 750 points away from the current price level of 5,650.
Considering all the above, what can we expect this week?
CPI and PPI data are due this week, and the market is currently in "risk-off" mode. This sentiment is exacerbated by Federal Reserve Chairman Powell's comments on needing more data before altering rate path, combined with tariffs complicating the US economy.
What price level might prompt policymakers to adjust their stance?
The Fed’s dual mandate considers both 2% inflation and low unemployment. With the unemployment rate edging above 4% and inflation remaining high, this upcoming inflation reading is critical. We believe this report may trigger volatility not seen in recent months with CPI releases. We have the SEP and FOMC rate decision coming up on March 19th, 2024.
Scenario 1: Soft CPI than expectations
Expecting volatile price action, however, a V-shaped recovery given softer CPI reading. Markets go in wait and see
Scenario 2: Range bound week
In this scenario, we expect a range bound week, with inflation print in line and markets in wait and see mode for FED FOMC announcement.
Scenario 3: High CPI print
With a higher CPI print, FED will be in a difficult position to cut rates. Will this bad news be bad for the market or good? Mounting risks point to further downside if we do not get any pivot on macro level to support the economy.


ES Morning Update Mar 10thFor the last three days, 5720 has been the key battleground in ES—testing, bouncing, breaking below, squeezing, and repeating. After another bounce to the 5764+ target on Friday, we’re back under it again.
As of now:
• Same setup: 5720 must reclaim to target 5745, 5763
• If 5700 fails, expect a dip to 5676 first

ES - Strong rejection of lower prices On ES , it's nice to see a strong buying reaction at the price of 5697.
There's a significant accumulation of contracts in this area, indicating strong buyer interest. I believe that buyers who entered at this level will defend their long positions. If the price returns to this area, strong buyers will likely push the market up again.
Strong rejection of lower prices and high volume cluster are the main reasons for my decision to go long on this trade.
Happy trading
Dale

DELAYED UPLOAD OF PREMARKET ANALYSISDelay Upload of ES and NQ premarket Analysis. We hope its still of value

S&P e-mini daily chart reviewDaily chart review 3-9-25
I see a bull flag wedge, with nested wedges as well, and a tight bear channel down. This week could see a push up from a double bottom to test prices above.
Friday's reversal bar is the 3rd attempt for bulls to reverse this trend, increasing the likelihood
of a significant pullback from this bearish channel. This week, I expect bullish action before trend resumption downward. The lower probability event would be a large
bearish breakout from here, which could be powerful and lead to 1-2 more legs down.

S&P e-mini Weekly chart reviewWeekly review 3-9-25
2 weeks ago saw a non-overlapping bear bar signaling likely continuation down. We have now
completed a bull flag wedge pattern testing the breakout of the Sept 9th week. Last week's bar was strong, suggesting lower prices, but I expect a pullback first. This is
a tight channel down, and the market is in AIS, and there will be sellers above. That being said, I expect a pullback next week before bears get another leg down. I expect buying early in the week at least. The lower probability event would be another strong bear bar, which would
likely result in 1-2 more legs down before a pullback.

S&P e-mini futures monthly chart review 3-9-253-9-25 Mnthly chart review
Bear breakout, but from a bad buy signal.
Likely 2 legs sideways to down from here. I think this is leg 1
Depending on your count, the trend up lasted 26 or 14 bars. You would expect a correction
of half that many bars at least, meaning either 14 or 7 bars, sideways to down. We've had 4,
meaning at least 3 more bars sideways to down is a safe bet. We will also likely overlap the
lower wick of Feb's bar by some amount soon. This March bar is in it's early formation, which
is less favorable for the bulls. The later part of the month is when you want to see the
breakout. I think it's high probability that we eventually touch the EMA, but that may take 2-3 months.
