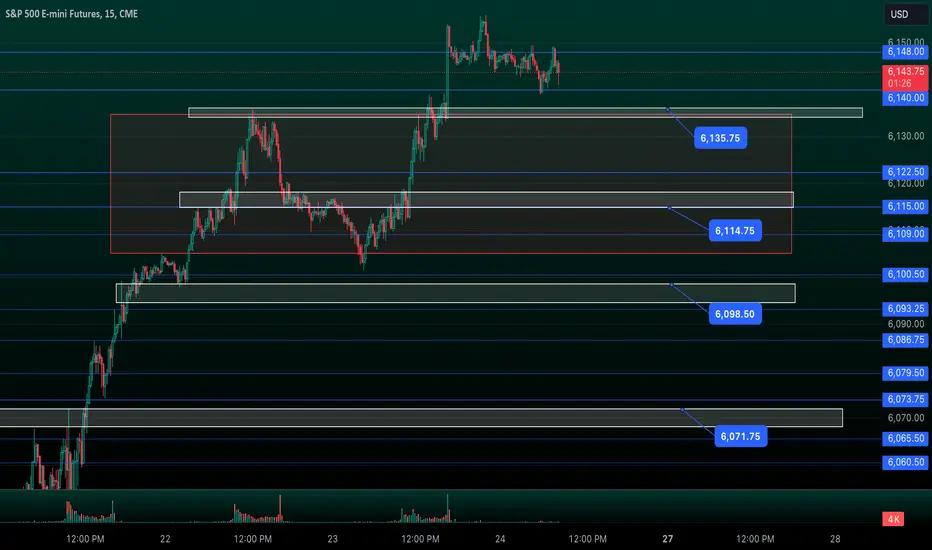
ES/SPX Morning Update Jan 24thES has been on an 8-day winning streak, with momentum still riding off Monday’s 6020 Failed Breakdown. Yesterday’s reclaim of 6115 drove the move to my key targets at 6136 and 6154, both hit.
As of now:
• 6135 = support; holding above keeps 6161, 6172, and 6185 in play
• If 6135 fails, expect a dip to 6115, then 6098-6105
ISP1! trade ideas
OIL THE RUSSELL THE ES SPENDING TIME ON REVERSAL PATTERNS JANUARY 24TH the es has traded to a double top and its all-time high and I explained why I would not be buying that Market at this time and I compared it to the Russell and why I would be more inclined to short that market as a shorting the ES. we took a quick look at Gold went over some details with the es that could have had 1 or 2 extensions that could influence a trade decision now versus later.

MES!/ES1! Day Trade Plan for 01/23/25MES!/ES1! Day Trade 🎯 for 01/23/25
📈 6166 (NEXT LEVELS: TBD)
📉 6056.75 (NEXT LEVELS: TBD)
1/2 way mark 📈 6138.75 & 📉 6084.25
Like and share for more daily ES/NQ levels 🤓📈📉🎯💰
*These levels are derived from comprehensive backtesting and research, demonstrating over 90% accuracy. This statistical foundation suggests that price movements are likely to exceed initial estimates.*

Can we finished the week with confidence?The expectation is for buyers in the S&P 500 finish the week with a confident close above 6170.

S&P futures daily chart AIL buy climax at key levelS&P is all-in-long, in a tight bull channel, buy for any reason, but now at a point of likely exhaustion after a possible climax. Price testing the breakout point from the last FOMC day and big selloff. Bulls will take profits here and bears will look for a foothold to sell. Since the market is in a large trading range, odds favor a pullback. If price continues higher, odds will favor a deeper pullback and possible reversal. Likely a small trading range today.

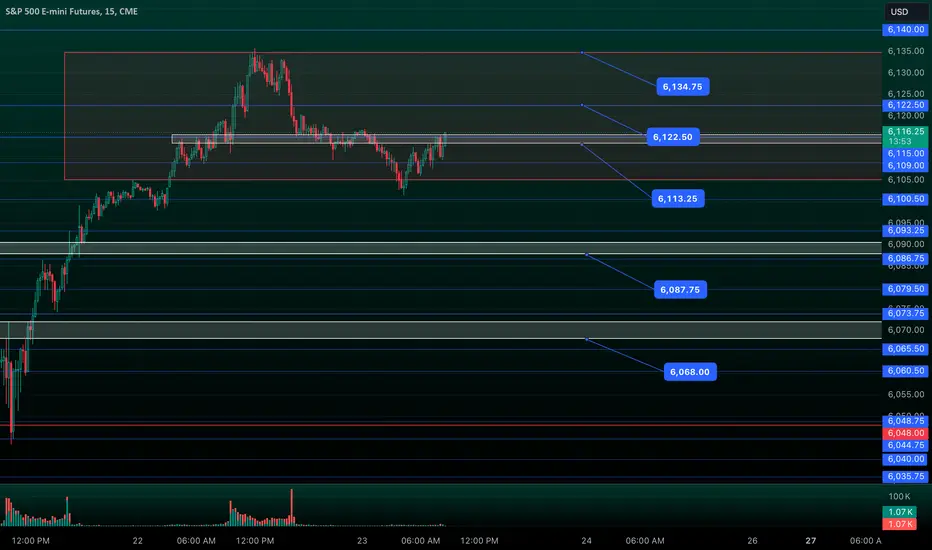
ES Morning update Jan 23rdYesterday, my final target for ES was 6137, and we reached 6135.75 before sellers stepped in. Now, the market is working on a base, creating some tricky chop.
As of now:
• Expect 6105-6135 chop, with 6115 as the mid-pivot
• Reclaiming 6115 targets 6123 and 6135+
• If 6105 fails, look for a selloff to 6087 and 6072
S&P zigzag auto horizon linesthe zigzag auto horizon lines
indicator is a great tool
but to make it even better (precise)
you could should use only the nearest support/resistance level
clear 3 times up move on S&P and
clear 2 times down moves
dont worry if you miss the entry on first touch, there will often be another rejection

S&P 500 (March 2025) - Clock Is Ticking For $7,000 ES!Happy new year traders!
This is a perfect time to do a review on the S&P 500 continuous contract and ESH (March 2025) contract as it's the 1st month where you see the beginnings of the 6-Month candle form, which can be very powerful for gauging a bias.
Tech stocks have been rallying since trump came into office and it doesn't seem to have a end in sight.
They say the trend is your friend until it isn't.
Aiming for previous all-time highs until proven otherwise.

S&P ES Long setup target 6129 / Calls SPY target 605Fibonacci technical analysis : S&P 500 E-mini Futures CME_MINI:ES1! has already found support at the Fib level 78.6% (6020.50) of my Down Fib. Last Daily candle (Jan 17) has closed above retracement Fib level 78.6%. My Down Fib guides me to look for ES1! to eventually go up to hit first target at Fib level 127.2% (6129.00).
CME_MINI:ES1! – Target 1 at 127.2% (6129.00), Target 2 at 161.8% (6206.00) and Target 3 at 178.6 (6243.50)
Stop loss slightly below the 61.8% retracement Fib level (5983.00).
Option Traders : My SPY AMEX:SPY chart Down Fib shows price to go up to Target 1 at 127.2% (605), Target 2 at 161.8% (613) and Target 3 at 178.6 (616)
Stop loss slightly below the 61.8% retracement Fib level (592).

MES!/ES1! Day Trade Plan for 01/22/25MES!/ES1! Day Trade 🎯 for 01/22/25
📈 6143 (NEXT LEVELS: TBD)
📉 6049 (NEXT LEVELS: TBD)
1/2 way mark 📈 6120 & 📉 6073
Like and share for more daily ES/NQ levels 🤓📈📉🎯💰
*These levels are derived from comprehensive backtesting and research, demonstrating over 90% accuracy. This statistical foundation suggests that price movements are likely to exceed initial estimates.*

Be cautious on the long sideThe structure in the S&P 500 implies being cautious on the long side. The next objective to the upside is 6150.

ES SHORTLooks like a nice rejection off the 1 hour order block from December, mitigated for the first time. it looks to me like we have taken plenty of liquidity and can retrace here.

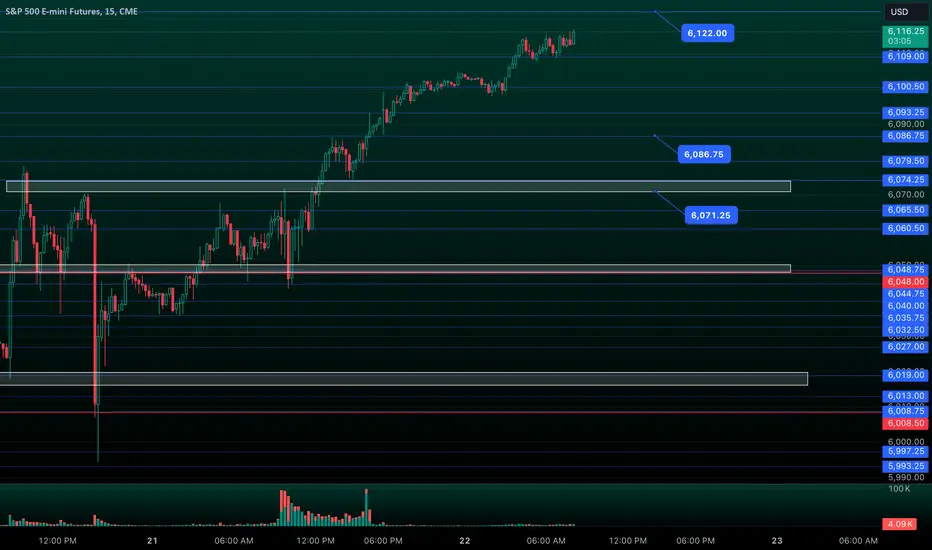
ES Morning Update Jan 22ndBig payoff in ES: Yesterday’s target off my 6043 support was 6087, and reached with ease after bouncing off 6043. 6105 and 6115 upside targets have been hit as well.
As of now:
• keep riding the runner until the move ends if you have them
• Next targets: 6122, 6129, and 6137-45 if ES pushes higher
• Supports: 6087 and 6071; sell below those levels
Lower into the New MoonNothing new ever occurs in the business of speculating or investing in securities and commodities.

Elliott Wave View on S&P 500 Futures (ES) Looking to Resume HighShort Term Elliott Wave view in S&P 500 Futures (ES) suggests that rally to new all time high on 12.16.2024 at 6163.75 ended wave ((3)). Pullback in wave ((4)) is proposed complete at 5808.4 as the 1 hour chart below shows. Internal subdivision of wave ((4)) unfolded in a double three structure. Down from wave ((3)), wave (W) ended at 5866 and wave (X) ended at 6107.5. Wave (Y) lower ended at 5809 which completed wave ((4)).
The Index has turned higher in wave ((5)), but it still needs to break above wave ((3)) at 6163.75 to rule out a double correction. Up from wave ((4)), wave ((i)) ended at 5918.5 and wave ((ii)) pullback ended at 5842.50. Index nested higher in wave ((iii)). Up from wave ((ii)), wave (i) ended at 5898.75 and pullback in wave (ii) ended at 5848.75. Wave (iii) higher ended at 6017.50 and pullback in wave (iv) ended at 5961.75. Final leg wave (v) ended at 6078.25 which completed wave ((iii)). Dips in wave ((iv)) ended at 5994.5. Expect wave ((v)) to complete soon which should end wave 1 in higher degree. Afterwards, it should pullback in wave 2 to correct cycle from 1.13.2025 low in 3, 7, or 11 swing before it resumes higher.

$ES1 Could Break UP!!Bearish Divergence not playing out. When divergences don't play out, the moves should be strong...In the OPPOSITE direction.
