Investment Opportunity Intel (Short)Intel is Bearish on a Monthly timeframe, the price reacted on a supply zone and switch from bullish to bearish structure in weekly timeframe, we can observe a break of structure.
This is the signal to sell Intel.
First target (24$)
Second target (16$)
ITLC34 trade ideas

INTC potential buy setupReasons for bullish bias:
- Price bounced from strong weekly support
- Price respected channel support
- Weekly and daily bullish candle closing
Entry Level (CMP): 43.28
Stop Loss Level: 39.56
Take Profit Level 1: 47
Take Profit Level 2: 50.72
Take Profit Level 3: Open

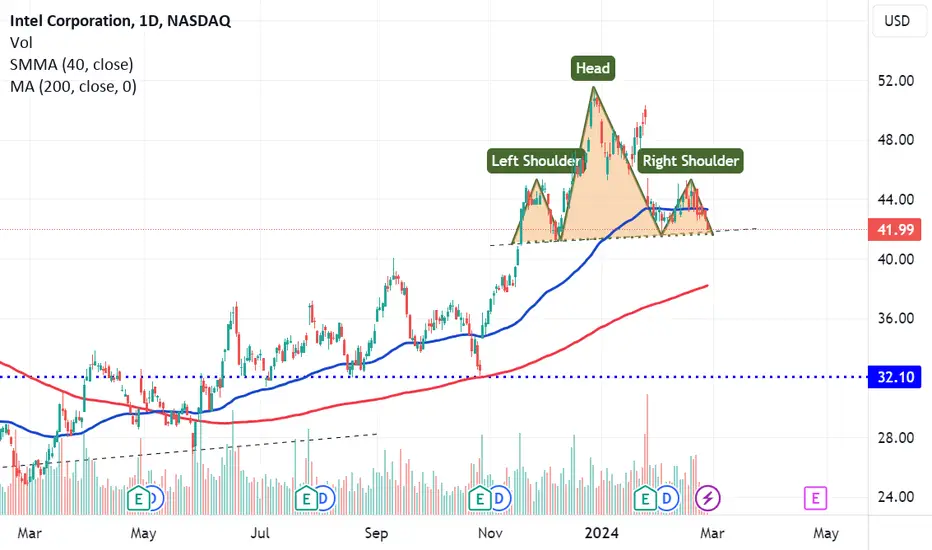
$INTC Ominous looking chart Head and shoulders formation
A break of the neckline could see a target all the way down to $32
Nothing goes in a straight line, so the expectation is that the neckline could be tested more than once before either breaking down, or even going up.
INTC ReboundAfter a massive gap down, INTC closed at the 200D SMA. RSI is at its lowest level and while net volume was negative, it began to rebound. Looking for a short term bounce off the 200D

INTL looking good for the 5th waveBuying INTL today. The setup looks good. Price has reached the lower bound of falling wedge at the end of wave 4. Looking for the pivot point on the RSI to confirm
Targetting $50.50 price

INTC Swing Long Conservative Trend Trade Conservative Trend Trade
+ long impulse
+ expanding T2 level
+ support level
+ unvolumed 2Sp
+ volumed test
+ below first bullish bar closed level entry
Calculated affordable virtual stop loss
1 to 2 R/R take profit
Daily Context
"+ long impulse
+ SOS level
+ support level
+ unvolumed Sp"
Monthly Context
"+ long impulse
+ SOS level
+ support level
+ 1/2 correction"
Give me a way better price at afterhours.
I just need my 2 R and I'm out!

Intel's Foundry Stumbles: Can the Chip Giant Catch UpIn the high-stakes world of semiconductor manufacturing, Intel ( NASDAQ:INTC ) finds itself in a race against time to reclaim its dominance. However, recent revelations about the company's foundry business underscore the uphill battle it faces in catching up with its arch-rival, Taiwan Semiconductor Manufacturing Co. (TSMC).
The latest blow came with Intel's admission of ballooning losses at its contract chip-making business, sending its shares tumbling by 5% before the bell on Wednesday. The numbers paint a grim picture: operating losses of $7 billion in 2023, a significant increase from $5.2 billion the previous year. This signals a widening chasm between Intel and TSMC, casting doubt on Intel's ability to bridge the profitability gap anytime soon.
Analysts, such as Stacy Rasgon from Bernstein, have expressed skepticism, suggesting that Intel could be facing several years of substantial headwinds. Despite Intel's aggressive capital investments – totaling $43.4 billion in "construction in progress" as of December 2023 – and plans to spend $100 billion on plants across the United States, doubts linger over whether these efforts will yield the desired results.
CEO Pat Gelsinger's reassurances about the foundry business's future profitability haven't assuaged concerns. Gelsinger predicts that operating losses will peak in 2024 before breaking even by around 2027, but with TSMC boasting a 53% gross margin compared to Intel's projected 40% by 2030, the gap remains substantial.
The contrast between the two giants becomes starker when examining revenue figures. TSMC's revenue in the final quarter of 2023 stood at a staggering $19.52 billion, dwarfing Intel's foundry unit's sales of $18.9 billion for the entire year. This vast difference underscores the magnitude of the challenge facing Intel.
One of the key factors behind Intel's struggles has been its past missteps. Gelsinger admits that decisions such as forgoing the use of extreme ultraviolet (EUV) machines from ASML have hindered the company's progress. Intel's belated switch to EUV tools reflects a recognition of the need to embrace cutting-edge technology to remain competitive.
As Intel grapples with these challenges, questions arise about its ability to execute its ambitious plans and regain its position as a dominant force in chip manufacturing. The company's fortunes are intertwined with the success of its foundry business, and failure to close the gap with TSMC could have far-reaching consequences.
In the fiercely competitive semiconductor landscape, where innovation and efficiency reign supreme, Intel finds itself at a critical juncture. The road ahead is fraught with challenges, but whether Intel can rise to the occasion and reclaim its former glory remains to be seen. As the industry watches with bated breath, the battle for semiconductor supremacy continues unabated.
INTC for the GAINS - cup and handleShowing key levels for a cup and handle move on INTC. We've maintained price in the 38.2, so far. this is bullish for an upward move.

INTC Swing Ling Aggressive Counter Trend TradeAggressive Counter Trend Trade 12
- short impulse
+ volumed T1
+ bigest volume Sp
+ weak test
+ first bullish bar closed level entry
Calculated affordable virtual stop loss
1 to 2 R/R take profit
Daily Chart Context
- short impulse
+ biggest untested volume T1
+ biggest volume Sp
Hourly Chart Context
- short impulse
+ volumed T1
+ bigest volume Sp
+ weak test
+ first bullish bar closed level entry

Small buy opportunity on IntelHello,
Intel Corporation engages in the design, manufacture, and sale of computer products and technologies. It delivers computer, networking, data storage, and communications platforms. The company is currently in a correction setting the stage for a small buy opportunity.
I will be buying the stock from the current share price with my target 1 as the previous top.
The company is lagging compared to Nvidia.
Good luck!

Intel Corporation UpWe hit support.
We had 2 good days up strong buying from support.
Great opportunity for a 1/1 trade.

INTC Awaits a reversal from the bottom of the recent price rangeINTC in the past week trended up and reversed into a trend down which then went into a low
volatility narrow range consolidation to finish out the week. I see INTC as being in the bottom
of its recent trading range and ready to head higher inthe upcoming week. The RSI lines are
in the area of 35-40 and the slope of the regression line is rapidly decreasing. On the
15 minute chart based on the volume profite and a Fibonacci retracement I have marked
out two targets and the stop loss. I am going back to the well as INTC paid me in February
and appears ready for a swing trade long here. Although, it is in the shadows of NVDA and the
others INTC along with SOUN, DELL, HPE and been recent winning trades and going back
to what has worked in the recent past is my strategy here.

INTC Triple Bottom? Wow lets see if it pops and pumps.
Volume is so far moving in accordance with a classic triple bottom formation:
Remember:
- Like double bottoms, selling volume should trend downward as the pattern forms.
- The longer the pattern takes to form the stronger the pattern tends to be.
- Need a good downtrend preceding the pattern.
- A valid breakout will be accompanied by a sudden rise in volume

Intel may bounce off the support zoneIntel may bounce off the support zone. One could buy and book half position after 1:1 is achieved and trail the rest position even beyond 1:2.

INTC Long Day Conservative Counter Trend Trade Conservative Counter Trend Trade 12.1
+ long impulse
- volumed expanding T2
- 1/2 correction
+ support level
+ biggest volume manipulation
+ closed above support level
Calculated affordable virtual stop loss
1 to 2 R/R take profit
Hourly Context:
- short impulse
+ volumed T1
+ bigest volume Sp
+ weak test
+ first bullish bar closed level entry
Daily Context
- short impulse
+ biggest untested volume T1
+ biggest volume Sp
Monthly Context
+ long impulse
+ SOS level
+ support level
+ 1/2 correction

Bounce off 200 day emaIntel has had a recent pull back to the 200 day ema. You can see that according to the DIY trading indicator that uses a combination of several indicators and order blocks, that there is demand near this 200 day ema. I think a bounce is likely.

Stocks pairs trading: ON vs INTCAnalyzing the financial indicators and market positions of ON Semiconductor Corp. (ON) and Intel Corporation (INTC) offers insightful perspectives for investors.
Reasons to Consider Buying ON Over INTC:
Valuation and Earnings Outlook: ON's forward P/E ratio of 14.64, compared to INTC's higher forward P/E of 18.75, suggests that ON is more attractively valued at current levels, potentially offering a better investment opportunity. Furthermore, ON's EPS next year is anticipated to be $5.06, signifying a robust earnings growth potential that eclipses INTC's expected EPS next year of $2.24, underlining ON's superior profit growth prospects.
Market Recovery and Expansion Potential: ON demonstrates promising growth indicators, including a projected EPS growth next year of 19.14% and a five-year EPS growth rate of 4.61%. In contrast, despite INTC's optimistic five-year EPS growth forecast of 43.08%, its immediate earnings outlook and recent performance (EPS next Q of $0.15 for INTC vs. $1.04 for ON) indicate that ON may be better positioned to capitalize on market recovery and expansion opportunities in the near term.
Strategic Industry Standing: With a market capitalization of $31.65B and a diverse product range that caters to high-demand sectors like automotive and industrial, ON is strategically placed to leverage industry trends and growth drivers. Although INTC, with a market cap of $177.28B, is a giant in the semiconductor sector, its current restructuring and focus on regaining technological leadership suggest a period of transition that might not immediately translate to stock performance uplift.
Reasons to Consider Selling INTC:
Relative Valuation and Growth Concerns: INTC's higher forward P/E ratio and substantial payout ratio (184.54%) reflect a pricier valuation and potentially constrained future growth due to its dividend commitments. Additionally, its near-term earnings forecast and recent quarter-over-quarter EPS growth of 489.86% might not sustain without substantial top-line growth and margin improvement.
Market Sentiment and Performance Metrics: INTC's recent performance metrics, including a year-to-date decline of -16.56% and a quarter performance dip of -10.94%, contrast with ON's more stable performance outlook. This disparity, coupled with market sentiment that may favor faster-growing semiconductor plays, makes INTC a less attractive option for growth-oriented investors.
Sector Dynamics and Operational Challenges: While INTC is navigating through significant operational and market challenges to reclaim its leadership in technology innovation, ON's current focus and execution in fast-growing semiconductor segments position it as a more compelling growth story in the near term. INTC's broader operational challenges, including yield improvements and competitive pressures, may hinder its short-to-medium-term performance potential.
Decision:
Buy 1 ON: Given ON's more attractive valuation, stronger near-term earnings potential, and strategic positioning within growth segments of the semiconductor industry, it represents a compelling buy.
Sell 2 INTC: Despite INTC's efforts to redefine its market stance and innovation trajectory, its current valuation, coupled with near-term growth uncertainties, suggests that reallocating investment towards more immediate growth opportunities like ON could yield better returns.

INTC Bullish triple bottomNASDAQ:INTC has been showing some very bullish signals on its RSI reaching underbought levels, and a triple bottom, resulting in a bullflag on the daily. I think this has room up to 48-50 to rise. They were also granted 8.5 Bln for the Ai chip plant construction.

Intel Secures $20B for New Factories: Trading Idea for 22/03/24Intel Corp., a leading chip manufacturer, is set to receive almost 20 billion USD in the US for the construction of chip manufacturing plants. This investment is part of a program to revitalise the American chip industry, including 8.5 billion USD in grants and 11 billion USD in loans. Federal funds are expected to start flowing by the end of the year.
The US plans to spend nearly 100 billion USD to support the industry, with new plants slated for construction in Ohio, Arizona, Oregon, and New Mexico. The escalating crisis in Taiwan has necessitated these measures amid political risks that local chip production could fall under China's control.
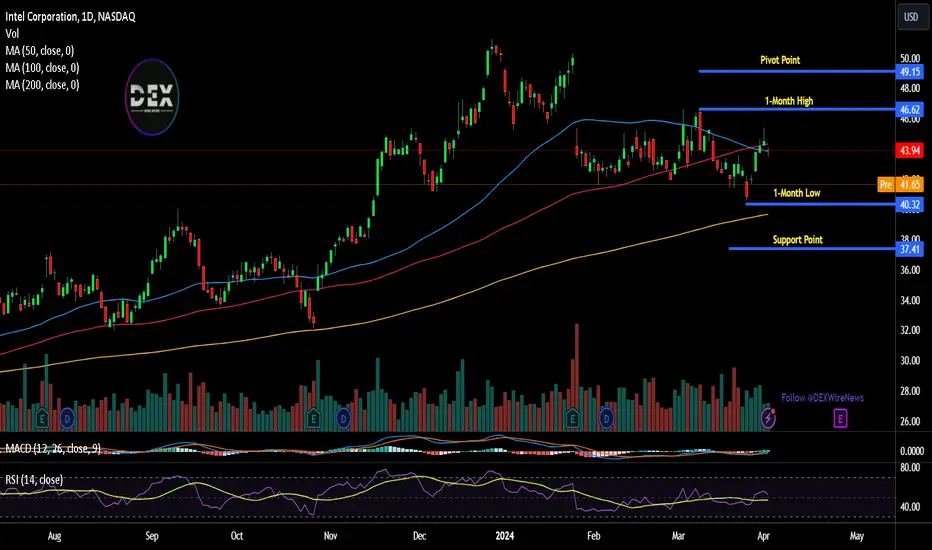
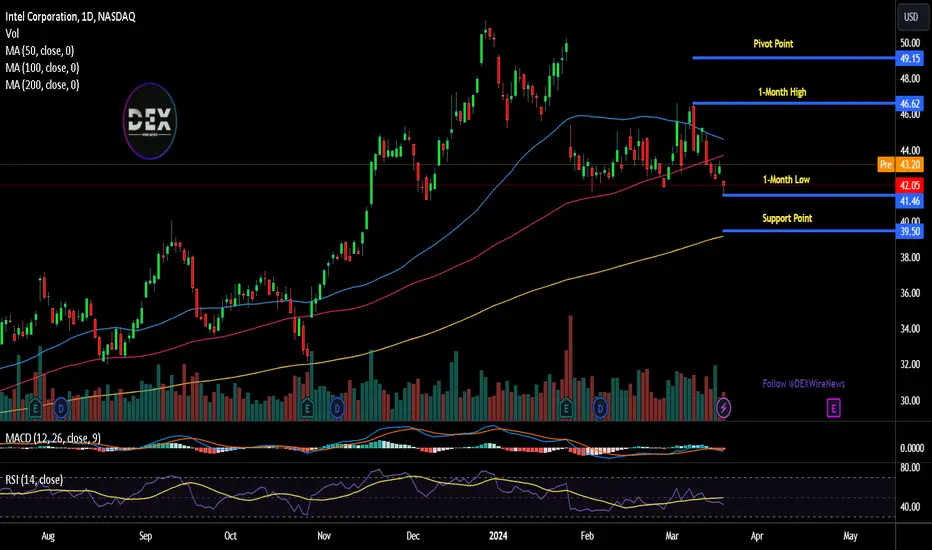
A technical analysis of Intel Corp.'s stock chart is intriguing in light of this development.
On the daily (D1) timeframe, a support level has formed at 41.91, with resistance at 46.61. Since the beginning of February this year, multiple rebounds from this support level have occurred. In case of another rebound, the stock price is highly likely to rise and break through the resistance.
On the hourly (H1) timeframe, long positions might be interesting when rebounding from the 41.91 level, with a short-term target at 41.26. Maintaining a long position up to 56.25 could be considered in the medium term.
—
Ideas and other content presented on this page should not be considered as guidance for trading or an investment advice. RoboMarkets bears no responsibility for trading results based on trading opinions described in these analytical reviews.
The material presented and the information contained herein is for information purposes only and in no way should be considered as the provision of investment advice for the purposes of Investment Firms Law L. 87(I)/2017 of the Republic of Cyprus or any other form of personal advice or recommendation, which relates to certain types of transactions with certain types of financial instruments.
Risk Warning: CFDs are complex instruments and come with a high risk of losing money rapidly due to leverage. 66.02% of retail investor accounts lose money when trading CFDs with this provider. You should consider whether you understand how CFDs work and whether you can afford to take the high risk of losing your money.


INTC - BullishThe support area (41-42) so far has been holding strong. There is a possibility of price trying that area again and shake out the stop losses placed under. However, can see it having potential of reaching the $48 zone. Higher time frame looking good. Best of luck. Not financial advice

Intel ($INTC) Gets $20 Billion in US GrantsIn a landmark move aimed at revitalizing the domestic semiconductor sector, the Biden administration has announced a staggering $20 billion investment package for Intel Corporation ( NASDAQ:INTC ). The funds, comprising $8.5 billion in grants and up to $11 billion in loans, represent the largest award under a program designed to bolster the American chip industry.
The substantial investment is set to fuel Intel's ambitious expansion plans, with the company pledging more than $100 billion in US investments. This includes initiatives to ramp up production of cutting-edge semiconductors at sprawling facilities in Arizona and Ohio, as well as supporting research and development endeavors and advanced packaging projects at smaller sites in Oregon and New Mexico.
President Joe Biden himself is slated to visit an Intel campus in Phoenix to announce the preliminary agreement, highlighting the significance of the deal. Intel's selection as the recipient of the first Chips Act funding deal for advanced chipmaking facilities underscores the company's pivotal role in the administration's efforts to reinvigorate the nation's chip manufacturing capabilities.
The announcement has already triggered a positive market response, with Intel shares surging by 3.5% in premarket trading. The news comes at a crucial juncture for Intel, which has been engaged in an ambitious turnaround bid under CEO Pat Gelsinger's leadership.
Gelsinger's strategic vision includes not only expanding Intel's foundry business but also reclaiming the company's technological prowess, which had lagged behind Asian competitors in recent years. Securing high-profile partnerships, such as with Microsoft Corp., further solidifies Intel's position as a key player in the global semiconductor landscape.
The significance of the government's investment in Intel extends beyond mere financial support. It represents a concerted effort to reverse decades of offshoring semiconductor production and to bolster America's competitiveness in an increasingly vital industry.
While the funding is a significant step forward, Gelsinger acknowledges that more may be needed to fully address the challenges facing the US chip industry. He suggests that additional initiatives, akin to a hypothetical "Chips II," may be necessary to sustainably restore America's chip manufacturing capabilities.
The agreement between Intel and the government underscores a shared commitment to revitalizing the semiconductor sector, with the potential to create tens of thousands of jobs across multiple states. Beyond commercial production, Intel is also set to receive funding for the manufacturing of military and intelligence chips, further highlighting the strategic importance of the initiative.
As Intel embarks on this transformative journey, eyes are on the company to deliver on its promises and drive innovation in the semiconductor space. With the backing of substantial government support, Intel is poised to play a pivotal role in reshaping the future of American chip manufacturing and securing its position as a global leader in the industry.
Immediate buy on INTC!Sound on!
Thank you as always for watching my video. Please feel free to like, share, and comment on this video.
