JD pinbar bounce on the 1 day chartYou can see that the last two days we had the pinbar searching for a bottom, and this morning it is showing that it has bounced and is back on the rise....should be a strong day(although Fridays can be volatile so be sure to have a plan and be watching.) Should show strength into next week as well. I personally won't be holding over the weekend due to the current state of the world, but you make your personal decision. Good luck and have fun traders!
JDCO34 trade ideas

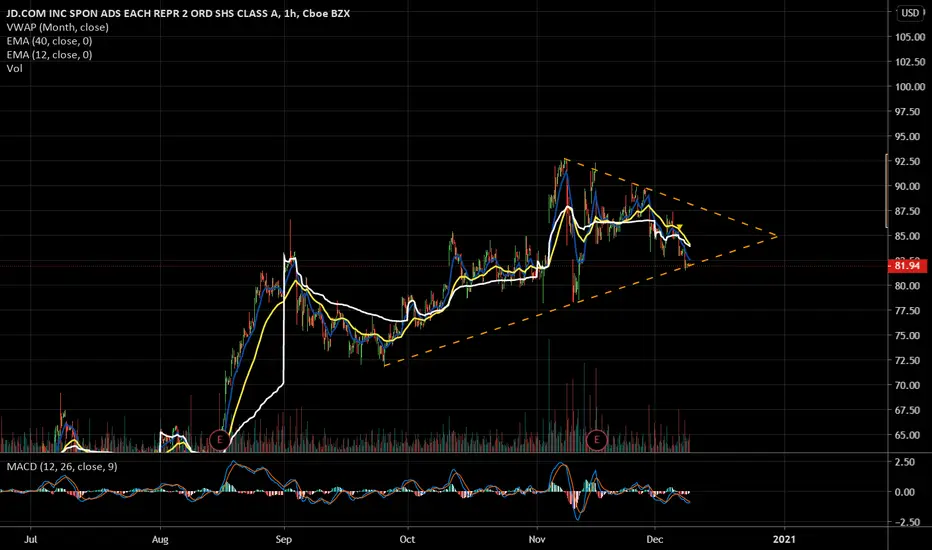
JD could make limited pushdown towards our pivot level! JD could make limited pushdown towards our pivot level, where the 61.8% fib retracement is. MACD is also showing that this bullish trend could enter a period of consolidation.

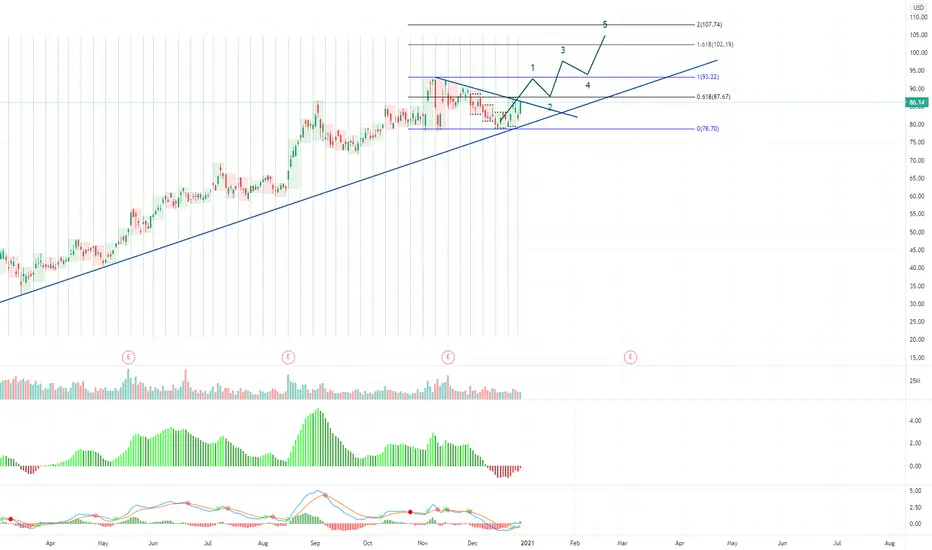
jd has limited short term potential to go up1. Daily chart shows potential to run out of energy and will have a retracement any time soon.
2. The risk to go short is that price consistantly holds at 50ema. It will have a retracement from 87.90 to 83 (50 ema).
3. Once 50ema is broken, it will go to 70 which may hold around 200ema.
4. 15 mins chart looks different. It has potential to go new high which is 92.88 if the down pressure line is broken.
It gives a quick long if it retests down pressure line and entry around 90. Target should be 105 if enter this high.
5. Will trump's ban on couple chinese companies have impact JD next week? We have to watch.
Overall JD only offers very limited potential and higher risk of going downside. 70 will be a long term buy price given
china index goes very bullish recently.

$JD | Bull Channel Breakout and Bull Flag$JD formed a bull flag after breaking out of a bullish descending channel.
Look for longs


JD 15-12-2020 LongAsset and Time frame -JD,1H
Entry Price -80.3884
Exit(Stop Loss) -84.77
Exit(Take Profit) -78.91
Technical Analysis -On the daily chart price is making a correction, and on the hourly chart price stopped at the support line and on the parallel channel trend line, if you want a better entry, wait for a second confirmation(another bullish candle) on the hourly chart
I would like to hear your opinions and what can I do to improve, many thanks

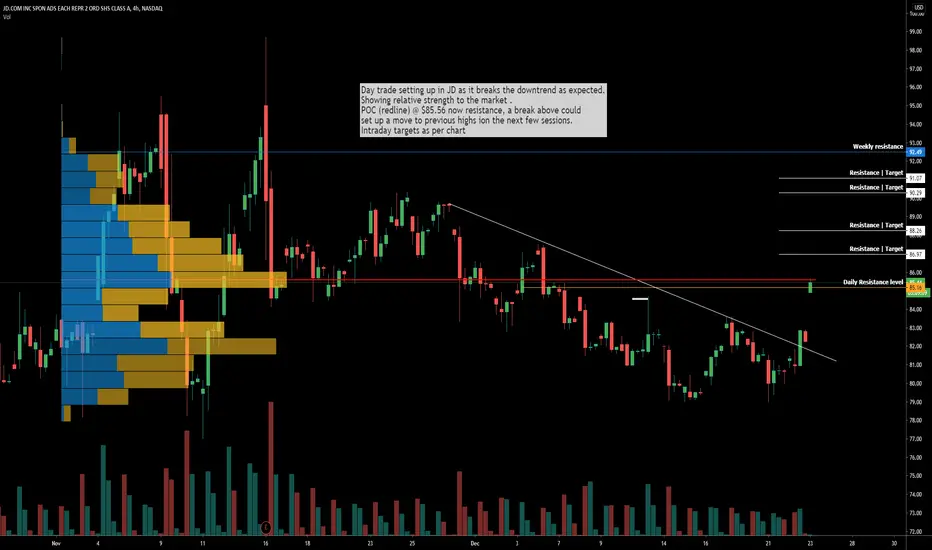
$JD .COM Day trade Targets
Day trade setting up in JD as it breaks the downtrend as expected.
Showing relative strength to the market .
POC (redline) @ $85.56 now resistance, a break above could
set up a move to previous highs ion the next few sessions.
Intraday targets as per chart
Have some $JDwatching this one for an up day tomorrow. Only concern is price is on 10 and 50 day EMA's which may block price. If it goes up should have a nice run.
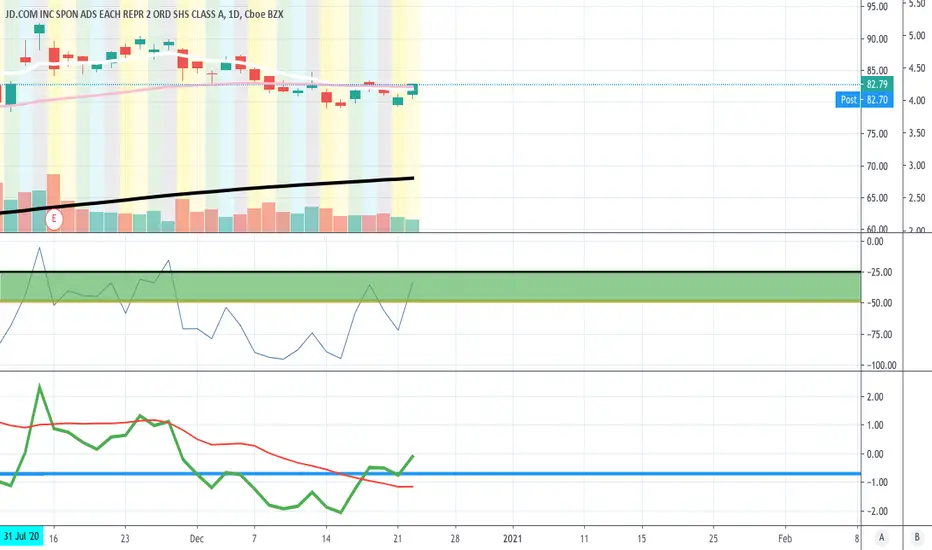
JD.com is on momentary downtrendEven with the awesome spinoff of JD Health and JD logistics unit in talks of IPO, JD.Com remains to be starting on a momentary downtrend to EMA 200 for a break.
78-79 was a good support and that's why the retracement back to EMA 50 as a ceiling before breaking that level and down to EMA 200.
I am out of ammo with my shorts on $SPCE last Friday so I am not entering now and hopefully will be able to enter once it retests static support turned resistance level.
Disclaimer: Do your own diligence. Not an advise to buy or sell. You can lose more than you have and I am just sharing for entertainment.

JD broke out of the cup and handle patternNASDAQ:JD broke out of the cup and handle pattern with a bullish gap up, and is now targeting 88.9$, any pullback towards the neckline at around 85$ is a buying opportunity. Place stops at 77.5$.
Hit the like button please if you find this useful :)
This is only my own view and not a financial advice, do your own analysis before buying or selling
Happy Trading!

$JD JD.com Weekly Chart looks A Buy.
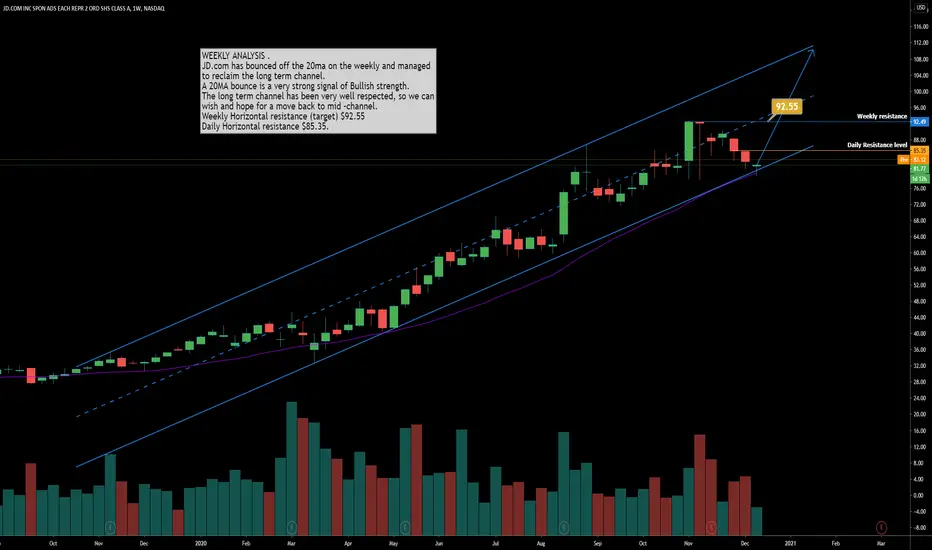
WEEKLY ANALYSIS .
JD.com has bounced off the 20ma on the weekly and managed
to reclaim the long term channel.
A 20MA bounce is a very strong signal of Bullish strength.
The long term channel has been very well respected, so we can
wish and hope for a move back to mid -channel.
Weekly Horizontal resistance (target) $92.55
Daily Horizontal resistance $85.35.


JD - December 12, 2020JD is the a leading ecommerce and retailer for the people's republic of China. It sold off and came down very nicely into the buy zone here last week due to the implemented regulations for Chinese companies to increase transparency or have the threat of being de-listed. Has been on watch over the past 2 months already with a successful trade closed out. Took a textbook push off the 786 fib retracement and 200 day EMA level. Great swing and RR opportunity here, expecting this to retest and break all time highs in the next month or so.
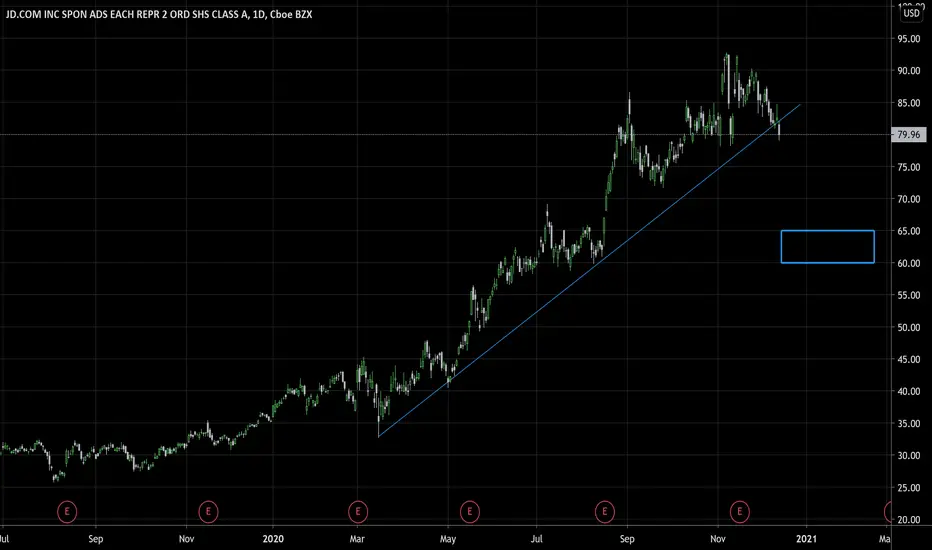
this has potentialcould be a dip buy here. but use a very tight stop! if it breaks this tight channel it will test red SMA line below. so if you get stopped out target 60-65 for a entry :) i love the chart! gl to longs! <3


JD.com LongThe algos will soon realize that the analyst sell recommendation was to sell the JD Health that began trading in HK exchange overnight and not JD.com smh. This will be $85 in no time at all in my opinion.
Not trading advice, just my opinion.
JD