KSS Trading Guide 4/21/25Kohl's Corporation (KSS) Trading Analysis for Monday, April 21, 2025
Sentiment Analysis
----Overview: Sentiment on platforms like X and StockTwits leans bearish, driven by tariff concerns and Kohl’s weakening fundamentals, with projected sales declines of 5-7% in 2025. JP Morgan’s Underweight rating and $7 price target as of April 14 underscore margin pressures, though a ~12% dividend yield provides some appeal for income-focused investors.
----Implication: The prevailing negative sentiment, coupled with macroeconomic headwinds, is likely to exert downward pressure on KSS, overshadowing the dividend’s stabilizing effect.
Strategic Outlook
----Assessment: The outlook for Monday is bearish, fueled by significant put activity in weekly options, persistently oversold technical indicators without reversal signals, and a VIX at ~40, reflecting heightened market volatility.
----Implication: Anticipate a price range of $6.20 to $6.50, with a risk of breaching support at $6.20, potentially driving the stock toward $5.80 if bearish momentum persists.
Market Influences
----Overview: No new Federal Reserve decisions today; however, recent guidance on April 17 signals a cautious approach to rates, which could dampen retail spending. Kohl’s next earnings are scheduled for May 21, per TradingView data. Fitch Ratings downgraded KSS from BB to BB- on April 7, citing financial strain. Social media discussions on X, WallStreetBets, and StockTwits remain bearish, focusing on the impact of 10% baseline tariffs on margins. Additionally, the departure of Chief Technology Officer Siobhán Mc Feeney on April 1 introduces further uncertainty.
----Implication: The absence of positive catalysts, combined with tariff pressures and leadership changes, solidifies a bearish outlook for Monday.
Price Context
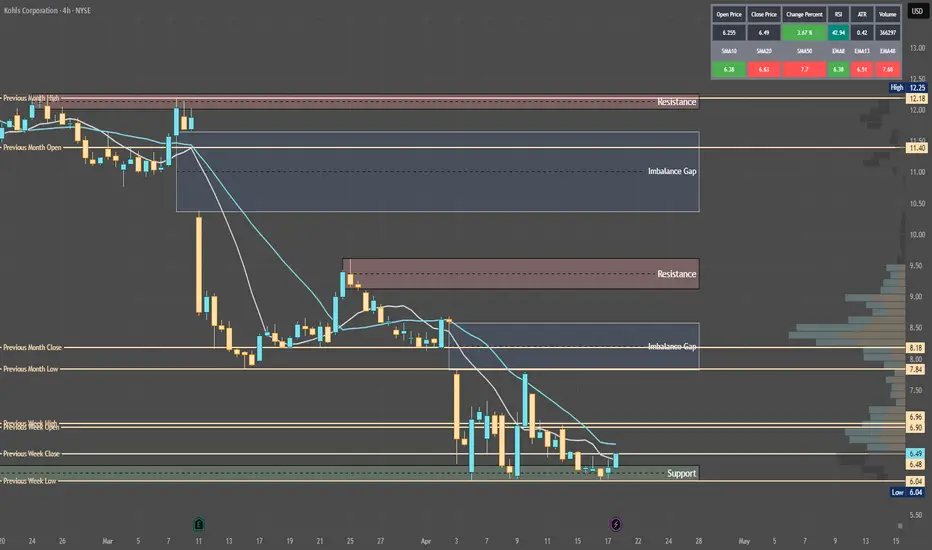
----Overview: Current price at $6.48. The stock has declined 21% over the past month from $8.20 on March 31 and is down 73% year-over-year from $23.94 in April 2024. Support lies at $6.20 (recent low on April 17), with resistance at $6.89 (April 14 open).
----Implication: Recent declines, driven by tariffs and executive turnover, suggest continued downward pressure, with a break below $6.20 likely to accelerate losses.
Technical Indicators
Monthly: RSI at 22 (oversold), Stochastic at ~12 (oversold), MFI at ~18 (oversold). Price below 10/20-month SMAs ($8.50/~$9.50, bearish).
Implication: Long-term bearish trend with extreme oversold conditions, yet no reversal signal is evident.
Weekly: RSI at 27 (oversold), Stochastic at ~17 (oversold), MFI at ~20 (oversold). Price below 10/20-day SMAs ($6.70/~$6.90, bearish).
Implication: Bearish trend confirms downside bias for weekly contracts.
Daily: RSI at 30 (nearing oversold), Stochastic at ~15 (oversold), MFI at ~22 (oversold). Price below 10/20-day SMAs ($6.40/~$6.50, bearish).
Implication: Daily trend supports weekly bearish bias.
4-Hour: RSI at 35 (nearing oversold), Stochastic at ~18 (oversold), MFI at ~28 (nearing oversold). Price below 10/20-period SMAs ($6.30/~$6.40, bearish).
Implication: Medium-term bias aligns with weekly outlook.
Hourly: RSI at 32 (nearing oversold), Stochastic at ~15 (oversold), MFI at ~25 (oversold). Price below 10/20-hour SMAs ($6.35/~$6.40, bearish).
Implication: Intraday bias supports weekly trade direction.
10-Minute: RSI at 38 (neutral), Stochastic at ~20 (oversold), MFI at ~30 (nearing oversold). Price below 10/20-period SMAs ($6.45/~$6.47, bearish).
Implication: Short-term bias reinforces weekly contract setup.
Options Positioning
Overview: Weekly options show high put volume at $6.50 (1,500 contracts, 70% at bid), with a put-call ratio of 2.5 (bearish) and IV skew favoring puts ($6.50: 50%, rising). Monthly options have a put-call ratio of 2.0, with put IV rising ($6.00: 48%). 3-Month options show a put-call ratio of 2.3, with put IV rising ($5.50: 45%). VIX at ~40 (down 5%, above 30-day average of ~35).
Option Flow Dynamics (OFD) Analysis:
Vanna:
Impact: -$0.10 intraday.
Insight: Rising put IV at 50% compels dealers to sell shares to hedge delta as IV increases, exerting downward pressure. A VIX of 40 heightens this effect.
Stance: Bearish for weekly contracts; neutral if IV falls below 48%.
Charm:
Impact: Pins price ±$0.05, adds $0.03 volatility.
Insight: High put open interest at $6.50 prompts dealers to sell shares to maintain delta neutrality near expiry, pinning the price with minor volatility.
Stance: Bearish for weekly contracts; neutral if price holds $6.50.
GEX (Gamma Exposure):
Impact: Pins price ±$0.10, adds $0.05 volatility.
Insight: Negative gamma from elevated put open interest drives dealers to sell shares on price declines, pinning at $6.50 while adding volatility on breakouts.
Stance: Bearish below $6.50 for weekly contracts; neutral at $6.50.
DEX (Delta Exposure):
Impact: $0.20-$0.30/day downward pressure.
Insight: High put open interest creates a delta imbalance, compelling dealers to sell shares on price drops, adding consistent downward pressure.
Stance: Bearish for weekly contracts, particularly on high volume.
OFD Summary: Weekly flows signal a bearish bias, with $0.30-$0.50 downward pressure driven by Vanna and DEX selling. Pivot at $6.50; weekly range $6.20-$6.50 (pinning). A VIX of 40 amplifies downside risk, and a break below $6.20 could trigger $0.15 volatility (GEX). Monthly and 3-month expiries, with put-call ratios of 2.0 and 2.3, provide bearish confluence.
Implication: Bearish bias for weekly contracts; elevated VIX suggests downside volatility, with a $6.20-$6.50 range for Monday.
ICT/SMT Analysis
Overview: Weekly: Bearish, support at $6.20, resistance at $6.89, SMT divergence versus WMT confirms weakness. Daily: Bearish, FVG $6.50-$6.89, OB $5.80. 4-Hour: Bearish, MSS below $6.48, liquidity below $6.20. 1-Hour: Bearish, MSS below $6.48, liquidity below $6.20. 10-Minute: OTE sell zone $6.50-$6.60 (Fib 70.5%), target $6.20.
Implication: Bearish across all timeframes; a breakdown below $6.20 is likely, aligning with the weekly contract setup.
Edge Insights
Dark Pool Activity: Large sell orders at $6.50 in recent dark pool prints (April 18) indicate institutional bearishness, potentially increasing selling pressure if retail traders follow suit on Monday.
Sector Dynamics: The consumer discretionary sector is down 17.8% year-to-date (Morningstar); Kohl’s heavy reliance on imported goods amid tariffs makes it more vulnerable than peers like Walmart, which benefits from stronger domestic sourcing.
Short Interest Pressure: Short interest at ~45% of float (MarketBeat) raises the risk of a short squeeze if the price breaks above $6.89, though current momentum favors shorts targeting $6.20.
Implication: Institutional selling and sector weakness reinforce the bearish bias for weekly puts; remain vigilant for a potential squeeze if the price approaches $6.89.
Trade Recommendation
Analysis:
Bearish: 55% likelihood (negative MSS, OFD flows, tariff pressures).
Neutral: 30% likelihood (GEX pinning at $6.50, high VIX choppiness).
Bullish: 15% likelihood (oversold indicators, potential bounce above $6.89).
Action: Recommend a bearish weekly trade below $6.20, targeting $5.80. Purchase $6.50 puts (weekly expiry) at ~$0.25, aiming for $0.50, with a stop at $0.15 if KSS breaks $6.60. Risk $50 (2.5% of a $2,000 account).
Conclusion for Monday: Kohl’s faces a bearish trajectory driven by tariff pressures, negative options flows, and leadership uncertainty. The recommended strategy focuses on a breakdown below $6.20 for weekly bearish trades, targeting $5.80. Elevated VIX and institutional selling add risk—execute with tight stops to manage volatility.
K1SS34 trade ideas
Kohl's and the potential for being the next Squeeze game!A short squeeze happens when a heavily shorted stock’s price rises sharply, forcing short sellers to buy back shares to cover their positions, which drives the price even higher. Key ingredients include high short interest, a low float, and a catalyst (like strong earnings, news, or retail investor frenzy). Let’s look at Kohl’s through this lens:
Short Interest: As of early April 2025, Kohl’s had a short interest of about 49 million shares, or roughly 61.44% of its float, which is high compared to its peers (average peer short interest is around 8.4%). High short interest is a prerequisite for a squeeze, as it means there’s a lot of potential buying pressure if shorts need to cover. However, this alone isn’t enough—GameStop’s 2021 squeeze had short interest over 100% at its peak, so Kohl’s is notable but not extreme.
Float and Liquidity: Kohl’s float (shares available for trading) is decently sized, which can dilute the impact of a squeeze compared to a small-cap stock with a tiny float. A larger float means it takes more buying volume to move the price significantly, making a squeeze harder to sustain unless there’s massive coordinated interest.
Recent Price Action: Kohl’s stock jumped 8% to $7.17 on April 7, 2025, with above-average volume, driven by optimism around inventory and expense management. But it’s also been volatile, with a 31% drop after cautious 2025 guidance and a 75% dividend cut earlier in March. The low price ($7-ish) makes it accessible to retail traders, who often fuel meme-driven squeezes, but it also reflects weak fundamentals, which can deter sustained buying.
Catalysts: There’s no clear catalyst right now. Kohl’s is closing 27 stores by April 2025, signaling struggles in brick-and-mortar retail. Analyst sentiment is mixed—Bank of America sees challenges in rebuilding sales, and
Market Context: Recent market volatility, driven by tariff fears and a 10%+ S&P 500 drop, has boosted short sellers’ profits broadly ($159 billion in six days). This suggests shorts are confident, and Kohl’s, with its retail exposure, could stay under pressure unless something disrupts the bearish narrative. A short-covering rally could happen if broader market sentiment shifts, but Kohl’s fundamentals (declining sales, earnings revisions down 94%) don’t scream “bullish.”
Counterpoints: Kohl’s short interest has actually fallen 9.98% recently, suggesting some shorts are already covering, which could reduce squeeze potential. Also, department stores like Macy’s and JCPenney are struggling too, so Kohl’s isn’t uniquely positioned for a breakout. Retail investor coordination (like on Reddit or X) would need to ramp up significantly, and there’s no evidence of that scale yet.
Conclusion: Kohl’s has some ingredients for a short squeeze—high short interest and a low stock price—but it lacks a strong catalyst and the kind of retail frenzy needed to ignite one. Its fundamentals are shaky, and recent news (store closures, dividend cuts) leans bearish. It’s a stock to watch if you’re into high-risk plays, but it’s not screaming “next GameStop” right now. Always dig into the numbers and consider the broader market—things can shift quickly.

An absurdly undervalued buy at the perfect time ($KSS)Financial Condition of Kohl's
Kohl's has been sold heavily in recent weeks as its revenues have declined post Covid-19 and wall-street has repeated the motif that brick and mortar shops are dying. However, it has become so oversold now that it is a worthy investment for consideration, now that it is near its 20 year lows set during the covid pandemic.
Valuation and Ratios
It is a fact that the Kohl's current market capitalization is absurdly low for how large the company is. Kohl's is trading with a P/E ratio of just 6.96 and a market capitalization of 1.69 Billion despite having over 3.8 Billion in shareholders equity. The company's real estate alone was recently valued at over 8 billion. In addition, KSS received buyout offers at $64 a share just two years ago, which management rejected for being "Too Low" (it is now trading at $15.43 a share).
The Opportunity
While most would say it is never a good idea to try to catch a falling knife, for such a large corporation to be priced so cheaply presents a unique opportunity for value investors, and now is the perfect time to buy in for two main reasons which could act as catalysts.
1. The Christmas Effect (KSS goes up an average of 25% every December to April period) and
2. Recent Change in leadership (new CEO Ashley Buchanan is stepping in on January 15th).
This company can turn itself around so easily, and the market will reward it greatly for any such turn-around. We have recently seen many similar stories with dying brick-and-mortar companies like Gamestop and Abercrombie and Fitch being revitalized by new management, and Kohl's in particular has so much capital that it could easily change its trajectory. In addition, as Ashley Buchanan is becoming CEO after guiding a buyout of his previous company, Michaels, there are rumors that Ashley Buchanan may organize another buyout or merger for Kohl's with Apollo Global Management, which of course would come at a great premium to the current price.

Kohl's Corporation: The next short squeeze?Overview
Kohl's Corporation, a U.S.-based retail giant operating in 49 states, has seen stagnant performance in recent years. Like traditional department store chains, Kohl's has struggled to grow revenue, facing competition from online retailers and shifting consumer preferences. Despite this, the company maintains significant cash flow and profit margins, offering an opportunity for activist investors to unlock value through operational improvements, asset monetization, and strategic financial maneuvers.
Investment Thesis
Kohl’s is currently undervalued due to the following factors:
High Dividend Yield: Kohl’s offers a dividend yield of approximately 11%, which is fully covered by its free cash flow. This high yield has led to high costs for short-sellers, who must cover both the dividend payments and the borrowing fees, thereby increasing short interest risk and making a short squeeze more likely.
Short Interest and Potential for Short Squeeze: Approximately 35% of Kohl’s free float is sold short, which is unusually high. As seen in past short squeezes in the market, such high short interest can catalyze upward price pressure, especially if the company demonstrates any positive financial or operational developments.
Asset-Heavy Balance Sheet: Kohl’s owns two-thirds of its retail locations and real estate. The market value of these properties is estimated to be at least four times the current stock market valuation, representing significant latent value. Monetizing these assets, whether through sales or leveraging for additional liquidity, could create substantial shareholder value and provide capital for operational improvements or share buybacks.
Activist Investor Involvement: Recent activism has brought in investor demands for more aggressive management strategies to enhance shareholder value, including buybacks and property monetization.
Key Points for Value Creation
Asset Monetization: Kohl’s real estate portfolio is an undervalued asset on the balance sheet, with depreciated values far below market worth. A partial sale of properties could allow Kohl’s to raise substantial funds, enhancing financial flexibility while potentially retiring a portion of its debt or funding share buybacks.
Dividend Stability and Potential Buybacks: While the high dividend yield supports Kohl’s appeal, the company could further boost its stock price by initiating a robust share buyback program. This strategy could create pressure on short-sellers by reducing available shares, thereby increasing the likelihood of a short squeeze.
Management Realignment: A new CEO, appointed two years ago, has already started strengthening the balance sheet by paying down debt. Activists have proposed further buybacks and asset monetization, which could unlock shareholder value and signal stability to investors. A tender offer, in which the company buys back shares at a premium to the market price, could accelerate short-seller pressure, potentially leading to a positive feedback loop that raises the stock price.
Catalysts and Downside Risks: Kohl’s rejected a takeover offer in 2022 in the $50-$60 per share range, suggesting that the stock may be significantly undervalued at current levels (around $17-18). Given the substantial short interest and Kohl’s stable financial position, an acquisition proposal could re-emerge, or an activist’s push for operational changes could provide substantial upside. However, if the dividend is cut or operational numbers weaken, the stock could see additional short-term pressure. A temporary dip could offer buying opportunities for those with a longer investment horizon.
Financial Position
Debt Structure: Kohl’s debt is manageable, with limited near-term maturities. Lease obligations make up a portion of the debt load, while bank debt due next year has been partially paid down. The remaining obligations are spread out until 2029, reducing financial risk from an overburdened debt schedule.
Cash Flow and Dividend Coverage: Despite recent operational stagnation, Kohl’s free cash flow (about $600 million in 2022) is more than sufficient to cover dividend payouts and proposed buybacks. Even under a pessimistic scenario, where free cash flow falls by a third, the dividend could still be sustained, albeit with limited room for additional capital expenditure or shareholder distributions.
Risks and Considerations
Operational Decline: While the company has stable cash flow, revenue has been declining. A continued drop in sales, especially in a weaker economy, could strain cash flow and increase the likelihood of a dividend cut, which would likely lead to further share price declines.
Dividend Cut Potential: A dividend cut would likely affect investor sentiment, especially given Kohl’s high current yield. While activists see the dividend as a valuable tool to pressure short-sellers, any reduction could deter income-focused investors.
Short-Seller Resistance: With a high cost of shorting and substantial short interest, short-sellers may attempt to push the stock down further. However, significant real estate assets, coupled with activist interest, add a foundation of underlying value that could stabilize the stock.
Price Target and Outlook
Based on the above considerations, activists see a potential upside of 50-100% within the next 6-12 months, contingent on successful execution of asset sales or buybacks. The stock could rise from its current level of around $17-18 to a fair value range of $30-40 per share based on real estate valuation and improved sentiment.
Short-Term Price Target: $25-$30, assuming stabilization and initial buyback steps
Long-Term Potential: $40-$50, assuming asset monetization and strategic buybacks are fully implemented
Conclusion
Kohl’s represents a high-risk, high-reward investment, suitable for investors comfortable with volatility and potential short-term declines. With significant short interest, valuable real estate, and a history of activist involvement, Kohl’s has multiple potential catalysts to unlock shareholder value. Investors should be prepared for potential interim dips if the dividend is cut or economic conditions worsen, but long-term prospects are strong for those who view this as an opportunity to capitalize on an undervalued asset-heavy retailer.
This information is for informational purposes only and does not constitute financial or investment advice. Always do your own research or consult a financial professional before making investment decisions.


2.5:1 reward potential for Gap fill in KSSKss is holding above AVWAP from earnings with a slope up meaning more volume acculating higher. Gaps almost always fill looking back so looking for filling gap and getting out.

What I mean when I say "Activate an algorithm" - Quick TutorialThis should be helpful for anyone looking to understand further what I define as an activation of an algorithm.
This candle on the hourly is a beautiful example after my video this market where I said we want to see yellow "activated". It is basically proof that price is now respecting and following that algorithm/channel and this is so important to understand for my analysis and trading style.
Always here to answer further questions for those who are interested in learning more!
Happy Trading :)

KSS - Analysis and why this could be the start of a major moveA pickup by our stronger buying continuation yellow would be very bullish. We do not want to see ourselves being guided by this very tapered green buying continuation.
Stay Tuned!
Happy Trading :)
- TraderDaddyOG

KSS Kohl's Corporation Options Ahead of EarningsAnalyzing the options chain and the chart patterns of KSS Kohl's Corporation prior to the earnings report this week,
I would consider purchasing the 27.50usd strike price Calls with
an expiration date of 2024-10-18,
for a premium of approximately $3.90.
If these options prove to be profitable prior to the earnings release, I would sell at least half of them.

Holding the lineBulls are taking control on the price. I think we will see a massive break out in a few weeks. My SL is under the lowest of the current weekly candle an it triggers only if a red weekly candle breaks down the trendline. BTW the CSP on this instruments pay well. I just sold a lot of them exp 03/22 strike 26.5. You can just buy the stock too.

KSS - Update to my breakout video - We are already seeing it!Update here to my previous KSS video titled "KSS - Primed for a breakout!" Go and watch that if you haven't to understand why i've been preparing for this.
This is all happening prior to earnings release in a few weeks and with a ton of buying volume coming in, I am very happy to see it!
My projection is a retest of our daily tapered purple channel (which has been resistance for a long time now) and, utilizing all the liquidity that's been built up, breaking out with strong earnings.
Obviously fundamentals and bad earnings can cause any TA to be void - but TA wise, this is one of my most confident positions.
Look forward to seeing you all on my livestream at market open today!
Happy Trading :)

KSS - Primed for a breakout! As always, excuse the mess of the charts. Each line means a lot to my trading on different time frames and I do my best to consolidate which ones show on what timeframes so that it's easier for you to see clearly what's important.
That being said, I believe KSS (Kohl's) is primed for a breakout technically and fundamentally when they announce earnings in a few weeks.
Definitely don't take my word for it - do your own research and analysis before entering any positions.
Hope this was helpful and have a great weekend!
Happy Trading :)

KSS: Growth Prospects Amid High Short InterestKohl's Corporation (NYSE:KSS) , a well-known American department store chain, draws investors' attention not only with its adaptation to current market conditions but also with a significant volume of short sales (short interest), which could serve as a catalyst for a sharp increase in stock price in the short term.
Kohl's is actively working on improving its operational efficiency and adapting to changing consumer preferences through investments in online platforms and updating its product assortment. These strategic steps are aimed at strengthening the company's positions in the long term.
However, in the short term, the high level of short sales on KSS stocks is of particular interest. This indicates that a significant portion of investors are betting on the stock price falling. In situations where market conditions or corporate news turn out to be better than expected, this can lead to a sharp increase in stock price due to covering of short positions (short squeeze), when sellers are forced to buy back shares to close their positions, further enhancing the price increase.
Such a scenario can offer a unique opportunity for risk-ready investors, as even minor positive changes in financial indicators or company news can cause a significant increase in stock value. At the same time, investors need to consider the potential risks associated with high levels of short sales and thoroughly analyze the company's fundamental indicators.
Kohl's continues to demonstrate resilience in challenging market conditions, and with a strategy to improve its market position, the company's shares may offer interesting opportunities for various categories of investors. This is especially true for those looking for speculative investment opportunities in anticipation of a potential short squeeze.


KSS BUYTrade 12-01-2023
Kohl’s call volume above normal and directionally bullish. There was an opportunity to entry earlier but it’s ok because this is a SWING trade.
BUY $24.24 SELL 26.99 ASK 2.75

KSS BUY $ 24.18 KSS
Buy $24.18
Sell $26.99
Swing trade
Bullish
Usually we look for day trades this one might take a little longer to get to TP.
Based on the price action, it’s favorable.

KSS short to $18 (intuition stock)There are times I get a download immediately of a stock if I even begin to think, "maybe I should ask intuition for a ticker," and one pops in. This morning, KSS came in immediately. I asked for a number and got 18. I'm starting to believe in these ideas more and more because they actually have kicked ass.
(See the WOLF idea for a prior example. I've had many others not posted, but they don't occur as often as I'd like, of course!)
Anyway, I checked with dowsing and get the number 17 as well. The primary idea is it's a daily trend down - which I see it already is. I tried specifically to get the exact low and get $18.12.
There is likely first a move up (news related?) to around $24.84 (zone) and I'd like to see it reverse there.
I'm not real good yet at getting exactly the number of days for specific highs/lows, but I'm working on it. So this is saying the trade will last 3 weeks. We'll see!

Weirdness in KSS tgt $38! Then short it big.This stock has something up with it. Super strong despite weakness in indexes. It came originally as an intuition stock a number of weeks ago and hit my level & bounced well.
I think my attention was draw to it because it's having a crazy move up, which the daily is demonstrating now.
However, it might get crazier because I have information from my dowsing saying it's going to around $38-39 over the next 3-4 weeks.
Earnings aren't until Nov. 21 (a.m.)
It may be some kind of manipulation or something. I'm thinking of what happened to BBBY. The most important things to know per my dowsing is that there is a bull trap and a breakdown coming of the daily chart.
I was getting a bunch of different dates for Nov. and not real consistent, but out 3-4 weeks.
We'll see how this plays out as it's got fairly unusual vibe.

Kohl's KSS PutBuy Nov-10-23 $22 Strike Puts @ 0.64 Limit to Open
Bounced hard off the $18 zone as retracement. Right now at important resistance with the possibility of dropping from here on out under a bear trend.

KSS 9/2/2023KSS
Shedding weight
Companies continue to shed away all those fake Covid bucks that were pumped into the system. If a company hasn’t done so yet, then they probably will start soon.
KSS bottomed out April ’20 and the fake covid bucks sent it into an Accumulation stage.
Nov.’20 price breaks out and enters uptrend that tops out May ’21. Golden cross provide some confirmation of trend.
The trend was lost and price stops moving up and starts moving sideways. Price enters a Distribution stage and “M” top pattern is formed.
May’22 price breaks down from distribution stage, confirming ‘M’ top pattern and start of downtrend. Death cross seen provides some confirmation of trend.
Price has since entered a Downtrend channel. It currently finds itself at resistance area of Downtrend channel.
The price movement on this chart have allowed me to identify the following:
1) Price is in a downtrend
2) Price is in a bearish pattern
3) It is at resistance & support area of current pattern
Why are these things important? It allows me to identify high probability trade.
I want to trade with the trend. I also want to find trading patterns that coincide with the trend and areas that will provide entries that give me the best risk/reward value.
Price is in a downtrend, so I will look for short entry.
It is in a downtrend channel, here I’ve identified that bearish pattern.
It is at the upper trendline of the channel. This resistance area is where I want to enter to that will give me the best risk/reward value.
Entering trade short-
Entry: 26.43
Stoploss: 18.22(-16.19%)
Target: 30.71(+31.06%), 1.92 R/R ration

Stocks pairs trading: KSS vs MPairs trading is a market-neutral trading strategy that aims to capitalize on the relationship between two highly correlated stocks. When using this strategy, we would typically go long on the stock we expect to perform better and short the one we expect to perform worse, with the aim that the spread between the two will converge or diverge based on historical norms.
Stock "KSS"
P/E and Forward P/E: Not available and 8.16 respectively, indicating some expectation of future earnings.
EPS: -1.06 (ttm), which suggests the company is not currently profitable.
Market Cap: $2.93 Billion
ROA/ROE: Negative
Short Interest: High at 18.07%, indicating that a significant portion of investors are betting against it.
Performance: Negative across multiple periods but positive for the quarter.
RSI: 40.42, indicating neither overbought nor oversold.
Stock "M"
P/E and Forward P/E: Very low at 4.69 and 4.29, which could imply undervaluation or higher risk.
EPS: Positive at 2.59 (ttm), the company is profitable.
Market Cap: $3.39 Billion
ROA/ROE: Positive and relatively high.
Short Interest: Lower than "KSS" at 8.59%.
Performance: Negative across multiple periods.
RSI: Extremely oversold at 16.86, which sometimes indicates a pending reversal.
Strategy
Go Long on 2*"M": The stock has a low P/E ratio, positive earnings, and high ROA/ROE. Its extreme oversold status according to RSI could indicate a potential for upside.
Go Short on 1*"KSS": The stock has negative earnings, and a high short interest ratio. ROA and ROE are both negative, which suggests poor financial performance. The stock also has a high volatility (Beta = 1.80) which could work to our advantage when shorting.

KSS - Resistance breakClose over $25 puts this above resistance with potential for a good run as high as $35. Relative strength present but volume a bit lacking. Long as we stay over $25 I'm interested swinging this but really would like to see volume pump in.

ShortSmall trade i will be post an upgrade later. You can see the entry point stop loss and take profit
