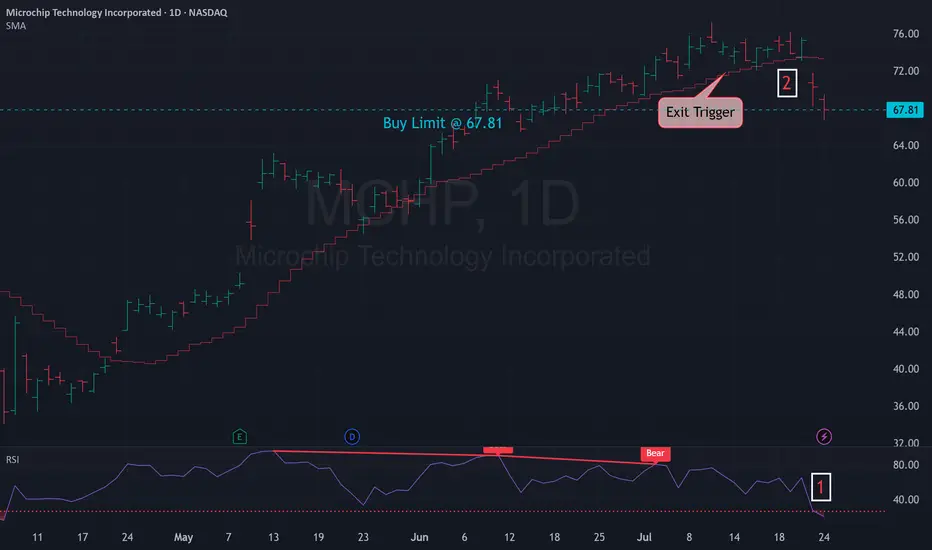
Mean Reversion Trade: MCHP1. RSI in oversold region
2. Price likely to rebound back the the mean
Trade Rules:
Entry Trigger - RSI has cross below oversold region, enter limit buy at close price
Exit Trigger - Close at market when close price cross above exit trigger (Red step line)
M1CH34 trade ideas
MCHP watch $59.xx: Proven Resistance break could POP stronglyMCHP trying to recover along with the Chip sector.
Now testing a well proven resistance $59.10-59.62
Looking for a Break-and-Retest of zone to enter long.

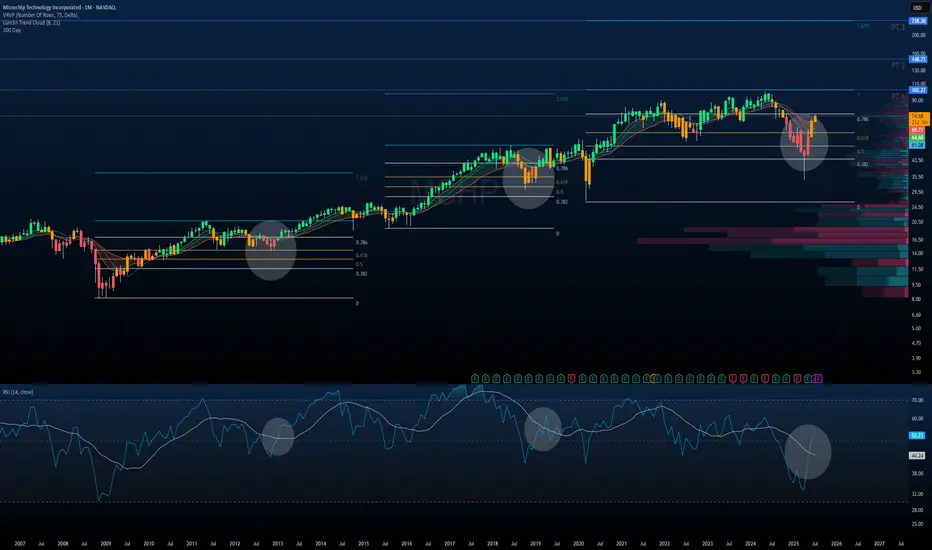
$MCHP | Microchip Technology — Monthly Macro PlaybookNASDAQ:MCHP | Microchip Technology — Monthly Macro Playbook
This chart illustrates the multi-decade rhythm of NASDAQ:MCHP , highlighting how past cycles and technical structure provide clarity on the current setup.
Historical Market Cycles & RSI Trends
Each gray circle marks a key market structure low with:
A bounce from macro Fibonacci retracement zones
A bullish RSI crossover through its signal line (white MA)
A recovery from oversold or mid-40 RSI levels, signaling trend reversal
We’ve now entered the fourth identical cycle dating back to 2009.
Current Technical Structure
Price just bounced off the 0.618–0.786 retracement zone from the 2020–2021 cycle.
Strong reversal candle printing off volume support, reclaiming major EMAs.
RSI is breaking through its signal line, just as it did in 2012, 2016, and 2019 — each of which led to multi-year rallies.
Fibonacci-Based Price Targets
Using prior extensions from similar fractals:
PT1: $102.77 — 1.0 extension of the last impulse
PT2: $148.71
PT3: $238.30
These are not short-term targets, but structural projections if this macro cycle repeats.
Macro Thesis
When price + momentum + Fib structure + RSI rhythm align like this, it usually sets the stage for multi-year compounding upside.
This chart doesn’t predict the future.
It just reminds us the past leaves footprints.
And NASDAQ:MCHP ’s footprint says: “This is where cycles begin.”
MCHP Possible Correction? Is MCHP Correcting ?
Well based on hitting a four target in this bullish swing , I can sway makes sense here is the full scope are where we are heading before another move up
Kris/Mindbloome Exchange
Trade Smarter Live Better

MCHP Breakout to 64 if we stay above 48Looks like a great break out trade for 4 bucks possibly more if your interested. MCHP looks like its driving up
Kris/Mindbloome Exchange
Trade Smarter Live Better

MCHP – 30-Min Long Trade Setup!📈
🔹 Ticker: MCHP (NASDAQ)
🔹 Setup: Falling Wedge Breakout + Oversold Bounce
🔸 Breakout Zone: ~$40.74 (yellow zone breakout)
📊 Trade Plan (Long Position)
✅ Entry Zone: $40.60–$40.80
✅ Stop Loss (SL): Below $39.08 (white key level)
✅ Take Profit Targets:
📌 TP1: $43.27 (red zone – resistance shelf)
📌 TP2: $46.10 (green zone – gap-fill target)
📐 Risk-Reward Breakdown
📉 Risk:
$40.74 - $39.08 = $1.66
📈 Reward to TP1:
$43.27 - $40.74 = $2.53 → 1.52:1 R/R
📈 Reward to TP2:
$46.10 - $40.74 = $5.36 → 3.22:1 R/R
🔍 Technical Highlights
Oversold bounce with bullish reversal candle
Falling wedge breakout forming
Yellow zone reclaim signals strength
Heavy sell-off likely overextended = high bounce potential
⚙️ Trade Management
🔄 After TP1:
– Move SL to breakeven
– Book partial gains
📈 Let rest run to TP2 with trailing stop under rising support
⚠️ Invalidation Triggers
❌ Break and close below $39.08
❌ Rejection with heavy volume at yellow zone
❌ Bearish engulfing back into wedge range

MCHP – 30-Min Long Trade Setup!📈
🔹 Ticker: MCHP (NASDAQ)
🔹 Timeframe: 30-Min Chart
🔹 Setup Type: Falling Trendline Break + Support Reclaim
🔸 Breakout Price: ~$48.47
📊 Trade Plan (Long Position)
✅ Entry Zone: $48.40–$48.50 (bullish breakout + yellow resistance zone retest)
✅ Stop Loss (SL): Below $47.62 (white support zone – structure low)
✅ Take Profit Targets:
📌 TP1: $49.63 (red line – minor resistance/supply zone)
📌 TP2: $50.81 (green line – previous high / major resistance)
📐 Risk-Reward Ratio
📉 Risk per Share:
$48.47 - $47.62 = $0.85
📈 Reward to TP1:
$49.63 - $48.47 = $1.16 → 1.36:1 R/R
📈 Reward to TP2:
$50.81 - $48.47 = $2.34 → 2.75:1 R/R
🔍 Technical Confluence
📌 Falling Trendline (pink): Finally broken with volume picking up
📌 Demand Zone Support: Bounce from ~$47.60, confirming buyers stepped in
📌 Yellow Zone: Acts as breakout retest + confirmation trigger
📌 Volume Observation: Look for volume continuation above yellow zone
⚙️ Execution & Risk Management
🔄 After TP1 Hit:
— Move SL to breakeven
— Book 50% profits
📈 Let the rest ride to TP2
📉 Use a trailing stop method above each support level
⚠️ Invalidation Signals
❌ Close below $47.62
❌ Breakout without follow-through
❌ Sharp rejection from yellow zone = fakeout risk
🦅 Final Thoughts
✔ Textbook reversal pattern
✔ Strong structure + tight risk = smart setup
✔ High potential for upside as market reclaims control

Bullish Re-Entry on MCHP – Strong Support & Long-Term TrendI’ve gone bullish on NASDAQ:MCHP once again, making this the third entry after being stopped out twice recently. Last Friday, I re-entered because the stock is in a strong, long-term bullish trend and currently holding at a key support level . Volume has also increased , showing renewed interest, and with the all-time high ( ATH ) not far off, there's strong potential for upside. This trade is structured with a 1:18 risk/reward ratio for an optimal setup.

MCHP Bullish Setup – 1:25 R:R with 3 Consecutive Doji CandlesNASDAQ:MCHP has arrived at a key historical support level, and we’ve now seen 3 consecutive doji candles, indicating indecision but a potential bullish reversal. The stock remains in a long-term uptrend, with the all-time high (ATH) not far off.
Increased volume suggests renewed buying pressure, offering an excellent 1:25 risk-to-reward ratio if support holds. After my stop was triggered this month, I’ve bought back in, confident in the strength of this setup.
This analysis is supported by the invite-only Trend Recognition Indicator by PattRec .

Long trading idea on $MCHPLong trading idea on NASDAQ:MCHP
Reasons to buy:
The stock has arrived at a strong support level, maintaining its long-term uptrend.
We're not far from the all-time high (ATH), offering a favorable risk/reward ratio of 1:18 until ATH.
Increased volume and the formation of a doji signal a potential reversal after a recent downturn.
Strategy: Partial take profits can be placed before reaching ATH, with the rest held for a longer-term target beyond ATH. Looks like a solid opportunity!

MCHP Sort Setup If price comes back to this zone then sell 153 Shares = $100 risk
manage the trade to target 1 for a 9.94:1 Profit potential and maybe higher with trade management.

MCHP Long Setup: Oversold Rebound w/ Rising Volatility & VolumeMicrochip Technology (MCHP) is presenting a promising long opportunity for a temporary rebound, supported by three strong technical factors:
Slow Stochastic in Extreme Oversold Territory : The indicator is below 20, signaling excessive selling pressure, often linked to potential short-term recoveries.
Rising Volatility Index (LSVI) : The significant increase in volatility suggests the market is entering a phase of larger price movements, increasing the probability of a sharper rebound.
Increasing Volume with Reduced Decline: Recent candles show higher trading volume accompanied by a slowing rate of decline, indicating potential buyer activity and a technical correction from the recent sharp drop.
With the price near a critical support zone and a target identified at $65.00 (10% gain), this setup offers a compelling risk-reward ratio for short-term traders. If the price crosses above the red line, it may reach $71.00 (20% gain).
Watching for confirmations such as a %K/%D crossover on the Slow Stoch and sustained buying volume will be key to validating this thesis.
Disclaimer : Always manage risk carefully, particularly in high-volatility environments.

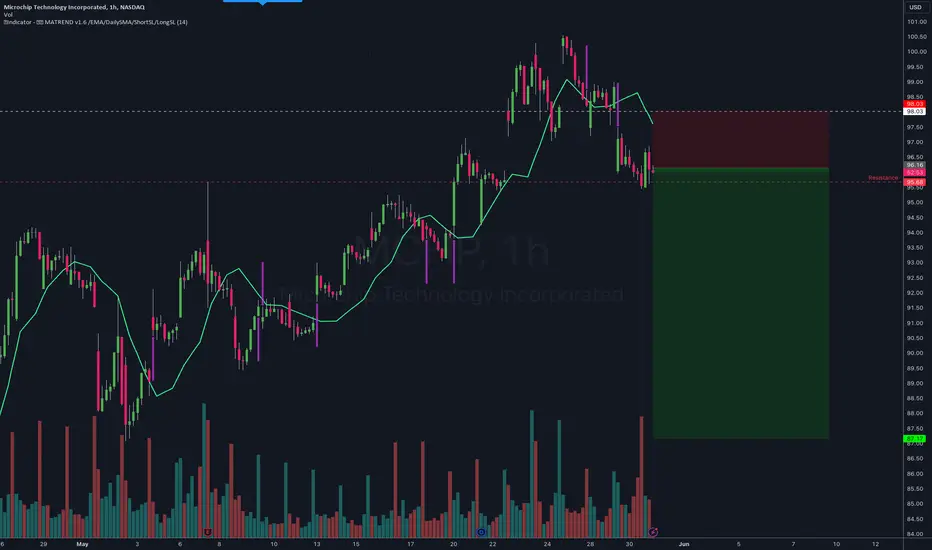
MCHP - JULY 24 MATrend Sustainable Momentumsubmitted MCHP's order before market open. Stock dropped significantly as the broader market was already falling.
I closed the trade early as per plan as tomorrow is the release of the GDP report (High impact)
MATrend Sustainable Momentum (Systematic) 🚀
This is a variant of the Unsustainable strategy. System identifies stocks (Tech sector) that follows the larger market regime's momentum of the day.

MCHP - May 24 (MATREND v1.6)Entered Short MCHP based on the 29 May signal. This is a good exploration probe because if price breaks the resistance we should see some good downward movement.
Regime Indicator: Bearish
v1.6
Exit rule tweaked to Daily 10SMA
Calibrated entry specs, to slightly loosen up the Stoploss
atr_x = 2.5
entry_atr_xfactor = 3.7
-----
This is a simple systematic Trend strategy where entry is based on two conditions
1. Price crossing over the EMA
2. The present ATR is less than an ATR multiple
The ATR condition allows us to enter trades that has not gapped too much as that usually results in a price pullback
Risk
Fixed & tight SL based on ATR multiples closes trades fast
Closing of the trades is a simple price cross over the daily SMA
This strategy only has a 34.38% win rate. So most trades will end up as losers until we hit a strong upswing.
MCHP Ascending triangle breakoutReasons for bullish bias:
- Ascending triangle breakout
- Price broke All time high
- Strong resistance breakout
Here are the recommended trading levels:
Entry Level(CMP): 100.40
Stop Loss Level: 91.77
Take Profit Level 1: 109.03
Take Profit Level 2: 117.66
Take Profit Level 3: Open

MCHPMicrochip Technology Incorporated is a publicly listed American corporation that manufactures microcontroller, mixed-signal, analog, and Flash-IP integrated circuits.
Bias: Buy/Long

$MCHPBulls are starting to be in control above $80.
Currently it is strongly defendec by sma250 which is a very strong threshold to break to be bearish.
SL is just below the sma250 at $80.
My view is it will pump starting this wéek after the Magnificent 6 have completed reporting by this week.

🔍🔧 Microchip Technology (MCHP) Analysis 🌐💻📊 Company Overview:
Microchip Technology, a global developer and manufacturer of smart and secure control solutions.
📉 Current Market Condition:
Navigating a cyclical downturn as acknowledged by its management.
🔄 Temporary Downturn:
Despite challenges, indications suggest Microchip's downturn is temporary.
Expected return to growth in the future.
📈 Historical Profitability:
Demonstrated remarkable ability to maintain high profitability throughout its history.
👥 CEO Perspective:
CEO Ganesh Moorthy anticipates a cycle similar to the rush to buy chips two years ago.
Forecasts an average annual revenue growth of 10% to 15% through fiscal year 2026.
📈 Market Analysis:
Bullish outlook on Microchip Technology (MCHP).
Suggested entry above the $80.00-$81.00 range.
🎯 Upside Target:
Upside target set in the $124.00-$126.00 range.
📣 Conclusion:
Microchip's history of profitability and CEO's confidence in future growth contribute to a positive outlook.
Entry suggestion and upside target align with potential industry rebound.
Stay informed for evolving market trends! 📰💹 #MicrochipTechnology #MCHPAnalysis #MarketWatch 🌐📊

MCHP: Potential Buy AreasSince 2022 price has been rising in a channel. Expecting the price to stay in a bullish channel backed by positive analyst expectations.

Looking for Long Ideas in the "Whoosh" StocksAfter big sell-offs, my first area to look for longs is in the stocks that had a "whoosh" on the downside, followed by positive reversals. ADI fits those criteria.

MCHP, Uptrend based on AlgoSignal StrategyThe current point exhibits promising upward signals according to my algorithmic system, meeting various criteria. These include rising trading volume, an upward trend indicated by prices above EMA20 and EMA50, and the closing price surpassing VWAP. As a result, the present conditions suggest a potential upward trend.

$MCHP Ready to Break Downtrend?NASDAQ:MCHP is heavy into automotive chips along with many other industries as well. When looking at the chart I see that we have a longer-term double bottom formation that put into play an Undercut and Rally on Nov 2nd, which was the earnings date. That is technically still in play.
It looks like it will break out of the downtrend line today where I have an alert. I like the accumulation volume before and after earnings. NASDAQ:MCHP has regained the faster moving averages but is still below the 50 DMA in red and the 40-week MA in white. The MACD turned up just 3 days ago.
Lastly, NASDAQ:MCHP has either been reiterated or upgraded to either “Buy” or “Outperform” by at least 4 different analysts in the last few days. The average price target is $101.
Ideas, not investing / trading advice. Comments always welcome. Thanks for looking.

Microchip Technology Incorporated at support levelMicrochips are ever needed for hardware development companies so Microchip Technology Incorporated is pretty sure investment especially as MCHP is at 10 months up slopping support line now - best moment for accumulation.
Recommended entry price: 77.50
Target price 1: 89.00
Target price 2: 100.00
Stop loss: 75.00
