Double BottomDouble Bottom if it holds.
Earnings estimated to be 11-2
Volatile stock.
No recommendation/T1 in larger green type, T2 smaller type then T3.
M1RN34 trade ideas

$MRNA with a Bullish outlook following its earnings #Stocks The PEAD projected a Bullish outlook for $MRNA after a Negative over reaction following its earnings release placing the stock in drift A.

chop and filli think we hang out for a min then fill this gap. This pops around alot, so i'd be loose with stops
IF this gap fills and doesn't tank (pre-market) i think we'll test the daily wick from yesterday. Id consider plays in the range

QuickTrade 97 : MRNALong, looking for a continuation of this bullish cross
Short, looking for a fake-cross

MRNA harmonic 886 retracement. Interesting i article I found on the web on retracements. Different pattern but the idea is the same context. "short XA retracement particular, I realized that the B point within a Gartley-type structure that was less than a 0.618 would almost always exceed the expected 0.786 retracement of the XA leg at the projected completion point. I showed Jim this new pattern — called “the Bat” — which used what I was calling a “deep 0.786 retracement.” I told him that executing at the 0.786 without regard to the structure was a critical mistake. Besides, the 0.886 retracement, when used in the correct pattern structures, reduced the amount of risk in previously “undifferentiated” Gartley set-ups by 10 percent."
old.harmonictrader.com
I hope you enjoy the TA.

$MRNA - Head & Shoulders + Double Top continuation baseKey intakes:
- Head & Shoulder Pattern (m).
- Double Top Pattern (w), as the right shoulder of the above.
- No breakout yet to confirm both.
- Are you sure you want to short this market with so much congestion underneath?
- Are you sure you want to go along with so much bearish presence?
- Immaculate example of how an uptrend can be captured with just:
1. A breakout from the IPO base;
2. A 10 EMA (m) trailing the price;
3. A ***tload of discipline and confidence in your system earned through countless hours of chart time, backtesting and a lot of golden teeth.

MRNAHead and shoulders on Moderna stock. Biden over the weekend stated the pandemic is over based off headline news.. Just a matter of time until the stock is worth about 40-70$.. been waiting on this.
This company was worth decimals before the pandemic lol.

MRNA short sale$MRNA Joe Biden says the COVID-19 pandemic is over. After breakdown 140 zone , now we ca go to 115 lvl june lows, #doublebottom #markets #stocks $SPX

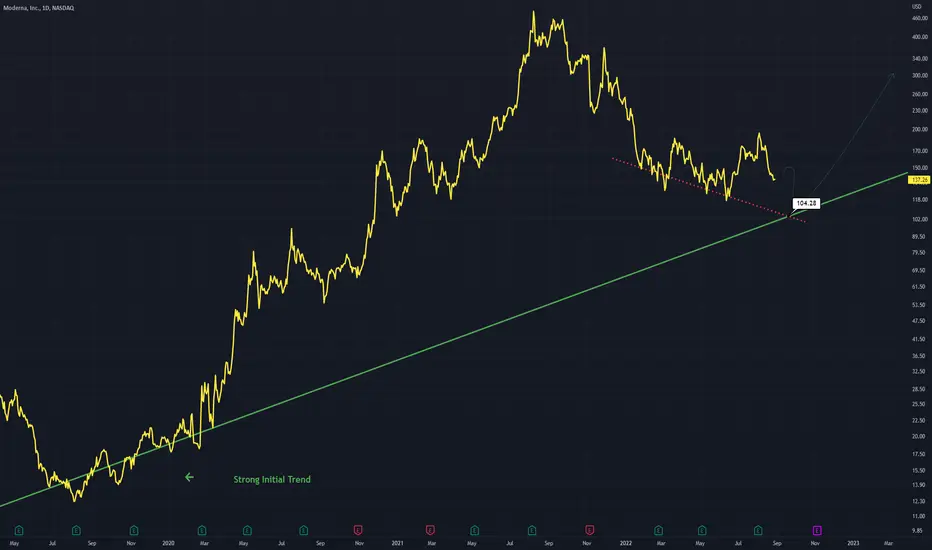
MRNA - Moderna Recovery Suggesting a recovery at 104.28 for Moderna
A bottom is attempting to form
This recovery point is along a stronger yet lower trend line
Moderna to $90?Moderna could have another leg down and may bottom somewhere in September targeting $90.

QuickTrade : MRNAFast trade with entry levels and targets.
The current downward wave may need a pullback.

MRNA - Buy after a sell-off, Vaccines are here to stayVaccines are here to stay and many companies will have a good balance sheet in coming years. Moderna is a buy and I am DCAing from 186 down to every monthly dip.
MRNA will recover above 200 within 2022

Moderna at key resistance? Moderna
Short Term
We look to Sell at 183.71 (stop at 203.39)
Preferred trade is to sell into rallies. Previous resistance located at 190.00. Trading within a Bearish Channel formation. Our overall sentiment remains bearish looking for lower levels. The bias is still for lower levels and we look for any gains to be limited.
Our profit targets will be 121.74 and 94.19
Resistance: 190.00 / 220.00 / 495.00
Support: 156.00 / 120.00 / 100.00
Disclaimer – Saxo Bank Group. Please be reminded – you alone are responsible for your trading – both gains and losses. There is a very high degree of risk involved in trading. The technical analysis, like any and all indicators, strategies, columns, articles and other features accessible on/though this site (including those from Signal Centre) are for informational purposes only and should not be construed as investment advice by you. Such technical analysis are believed to be obtained from sources believed to be reliable, but not warrant their respective completeness or accuracy, or warrant any results from the use of the information. Your use of the technical analysis, as would also your use of any and all mentioned indicators, strategies, columns, articles and all other features, is entirely at your own risk and it is your sole responsibility to evaluate the accuracy, completeness and usefulness (including suitability) of the information. You should assess the risk of any trade with your financial adviser and make your own independent decision(s) regarding any tradable products which may be the subject matter of the technical analysis or any of the said indicators, strategies, columns, articles and all other features.
Please also be reminded that if despite the above, any of the said technical analysis (or any of the said indicators, strategies, columns, articles and other features accessible on/through this site) is found to be advisory or a recommendation; and not merely informational in nature, the same is in any event provided with the intention of being for general circulation and availability only. As such it is not intended to and does not form part of any offer or recommendation directed at you specifically, or have any regard to the investment objectives, financial situation or needs of yourself or any other specific person. Before committing to a trade or investment therefore, please seek advice from a financial or other professional adviser regarding the suitability of the product for you and (where available) read the relevant product offer/description documents, including the risk disclosures. If you do not wish to seek such financial advice, please still exercise your mind and consider carefully whether the product is suitable for you because you alone remain responsible for your trading – both gains and losses.

Bull FlagEarnings beat.
This looks like it may pull back a bit but who knows.
No recommendation
Short interest is 4.75%

MRNA - Feeling bullish for $200We have seen some solid price movement on MRNA over the past week. We saw pushes past the 180 levels of resistance and now hover within the 190 zone. I am looking for a nice clean break out of $200 to hopefully give us enough legs to get to $210 in the coming weeks. On the daily chart we are coming out of a MACD Cross which is one of my favorite technicals to look at. With news on Monkey Pox as well being a global issue, a stock like this one can see benefits in the coming months as well. Whether I am short or Long I am bullish at this time.

MRNA has rallied 66% from its bottom MRNA has rallied 66% from its bottom set in mid june.
Technical indicators suggest a strong turnaround.
The P/E ratio and Forward P/E ratio remain in the low single digits.
I boosted my position when the price crossed above the 50 day EMA.
I will take advantage of any pull-back below the 200 day EMA close or low.
Overall, this is still a nice entry point if you wish to go long MRNA for the rest of the decade.

MRNA and WTZ1 MRNA is consolidating inside the range for several weeks; and then, it's likely breaking out the upper range after earning announcement. I apply WTZ1, my favorite setup, for making the plan. The Next range is supposed to be its target. Good Luck :oP

8/3/22 MRNAModerna, Inc. ( NASDAQ:MRNA )
Sector: Health Technology (Biotechnology)
Market Capitalization: $74.178B
Current Price: $186.49
Breakout Price: $189.50
Buy Zone (Top/Bottom Range): $180.95-$147.05
Price Target: $204.50-$208.80 (1st), $258.80-$263.70 (2nd)
Estimated Duration to Target: 34-37d, 91-96d
Contract of Interest: $MRNA 9/16/22 190c, $MRNA 10/21/22 200c
Trade price as of publish date: $13.96/contract, $15.55/contract


MRNA early in trend reversalCatalyst may be the federal government's plan to purchase
vaccines for new Covid variants for the fall but then again
purchases from governments on a global basis is further
for future revenues being priced in.
Chart shows trend reversal with crossovers of RSI, MACD
and relative volume.
Is MRNA about to get a fever>

Moderna seems to have ended the down trend Either this is the start of a new uptrend or it is just a pause in the down trend, Moderna has broken the bear channel which should imply a push higher at least in the 270 area.
SL around 135 below 0.65 FIB from last wave.

MRNA - SHORT THESISBearish on MRNA, though earnings are always a toss up. If we see a breakout to upside, I believe it's a good short opportunity. Earnings may just flop, and it finds itself testing neckline of weekly H&S, sloppy looking one at that.
Notable areas that could see short term reversals and/or support...
$102, 95, 88, 75

MRNA RetestMRNA has retested support around the 156 area and showed a bullish close on the hourly/4hour/daily charts. The range here is 156 to 184. MRNA had a healthy pullback to support and now looks to continue upward in the range.
