the idea that it has potential growth can have a lasting effectWith every indicator and level booming right now, it may not be long before we see some reset on the RSI and stochastic. Both sit at 70, but MACD is curling up to provide some sort of continuation, but the Bollinger bands are stretched out very thin; I wouldn't be surprised if it is low 500 before a continuation, but something has to happen to cool down the temperature
M1TA34 trade ideas

Potential Path of METAIn the chart NASDAQ:META
Pattern : Rising wedge
Up trend.
The potential path of META has shown.

META potential Buy setupReasons for bullish bias:
- Price broke ATH
- Price giving resistance breakout
- Breakout of point B in AB=CD harmonic pattern
- No divergence
Here are the recommended trading levels:
Entry Level(CMP): 537.48
Stop Loss Level: 446.00
Take Profit Level 1: 628.96
Take Profit Level 2: 666.86
Take Profit Level 3: Open

META Platform Meta witnessed a strong rebound in Friday's session, violating that major peak and the all-time high at 531.49$. then, the confirmation of this breakout by remaining above 531.49$, will confirm the major uptrend, which will push META to test higher levels near 553 - 567 - 580 - 603.80 - 650$ in the short term.
The stop-loss lies below 512$.
the indicators are heading toward the positive side, which confirms the mentioned positive scenario.
The information and publications are not intended to be or constitute any financial, investment, commercial, or other types of advice or recommendations provided.

META: Entering into blue sky zone with powerful buyers !What a chart to have complete study on gaps.
1. Pro gap: 12% gap up with strong candle with volumes. See the chart on 2nd Feb when Buyers are completely in control and after that the price continued to go up further 17% from there.
2. Profit booking: There was a decent correction of 10% until we that big gap down.
3. Gap filled: 15% gap down on April 25 where sellers tried to show their presence and threatened the buyers that created the gap on 2nd Feb.
Now watching carefully, the gap was nearly filled but then came the buying with another big green candle and with huge volumes.
4. Rally and fresh breakout: Now we see the new breakout on chart with buyers in control.
However, given the straight rally the risk reward could be little unfavourable. But it still looks like a great chart to read.

Can Meta's Threads Challenge the Social Media Giants?Meta's Threads, the text-based social media app launched with much fanfare a year ago, has reached 175 million monthly active users (MAUs). This milestone signifies a strong first year, but questions remain about whether Threads can truly challenge the social media titan, X.
There's no denying Threads' impressive growth. Reaching 175 million MAUs within a year is a commendable feat. Mark Zuckerberg celebrated the achievement, highlighting India's role as a key driver of user engagement. The initial surge was phenomenal, with Threads reaching 100 million users just five days after launch. Growth has since stabilized, but the upward trend continues.
However, comparing Threads to X is a different story. X boasts billions of users globally, dwarfing Threads' current reach. While 175 million is a respectable number, it's a fraction of X's user base. Furthermore, X has a well-established ecosystem of features, influencers, and deeply ingrained user habits. Despite its initial success, Threads needs to carve out its own niche and establish itself as more than just a "Twitter-like" offering from Meta.
Several factors could influence Threads' future trajectory.
• Feature Development: One crucial aspect is continuous development of compelling features. Threads' current offerings include text posts (up to 500 characters), photo and video sharing, and close friend groups. Adding features that cater to specific user needs and foster deeper engagement will be vital.
• Monetization Strategy: Monetization is another key consideration. While Meta hasn't revealed concrete plans yet, a well-crafted strategy that doesn't intrude on user experience is essential. Subscription models or targeted advertising with clear user opt-in options could be potential avenues.
• Competition: The social media landscape is fiercely competitive. Threads faces competition not only from X but also from established players like Snapchat and emerging platforms. Differentiation and a clear value proposition will be crucial for attracting and retaining users.
• Integration with Existing Platforms: Leveraging the vast user base of Instagram, which is owned by Meta, could be beneficial. Cross-promotion and strategic integration, without forced migration, could introduce Threads to a wider audience.
The current neutral outlook on META stock reflects the wait-and-see approach from investors. While Threads' initial growth is promising, it hasn't yet translated into significant revenue streams or user base expansion that would dramatically impact Meta's overall performance.
In conclusion, Threads has had a promising first year. Its ability to challenge X, however, remains to be seen. Continuous innovation, a well-defined monetization strategy, and strategic differentiation will be key factors in determining its long-term success. Whether Threads becomes a true competitor or remains a niche offering within the Meta ecosystem will depend on its ability to navigate the competitive landscape and carve out its own space in the ever-evolving social media world.

META PlatformsMETA witnessed a rebound after forming a new higher low at 492.39, to violate the last peak at 514 by today's session, and the confirmation of this breakout by remaining above 514, will confirm the current uptrend, which will trigger further rises near 523.60 - 531.50 - 535.65 - 541.50 - 549 on the short term.
The stop-loss lies below 492.39.
the indicators are heading toward the positive side, which confirms the mentioned positive scenario.
The information and publications are not intended to be or constitute any financial, investment, commercial, or other types of advice or recommendations provided.

Is META going to start Sideways Trend?In the chart - NASDAQ:META
Trend Analysis:
Weak up trend. It may break out the trend line and start short term sideways trend.
At the end of the sideways trend, A breakout may be occurred.
Pattern:
Rising channel. It may break out the channel.
Support/ Resistance:
It will be difficult for price to break out the resistance - 513.78
So it may follow trading range.
During trading range,
513.78 - may act as resistance.
493.12 - may act as support.

Buy Set-Up for Meta Platforms Inc. (META)Moving Averages:
The stock is trading above its 50-day moving average, indicating a bullish trend.
Volume:
Steady volume supporting the upward movement, suggesting strong buying interest.
Trend:
The chart shows a clear upward trend with higher highs and higher lows, indicating a strong bullish sentiment.
Recent Breakout:
Meta has broken above previous resistance levels and is maintaining its position above $500, which now acts as a psychological support level.
Fundamental Analysis
Strong Financial Performance:
Meta reported revenues of $36.46 billion for Q1 2024, a 27.3% increase year-over-year, and net income of $12.37 billion (Investor Relations - Facebook).
Growth in AI and Metaverse:
Significant investments in AI and metaverse technologies, positioning Meta at the forefront of digital innovation (Investor Relations - Facebook) (Stock Analysis).
Analyst Confidence:
Strong buy ratings from the majority of analysts with an average price target of $511.27, reflecting positive sentiment towards Meta’s growth prospects (MarketBeat) (Stock Analysis).
Dividend Yield:
Meta offers a sustainable annual dividend of $2.00 per share, yielding 0.40%, indicating financial stability and shareholder value (MarketBeat).

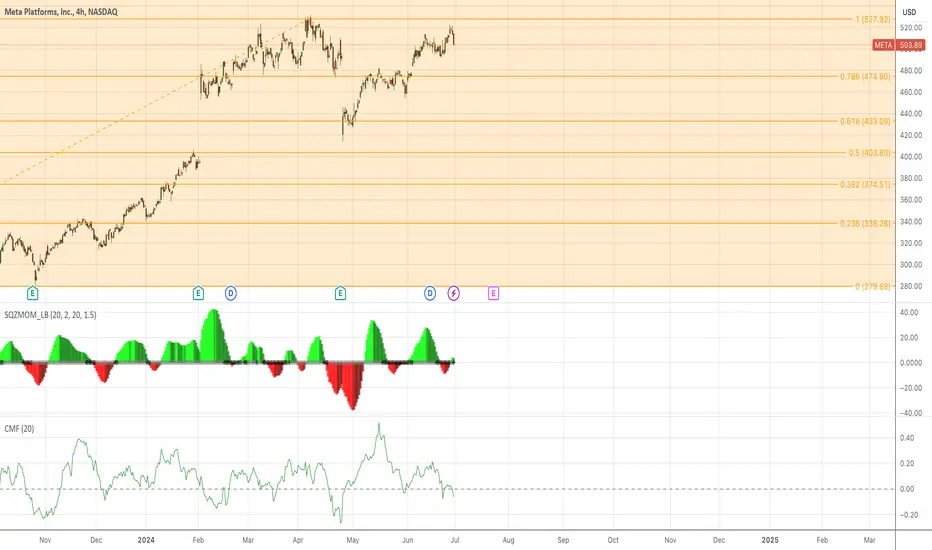
META continuationMETA starting to consolidate and contract just below all time highs. We are also receiving a blue continuation signal on it.

META - End of bull run?Meta is showing signs of exhaustion in its uptrend move. In my primary wave count, I´m considering that we will make a new all-time high for blue and black wave 5.
We also have an open gap at 406.36, which could be a target for a correction.
But let´s take it one step at a time... first step is to wait for the higher high and see if there is selling pressure.

facebook - META Idea I
12M: Bullish Engulfing
→ Grey zone 453 – 509
→ 537, 553, 465 above , 390 below
3M: Could not break above high of prev. candle. But closes bullish
→ range of last quarter becomes important
→ grey area provides a possible reversal/ continuation zone.
→ Stochastic is turning down
Monthly: closing in bearish territory → bullish
→ could not close above highs
→ stochastic turning up = bullish setup above 509, bearish below
3D: Possible Double Top forming
→ could be an early sign of bears once validated. Bulls should show up soon
→ likelyhood of bullish progression is higher because of stochastic turning up

Quick dump : But ready to take offAs soon it takes a quick dump this is ready for a big pull back towards 550 in
After Earnings Pop past new high onlyMeta bullish optimism won’t be strong enough to surpass resistance. AI news will make it pop past it on earnings though.

The Zucks just announced paid subscriptions for FB and Instagram"Meta CEO Mark Zuckerberg announced a new paid subscription service for Facebook and Instagram on Sunday, granting users a hallowed blue check for a monthly fee. Meta Verified will cost $11.99 a month on web and $14.99 a month on iOS. It's launching in Australia and New Zealand this week ahead of a wider rollout. The subscription "lets you verify your account with a government ID, get a blue badge, get extra impersonation protection against accounts claiming to be you, and get direct access to customer support," Zuckerberg said."
Be interesting to see if this gives FB price a bit of a bump with the potential new revenue that could be generated by this.

META: DOUBLE TOPMETA still may run up to the 1.618 FIB extension of 526-527 before an assumed fall to PT1 of 492, then PT2 462

Meta Sneaks Toward Old HighsMeta Platforms has been grinding upward for the last two months, and some traders may see potential for a breakout.
The first pattern on today’s chart is the bearish gap on April 25 after guidance missed estimates. The social-media giant avoided making new lows after the drop and recovered, which may suggest that buyers were lurking.
Second is the pre-gap close of $493.50. META pushed above the level in early June and successfully retested it. That may erase any lingering negativity from the recent selloff.
Third, MACD is rising and the stock has held its rising 100-day simple moving average. Those patterns may reflect bullishness in the short- and longer terms.
Fourth, META is attempting to break a short-term trendline that formed over the last two weeks.
Finally, consider the broader megacap growth space. The sputtering price action in Nvidia has caused some anxiety, but other names like Amazon.com, Apple, Alphabet and Microsoft have remained at or near record highs. That may reflect confidence in the broader group, with the potential for sentiment to move away from chips toward other large Nasdaq stocks.
TradeStation has, for decades, advanced the trading industry, providing access to stocks, options and futures. See our Overview for more.
Past performance, whether actual or indicated by historical tests of strategies, is no guarantee of future performance or success. There is a possibility that you may sustain a loss equal to or greater than your entire investment regardless of which asset class you trade (equities, options or futures); therefore, you should not invest or risk money that you cannot afford to lose. Online trading is not suitable for all investors. View the document titled Characteristics and Risks of Standardized Options at www.TradeStation.com . Before trading any asset class, customers must read the relevant risk disclosure statements on www.TradeStation.com . System access and trade placement and execution may be delayed or fail due to market volatility and volume, quote delays, system and software errors, Internet traffic, outages and other factors.
Securities and futures trading is offered to self-directed customers by TradeStation Securities, Inc., a broker-dealer registered with the Securities and Exchange Commission and a futures commission merchant licensed with the Commodity Futures Trading Commission). TradeStation Securities is a member of the Financial Industry Regulatory Authority, the National Futures Association, and a number of exchanges.
TradeStation Securities, Inc. and TradeStation Technologies, Inc. are each wholly owned subsidiaries of TradeStation Group, Inc., both operating, and providing products and services, under the TradeStation brand and trademark. When applying for, or purchasing, accounts, subscriptions, products and services, it is important that you know which company you will be dealing with. Visit www.TradeStation.com for further important information explaining what this means.

$METANASDAQ:META looking really good on the daily. just NASDAQ:ARM , NASDAQ:PANW are showing same cup n handle and I expect a breakout this week, or next week latest from all three of these stocks from these cup n handles

How we utilize our META algorithms for trade entriesAnother back-testing-like video which dives a bit deeper into the algorithms.
I know my analysis is not for everyone but I appreciate anyone who finds these videos helpful!
Happy Trading :)

META: Week of June 24thJust my thoughts on META for next week.
As always, leave your questions below and safe trades!

480 imminent from the theory based behind the trend lineEverything is seemingly headed in a direction of support, and retest key areas on the trendline, and with a lot of room above and below, there may be a few tests around this region again before it shows a solid upside movement.


Live Trading/Scalping METAHere I put the HTF analysis and algorithms that I posted in my video this morning to action.
This was a lot of fun for me to do and I will start to "live trade" more often for you all if you find it helpful. I would think it gives a deeper insight into how I actually utilize my strategy in the markets by utilizing the higher time frame analysis that I give in my other videos.
Please let me know if you enjoy this type of content and what you'd like to see next!
(Price ended up dumping down to 497 minutes later!)
Happy Trading :)
