META New rally to $800 started.Meta Platforms (META) is consolidating within the 1D MA50 (blue trend-line) and 1D MA100 (green trend-line) only 3 weeks after it touched the bottom (Higher Lows trend-line) of the 1-year Channel Up.
This is the start of the new Bullish Leg of the pattern, half-way through the accumulation process. Once the 1D RSI breaks above its Lower Highs trend-line, we will have a bullish confirmation signal similar to October 06 2023. Our Target is $800.00, which represents a +95% rise, similar to both previous Bullish Legs of the Channel Up.
-------------------------------------------------------------------------------
** Please LIKE 👍, FOLLOW ✅, SHARE 🙌 and COMMENT ✍ if you enjoy this idea! Also share your ideas and charts in the comments section below! This is best way to keep it relevant, support us, keep the content here free and allow the idea to reach as many people as possible. **
-------------------------------------------------------------------------------
💸💸💸💸💸💸
👇 👇 👇 👇 👇 👇
M1TA34 trade ideas

META x10 to $1600Meta has fully recovered from its 2022 losses, which occurred when investors panicked and sold off shares due to concerns over Zuckerberg's heavy spending on the Metaverse.
The swift V-shaped recovery has transformed Meta into a momentum stock. From a technical perspective, it has the potential to double in value compared to its previous losses.
So, what are the fundamental reasons behind a potential 10x increase? While investors were panic selling over PS2-style graphics, they overlooked what was powering Meta's vision. Meta boasts a substantial arsenal of over 600,000 H100 AI chips, far surpassing any other company in the tech industry.
For context, Tesla only has around 35,000 H100 AI chips, Google has 76K and Microsoft just over 150k. Most of Meta's chips were acquired before the AI boom, and its ongoing orders position it to lead in building out a robust AI infrastructure.
If you're betting on the second generation of AI, it is then crucial to consider who has the most resources. Investors are beginning to recognize that Zuckerberg is a visionary CEO are getting behind him.

[mid-term] META Price Prediction :30% profit expectMETA Price Prediction
Welcome to this updated analysis on META
Let’s get right to it!
This information is to be used for educational purposes only
TRANSPARENCY Strategy

$META SHORT SIDE PLAY AVAILABLE1:1 Risk Reward, Fibonacci retrace to short side, impulse imminent. Meta Quest was poorly received product relative to hype, to be clobbered by Apple Vision Pro.
~26 P/E ratio is poor for a technology company that is this far past IPO. 40+ is required for tech company growth at 1.618 Fibonacci ratio growth checkpoints.
NASDAQ:META may be in for some trouble.
Load your shorts boys and girls, we're going down, down, down.
Love,
dysonring2050

Test of 427 at Least (final TGR pt. 5)Loading July puts in the price range 460-485.
I will continue to accumulate puts in this zone until either of the 2 scenarios below occurs:
1) If price drops below 460 at any point
2) If price is still in this zone on 5/14 (next Tuesday)
If either of these occur my position will be complete.
Main/primary forecast:
- Reversal begins tomorrow 5/9, initial target is a break below 460 by 5/10
- Goal target = 427 by 5/17
Alt. forecast :
- META takes until 5/15 to break below 460
-Goal target = 427 by 5/31/2024
Stop Loss = close above 485
Not Fin. advice
--------------------------------------------------------------------------------------------------------------------
This is my last prediction for now in The Goat Returns series (a set of bearish ideas for the expected market drop over the coming weeks).
The other ideas in the series are linked below.

Meta. where is its "safety of margin" if crashed? 14/May/24Meta / Facebook share price currently at major resistance (upper parallel line). If there was "a crash". The "Margin of safety" probably at 218 +/- which is a confluence zone of 1) Monthly Order Block 2) Median Line of parallel channel,

Meta Platforms 33-Days Cyclical price patternThere are many ways to make money with stocks. You can buy well-managed companies with growing earnings, hold them for years and watch the stock prices rise as the company succeeds. This conservative investing style sometimes rewards investors with huge long-term gains. For example, early investors in Microsoft or Bitcoin saw their investments grow MultiX in a decade.
This is what patient long-term investors dream about. But more often buy-and-hold investors don't hit the jackpot; rather they realize more modest returns.
Another investing style is to trade stocks very frequently with the help of computer programs that buy and sell shares of selected companies. Here traders make small profits or losses on many trades minute after minute. If you like lots of action while you're glued to a computer screen, this investing style might be for you.
Cyclical Price Pattern - An Opportunity to Make Money
And then there is every imaginable money making scheme that falls between the above two styles. You can buy mutual funds, exchange-traded funds, index funds, buy and sell individual stocks, time the market, buy on margin, sell short, buy and sell options, reinvest dividends, or some other variation on the theme. Talk with fellow investors and everyone has their own tailor-made approach to investing.
This article is about one investing style - buying and hold Meta Platforms (META) shares using Cyclical price pattern.
It's a style that I use and I know it makes money.
Buying cyclical stocks for a profit at certain points is a huge challenge but with commitment, multi-year trading experience and the proper technical tools you can consistently make money over your investing career.
Cyclical price pattern is very simple to understand. A single cycle has an upside during which prices rise to a peak and a downside or cooling off when prices fall to a bottom.
Based on this cyclical price pattern, I expect further upside price action in Meta Platforms stock, somewhere until National Unicorn Day.
Days to go: 33.

$NASDAQ:META TIME FOR LONG CALLS? Now that NASDAQ:META has closed above all EMAs on the daily, is it time for long calls? MACD is still negative but now over the SMA on the daily with healthy RSI trending within the ichimoku cloud. Looking for a retest at the Golden Fib Retracement level of 486.80. If we break through that $500 should be inevitable in the long call.

META GAP AREAOn a 1-hour time frame, observing Meta's price action gap involves noting sudden shifts in opening and closing prices between consecutive candlesticks. This discontinuity signals significant changes in market sentiment and supply-demand dynamics. Traders interpret bullish gaps as positive sentiment and increased buying pressure, while bearish gaps signify negativity and heightened selling pressure. Volume confirmation strengthens the analysis, guiding traders in potential entry or exit points. Effective risk management, including stop-loss orders and proper position sizing, is crucial for mitigating losses.

META: Potential 5 to 10 Bagger in 2024-2025Fundamentals:
Sales have accelerated in META and earnings are above 20% q/q. However, its three-year earnings are below 5%. But if this changes when earnings come out in April 2024, then that will renew META as a super stock for 2024.
Weekly:
uHd
50% fib and diagonal support with a-b-c extension downward into support.
Kijun trend bounce
target:
600-800

META BUY BUY BUY highly oversold on dailyMETA took a shellacking on the last ER. It's way oversold on the daily, we could fill the entire gap down but we should easily bounce to $459.98 and $473.00 market dependent and cooperating it could fill entire gap to $486.62 in a best case scenario. Buy calls, or sell put credit spreads is the best way to play this 1-4 weeks out

META :SUPERMILLENNIUMNice to meet you. SEOVEREIGN - server.
Usually, the market determines the direction of determining the direction before there is a FOMC meeting.
But this time, major indexes such as Naes and SPX DJI started the HaX DJI.
Among them, it is META.
Mary's gonna arrive at the high point of Elliot Parker.
The stock price may be paid in the future
Metropolitan Government shareholders can't be careful if you can't be careful.

Possible LONG on META stock off W dz Possible LONG on META stock off W dz
1/3 RR
Maybe it is possible to target opposing D1 imbalance

Meta grabbing liquidity from Supply zone .Meta grabs liquidity from Buyers at Supply zone then enters a range for S&D zone , for now its at Discount Price Range good long reversal expected unless theres not enough liquidity and create Trend Change to Short

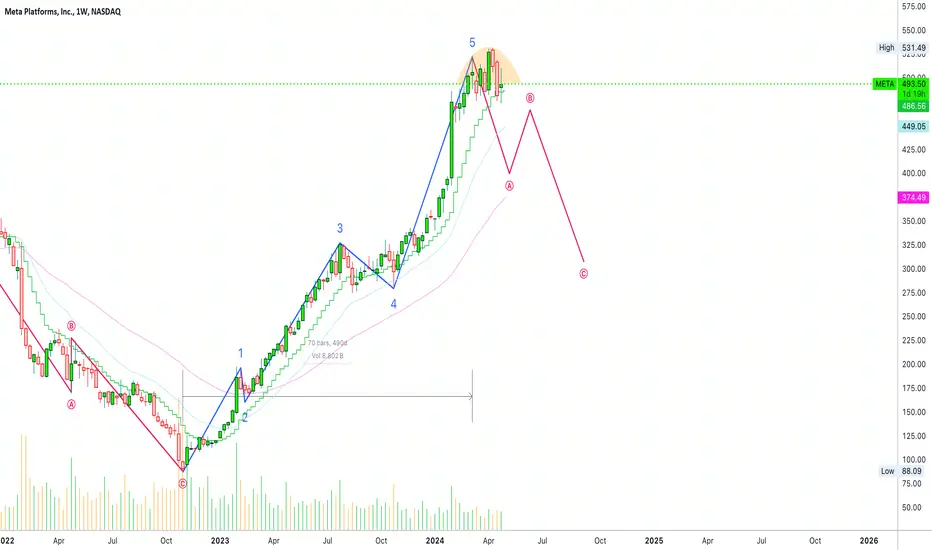
📉 Meta Completes Bullish ImpulseI can spot a perfect 5-up wave pattern from October 2022 through March 2024. A correction is likely to follow next.
On the chart we have a classic Zig-zag (ABC) correction (5-3-5) but any type of correction can develop. It can be flat, complex, extended, irregular, etc.
There is always the possibility that wave five is not yet over or that it becomes extended; in this case, we continue to expect a correction to show up.
Namaste.
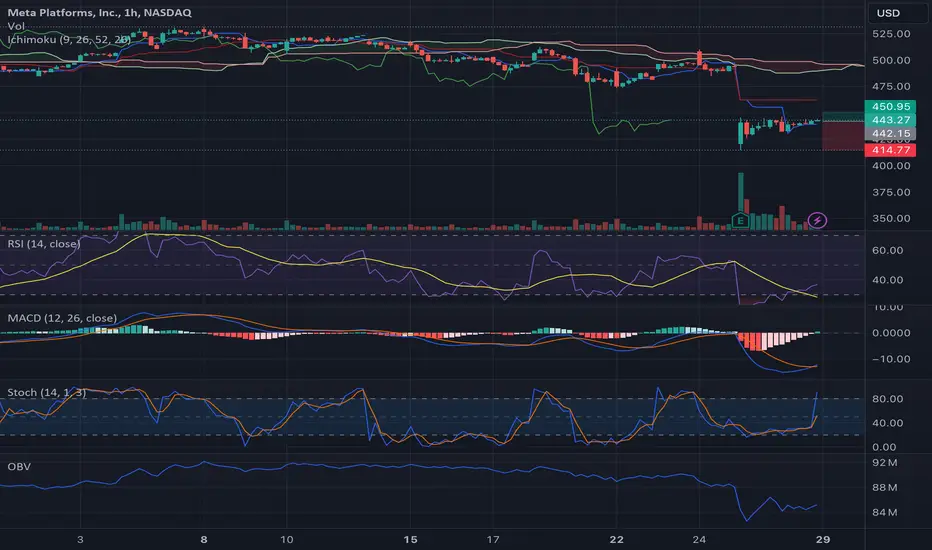
Meta Platforms, Inc.Meta Platforms' stock price sits at $443.29, with a recent sharp downturn in the backdrop where shares plunged 10.6%. This movement reflects the market's knee-jerk reaction to an unforeseen catalyst, necessitating a deeper dive into the technicals to ascertain the next potential move.
Fibonacci Retracements:
The stock's rebound from the low of $414.50 aligns with the Fibonacci support level at 0.618, suggesting a natural buying zone. Traders should note the price's interaction with the 0.236 Fibonacci retracement level at $448.39, a breach of which may signal an upward trajectory toward the $446.43 zone, aligning with the recent peak.
EMA Analysis:
The Exponential Moving Averages (EMA) reveal a bearish crossover, with the 20-day EMA ($452.36) descending through the 50-day ($470.84) and 100-day ($484.18) EMAs. A watchful eye on these levels is critical, as a break above the 20-day EMA may invalidate the bearish signal, possibly propelling the price to the $450 resistance zone.
Ichimoku Cloud:
The Ichimoku Cloud presents a bearish outlook, with the price trading beneath the cloud. A potential bullish reversal is contingent upon the price eclipsing the cloud, positioned around $462.25, which could introduce a bullish bias.
Pivot Points:
Utilizing traditional pivot points, we detect immediate resistance at the monthly pivot line (P) at $513.27. The R1 and R2 resistance levels sit at $526.99 and $542.09, respectively. Support levels S1 at $501.30 and S2 at $490.71 should be monitored as potential areas for re-entry on pullbacks.
Technical Indicators:
RSI: The Relative Strength Index hovers around 36.79, indicating a potential oversold condition, which could prelude a price recovery.
MACD: The Moving Average Convergence Divergence trends upward with the histogram reflecting increasing bullish momentum.
Stochastic: The Stochastic indicator is neutral, suggesting that the stock is neither overbought nor oversold at current levels.
OBV: The On-Balance Volume shows significant buying volume, possibly foreshadowing an upcoming rally.
Volume Analysis:
The volume spike on the recent sell-off is notable. Should the volume sustain above average with price recovery, it may validate the conviction behind the rebound.
Price Prediction:
We speculate a rebound target of $450 in the short term, should the stock maintain above the critical Fibonacci level. For a more extended play, the next target aligns with the 0.236 retracement at $448.39, with an ambitious target of $446.43, corresponding to recent highs.
Trading Strategy:
Entry: Consider long positions if the stock holds above the 0.618 Fibonacci level ($442.70), or on a breakout above the $448.39 level with substantial volume.
Exit: Traders may look to take profits at $450, with a secondary target at the recent high of $446.43. A stop-loss should be placed below the recent swing low around $414.50 to mitigate risk.
Risk Consideration:
Given the recent plunge, caution is warranted. Traders should be prepared for volatility, particularly with the next earnings report 88 days away. Fundamental aspects such as the company's P/E ratio of 25.35 and a modest dividend yield of 0.11% should factor into the overall analysis.
In summary, Meta Platforms presents a nuanced opportunity for technical traders. The recent price action juxtaposed with solid buying volume and oversold conditions lays the groundwork for potential upside. However, confirmation of trend reversal through technical indicator alignment is key to validating these speculative targets.
Caveat:
All speculation must be tempered with prudent risk management, and traders should adjust positions in light of unfolding market dynamics and broader economic indicators.
Wyckoff Distribution for META Elliot wave some gap that might be "runway gap" and "exhaustion gap"
But there are momentum divergence shown so it more likely to be "exhaustion gap"
for sentiment analysis
CEO of this company is selling all the way with 0 buying activity for 12 months straight
I have little worry about about upthrust that can touch SL so I have to set SL quite far
also yesterday have every high volume rejection candlestick |
I use it and OBV divergence as confirmation to short selling META with RR=2

Support for METALots of people saying sub $300. I don’t think so. Highlighting my support range here. Let’s see!

Don't shoot the Messenger, META is DEAD !Big megaphone pattern, noone uses facebook anymore, instagram is mid, earnings were trash, this stock is worthless, dump this thing to the netherrealms, hey maybe it recover and this broadening wedge becomes bullish you never know

META?
Hi all,
In my 2c opinion.
Nothing new, flat progress = over priced.
If it break trendline good time to sell & looking for other opportunity mean while.
let it slowly create discount and value.
All the best.


Meta bearish order block on 4/15/2024Indication to switch to short or put using order blocks strategy ( NASDAQ:META )

Waiting $META a bit more lowerVolume gap and monthly trendline suggesting a bounce between $400-350.
