MACY34 trade ideas

M LONG (Plans to Open Toys R US Stores)Macy's plans to open 400 Toys R Us shop-within-shops in its US department stores (#InceptionRetail).

$M Cloud Bounce Usually With ichimoku cloud bounces they always hit the hardest So we will be catching This bounce off the cloud with the options we have... going to play the influx of volatility move

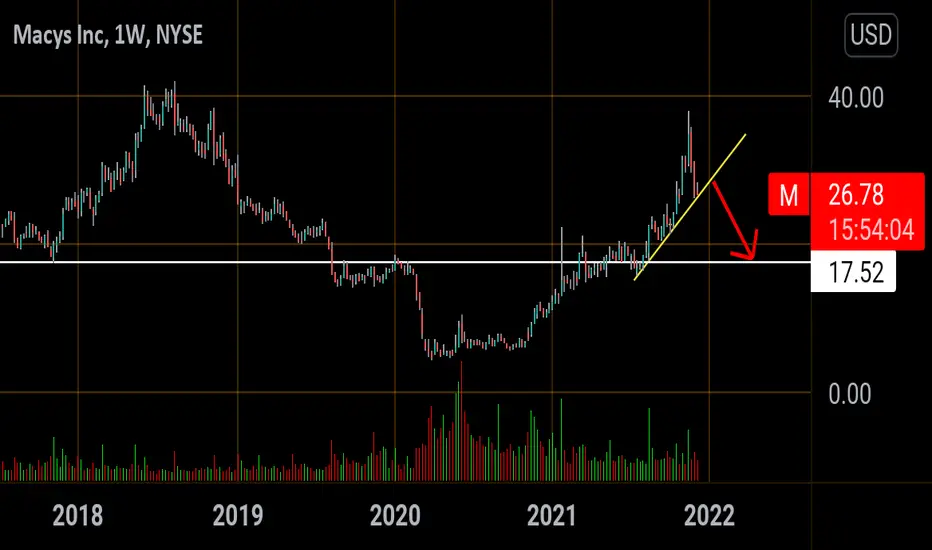
MACY headed back to Teens Depending on tomorrow's finish we may form 3 black crows on the weekly plus break uptrend (Yellowline). If we drop below 26$ that would be your short entry conformation.
Nice buying opportunity! Although i dont really like the industry Macy is in- price action and charts do not lie. Again, you can see a nice trend line. We are currently at a nice support with a lot of buying pressure down here. Combine that with the gaps up (91% of gaps always get filled, and we have TWO!)
I believe this is a great time to buy some kind of long position with a target first at $28.17. But then 29.55 and 29.90. Will most dip at 29.90 and then chop around a little before continuing to 31.30 and finally 32.30.
After these levels- we will see 33.00 and lastly 33.40. I would not get greedy beyond this target.
Great opportunity!

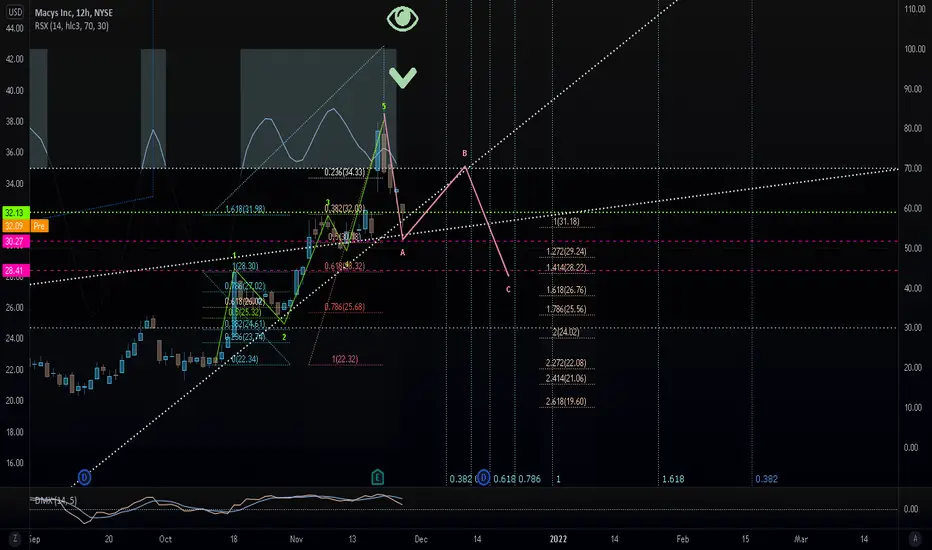
Lower lows in store for Macy's. MWe are sitting at the probable end of Wave A, at which stage we will move up somewhat, only to get back in negative motion for the final leg of the zigzag. So, this thing will go even lower, we just gotta wait.
We are not in the business of getting every prediction right, no one ever does and that is not the aim of the game. The Fibonacci targets are highlighted in purple with invalidation in red. Fibonacci goals, it is prudent to suggest, are nothing more than mere fractally evident and therefore statistically likely levels that the market will go to. Having said that, the market will always do what it wants and always has a mind of its own. Therefore, none of this is financial advice, so do your own research and rely only on your own analysis. Trading is a true one man sport. Good luck out there and stay safe!
#M Cup & Handle incomingGoing through my morning charting on trading view and i remember seeing #M on unusual whales pop up frequently and i glanced at the chart almost moved on to the next play and literally did a double look, but a cup is fully formed perfect on the one year one day and one year one week chart as you see in the image. It will be interesting to see if we can put a couple red days together this week to form the handle will be putting in some trades for mid Dec. to help myself with the Theta and to see if this comes to fruition it will be cheaper to pick up contracts on pull back days either way. Also their ecommerce business is also coming along form what i had read recently in either case this def makes for a play to go in your watch list, Fed is also supposed to make an announcement today which when that normally happens we have VERY RED days so i guess as they say the STARS ARE ALIGNING lol.

Macy's rocket ready for launch! LongHey Guys!
I see a good Long potential for M .
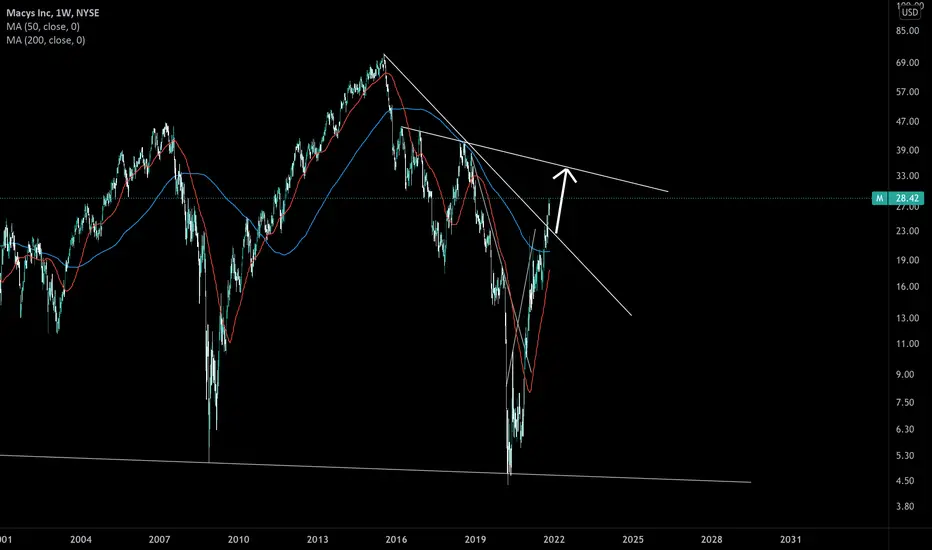
We are testing 50MA price zone on M-chart and looks like we are ready for break-out and push the price to 200MA on the Month chart.
Price stays very close to the 50MA for more than 5 months. - good sign for long. Also, we see a huge volume on the "bottom".
SL ~ 15-16$
TP1 200 MA on moth chart
TP2 40% zone.

Macys Bullish FlagCheck my prev post about $M for more details.
On D chart I see bullish flag. It can be a good spot for fast long trade. (+5-15%)
But be care with support line. If we broke it - it can be some down-trend on Dividends date.

MACY TWO LEGS UP ABC RALLY ENDED We now have a very long term head n shoulder top and a Large abc rally to which I AM NOW IN PUTS

M: Breakout of a 6-year-long down trend!This is a significant event for Macy's share holders. Macy's finally broke out for the first time in 6 years that started in July 2015. The significance of this breakout would make it a complex event and there should be a retest of this monthly trend line. The RSI is at the 70 level in the monthly chart. The volume has been decreasing since June 2020. All in all, there should be a retraction before the bull run toward 40. This chart shows the price should rise to 30 before going back to retest 22.80.

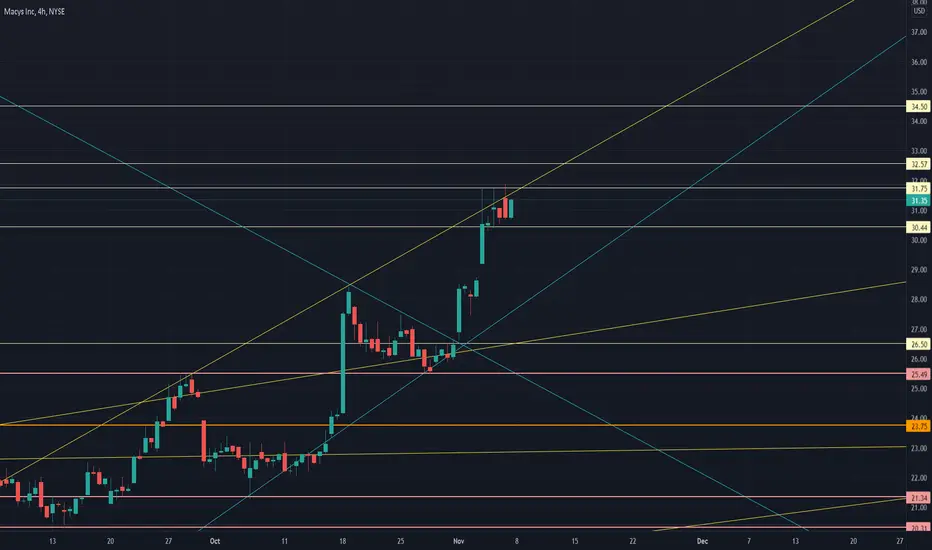
$M Macys the retirement Christmas trade30.44/31.75/32.57/34.50 are the support levels I can see a retracement happening back to 30s but this has a lot of room to breakout just in time for holiday season you don't' want to miss out!

The Long Term I was Referring to?Has been a long time since I purchased Macy’s. I am aiming to close 85% of my holding around $32, a decent gain from holding since 4.75. For more aggressive target, aim for 40ish.

$M starting to curl$M has strong recent history of bouncing off psychological levels. Bounced off $26 almost perfectly. Beginning to curl, looking for test of recent high this week.

Macys heading towards resistance Good rise for Macys today.
Heading towards 34 and could signal completion of the head as part of a large inverse H&S pattern. Wait and see?


Macys Double topI think this correction is appropriate considering they will rally for holidays.
Double top entry - 22.33
1st tp - 20. 29
2nd TP - gap close at 18.72

Short Macy's Rejected from daily RSI divergence.
Fell out of 1hour channel
Over bought on Bollinger bands on daily

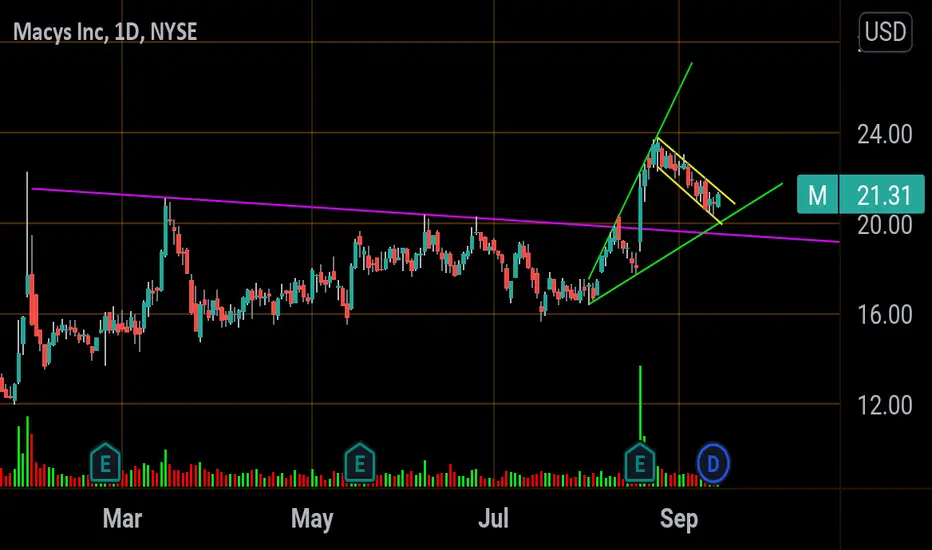
Macys looks ready for a 5% move The question is which direction?
Overall pattern is a bearish megaphone (Green lines)
Broke out of a 8 month consolidation (Purple line)
Now trading in a Bullish flag ( yellow lines)
Usually a breakout of consolidation would bring about a retest of that consolidation area. That retest would mean Macy doesnt break out of the bull flag tomorrow but falls back to support around 20.10.
Volume was average today but with Retail sales info coming out tomorrow that could be q catalyst for a breakout To fib resistance
1. 21.85
2.23.76
$M Macys Inc Trade Setup
Hopefully you find the chart helpful in terms of Supports & Resistance etc.
we refrain from adding commentary on the chart as that is reserved for our members and we are very conscious of not giving financial or trading advice.
Thank you for taking time to consult our chart and we would really appreciate a like, follow or comment.

<TradeVSA> MACY Breakout from VCP. Pullback Coming ?Sign of Strength in the chart:
1. Weekly Chart
- Green Pentagon from Re-accumulation
2. Daily Chart
- Breakout from VCP + Reaccumulation
- Turning to Red Pentagon with Potential 1st pullback
Disclaimer
This information only serves as reference information and does not constitute a buy or sell call. Conduct your own research and assessment before deciding to buy or sell any stock
