3M: Not far now! 🦅The 3M stock was able to undershoot the support at $92.38 in the past weeks. Now it is not far to the green target zone between $83.82 and $74.28, where we expect the low of the white wave (II). To capitalize on the expected change in direction, long positions can be opened within the zone. Stops should be placed about 1% below the zone, as a 36% likely alternative would still see a lower white wave alt.(II) low.
MMMC34 trade ideas

$MMM - looks attractiveNYSE:MMM With the earnings report scheduled for October 24, the stock recently rebounded from a support level. Notably, the MACD indicator exhibited a bullish crossover, and the RSI has exited the oversold region.
The risk-reward profile seems appealing at this point.
Potential Targets:
$93
$96
$105
Downside Risk:
$83
📈🚀💼

MMMNOW I am interested to introduce you this share ,,,,by sharp drop condition through 62-70usd it will bring my attention to long that .....dont forget this in your portfolio ....
Gooood Luuuuuck
MMM trade idea Symbol: MMM
Buy/Short: Long
Entry Date: 10/4/23
Stop: $70
Target: $110
Recommended % of Portfolio: 1.5% or less
NFA DYOR

3M Company LongMMM long position.
Market touched a lower Lin Reg and below MACD on H4.
Confirmation on H1 to take long position with 2 TP.
Tp1 at $103 and 2nd at $112.
SL at $97.14.
Warning!!!!
This content should not be interpreted as financial advice

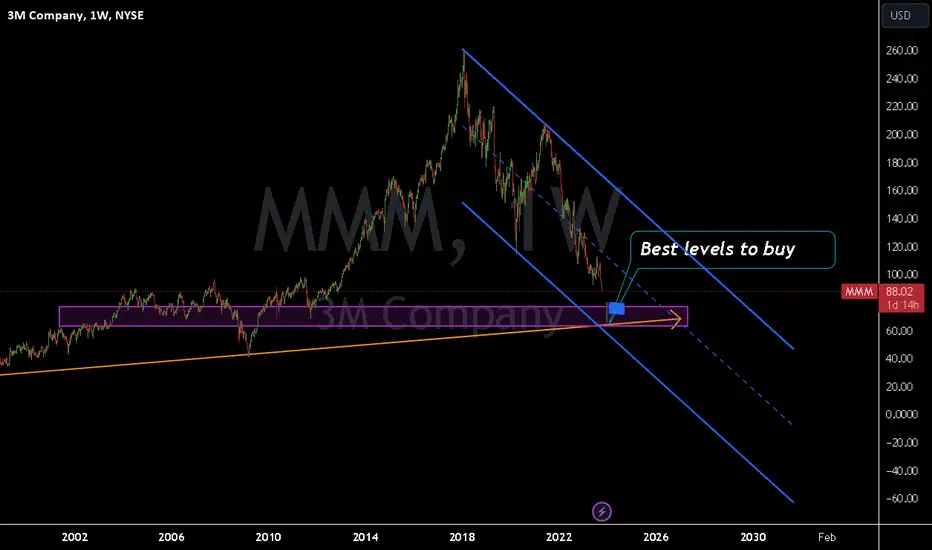
3M bounce off of 2011 levels?With the lawsuit finally settled for 3M, the base that 3M has been forming might finally play out.
Longer term position and play, RSI and MACD look good on the larger time scales. Stop below the lows.

MMM looking pretty tasty2M chart for MMM is flashing a macro bottoming signal. As you can see, if one were to buy each time it flashed, it wouldn't have been a bad trade. I thought it was interesting and thought I'd share.

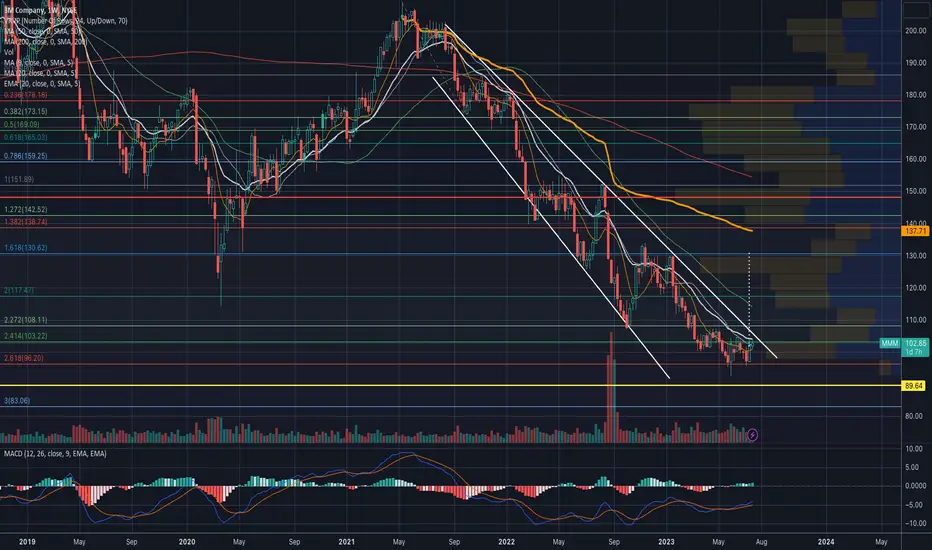
3M Company Is At Technical Support3M Company with ticker MMM has been trading bearish for the past 5 years, actually since the beginning of 2018, where we see a completed higher degree wave III.
The wave structure from 2018 highs is in three waves A-B-C, which indicates for a higher degree wave IV correction. We can now see it sitting at interesting 90 support area, especially if we consider equal wave length of waves A=C that stopped at the former wave 3 swing high resistance around that 90 area.
A recovery back above channel resistance line and 210 region would be definitely signal that higher degree wave V is in progress, which would send the price back to all-time highs.

$MMM - breaking out!NYSE:MMM Breaking out of the descending broadening wedge. Oscillators are in uptrend.
Targets:
- $120
- $130
Downside risk:
- $95
Follow me for more charts and trade ideas. 🚀

$MMM yieahhGet your post its ready. Good Risk vs Reward. Monthly RSI, MACD curling up.
Downtrend went on a clear A,B,C finding support close to the 78% fib marking a huge wave 2.
Wave 3 let me surf you with my jetpack yieahhh.

MMM Possible Wyckoff PatternMMM creating ST type bounces off of the $95 support area. Launching it into the Liquidity zone at $112. Rejecting that and pulling back towards the STs.
If it follows the rules could follow a similar path to the yellow arrow. Currently this Thesis is supported by an ongoing Weekly Classic Bullish Divergence and potential Daily Hidden Bullish Divergence so far.
Recently solving thousands of courts at once, 3M knows what they're doing and I believe Mike Roman is capable enough to turn business back around.

MMM coming to important demand zonethis demand zone at 104.85 broke significant weekly supply zone. look for long at 104.85 .
target would be around 125
DYOR before investing

MMM LongEarning 4/25/2023 (Positive)
Price near monthly support
buy 103.5
Stop 99.5
Target 112, 124
Risk management is much more important than a good entry point.
I am not a PRO trader.
In my trading plan, the Max Risk of each short term trade should be less than 1% of an account.
BuyToOpen 2023 Aug Call butterfly C110/130/150
Limit 2.70

MMM BUYHello, according to my analysis of 3M stock. There is a wonderful investment opportunity. The stock broke the downward trend. The strong resistance at 107 was broken. Also, a very positive green candle formed on the daily time frame. Indicates a strong entry of buyers. good luck for everbody

New LogoAs you all have probably seen, we have changed our logo and name! Shortly, we will go online with our website on which were are going to provide you with free daily market updates - more than one per day.
But for the time being, let us look at the 3M chart where we can see an increasingly strong bullish impulse. It is important that the pressure is kept high until we confidently cross the resistance at $117.80. There, we should see a small setback, before the bulls take over again. It is important that the course remains above $92.38.

MMM 3M Company Options Ahead of EarningsIf you haven`t bought MMM here:
Then analyzing the options chain and chart patterns of MMM 3M Company prior to the earnings report this week,
I would consider purchasing the 105usd strike price Calls with
an expiration date of 2023-8-18,
for a premium of approximately $2.93.
If these options prove to be profitable prior to the earnings release, I would sell at least half of them.
Looking forward to read your opinion about it.

3M - Bullish ZoneAs per technical analysis, the 3M can be touch $116, and if it's break and close above $116 then next target will be $120

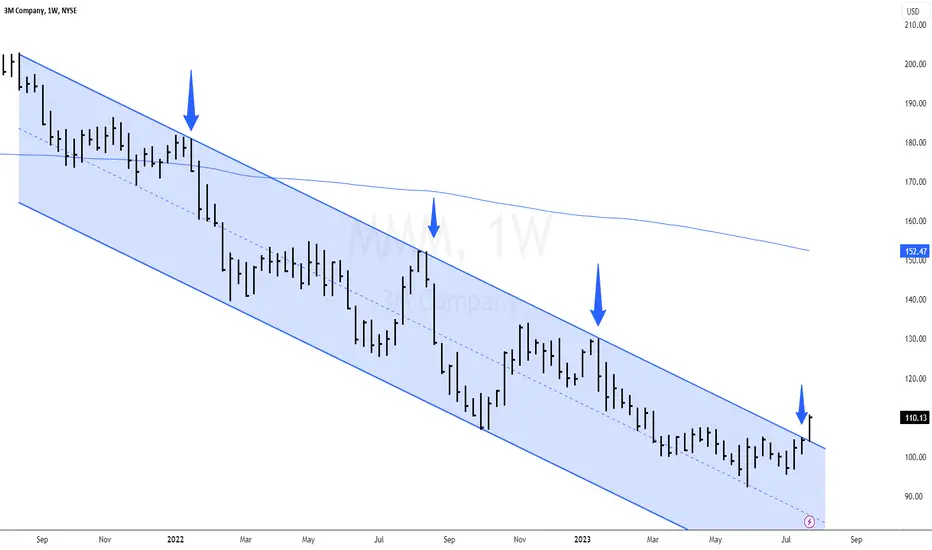
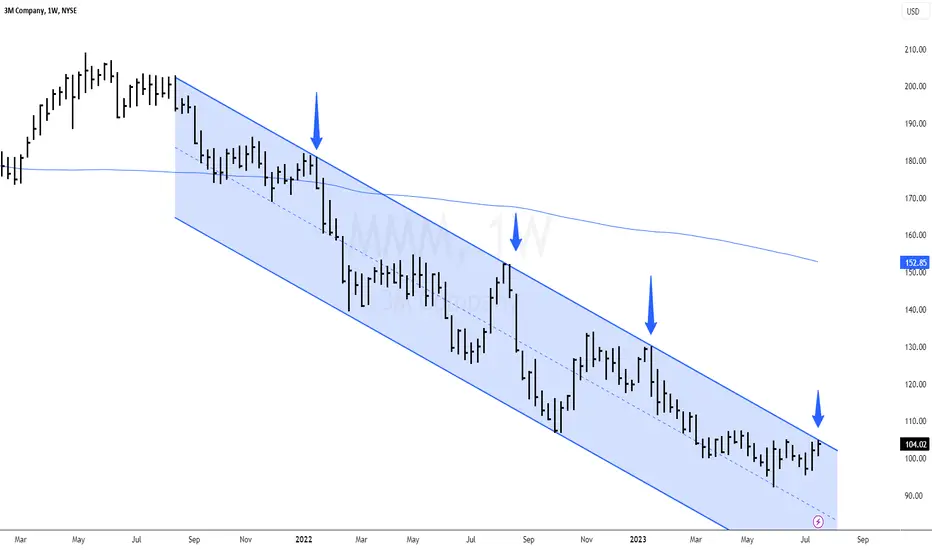
$MMM Update Parallel Trend Break OutNYSE:MMM Update Parallel Trend Break Out. One of my favorite trades this month was NYSE:MMM breaking out. This stock is a long term play. We also have a algorithm buy alert.
Excellent Opportunity in MMM above 107.05Possible trendline breakout in MMM. It may move upward as depicted on the chart if it crosses 107.05 and trades above this level for 15 to 30 minutes.

3M - BULLISH SCENARIOOver the last month, the shares of 3M Company, known for producing post-it notes, industrial coatings, and ceramics, have shown a modest return of +0.7%.
While media reports or rumors about substantial changes in a company's business prospects can cause short-term trends and immediate price fluctuations, the ultimate decision to buy and hold a stock is often driven by fundamental factors. For 3M, analysts expect earnings of $1.65 per share for the current quarter, reflecting a year-over-year decrease of -33.5%. The consensus earnings estimate for the current fiscal year is $8.73, indicating a year-over-year change of -13.6%. This estimate has seen a slight decline of -0.1% over the past 30 days.
Looking ahead to the next fiscal year, the consensus earnings estimate is $9.54, projecting a growth of +9.4% compared to the previous year's earnings for 3M. This estimate has increased by +0.3% in the last month.
While earnings growth is a crucial financial indicator, sustainable growth in revenue is equally vital for a company's financial health. Without an increase in revenues over time, it becomes challenging for a company to maintain earnings growth. Therefore, understanding a company's potential revenue growth is essential.
For 3M, the consensus sales estimate for the current quarter is $7.95 billion, implying a year-over-year change of -8.6%. The estimates for the current and next fiscal years stand at $32.11 billion and $33.35 billion, respectively, representing changes of -6.2% and +3.8%.
Risk Disclosure: Trading Foreign Exchange (Forex) and Contracts of Difference (CFD's) carries a high level of risk. By registering and signing up, any client affirms their understanding of their own personal accountability for all transactions performed within their account and recognizes the risks associated with trading on such markets and on such sites. Furthermore, one understands that the company carries zero influence over transactions, markets, and trading signals, therefore, cannot be held liable nor guarantee any profits or losses.

$MMM Parallel Down Trend About To Reverse NYSE:MMM Parallel Down Trend About To Reverse? As this bull market progress you get sector rotation. For example profit taking in big Tech stocks. I have seen that consistently since this bull market started back in 10-13-2022, here is an example of a consumer products stock that pays a nice dividend yield.
A bearish to bullish reversal is a technical analysis pattern that occurs when the price of a stock or other asset moves from a downtrend to an uptrend. This can be a sign that the market is about to change direction and start moving higher.
$MMM - what will it be?NYSE:MMM looks to be basing inside the descending broadening wedge. There is an overhang of hearing lawsuit. It looks like a coil spring ready to release. If the lawsuit is favorable to 3M, the stock can bounce to $130. On the other hand if the lawsuit went south, it can go to $83.👀ing. No position.