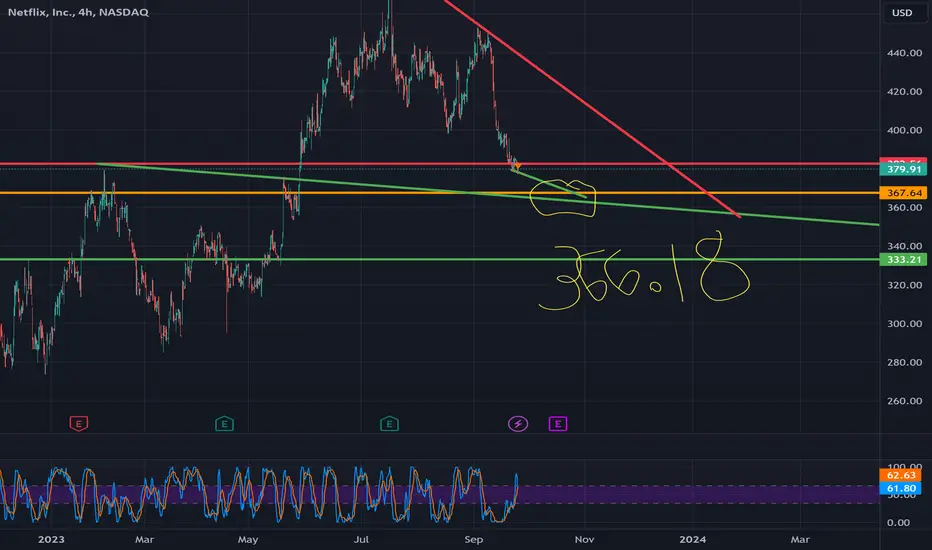
netflix approaching a big jumping pointHoly smokes, this is lining up for one huge final pump. If she holds 365, there is potential to rocket all the way up to 436. It won't be in 1 night, you'll have time to buy and sell, but it won't be a lot of time. You'll likely start seeing big AH movements, and a bunch of solid green days in a row as it climbs.
There is a chance it breaks down to 333, but again, there should be time to exit and reset your trade before it gets all the way down there. I would favor the upside pretty heavily on this trade, however, WAIT until it bounces off trend. If it hits the red trend, enter short on the rejection. If it climbs down and hits the green, go long on the support bounce.
NFLX34 trade ideas
NFLX-SELL strategy 4-hourlyLet's be honest here. The move up was extreme, and now the pattern starts looking weak. We are starting to be overdone, and for that reason a SELL may be the way to go.
Strategy SELL @ 433.00-437.00 and place SL @ 452.00. Profit order @ 431.50.

NFLX retesting broken trend + (M)MA50Typical pattern, longer trend broken, NFLX dropped 80% from its peak and now full retest to the trend. (M)MA50 is important MA, so far market retested broken trend and dropped below (M)MA50 which is 412$. Looks like "dead-cat" bounce.

The Netflix: Streaming The Stock's PotentialKEY POINTS
a. Netflix now has 15 million subscribers in its ad-supported tier.
b. The company is also rolling out new ad products.
c. The success of the new subscription tier is just one of the reasons the stock has surged this year.
The leading streamer just hit a key milestone with its ad business.
Netflix (NFLX 1.80%) was one of the best-performing stocks of the 2010s, but for much of the current decade, the once-meteoric growth stock has struggled to achieve liftoff.
The company got a temporary boost from the pandemic, only to give it all back and then some when the economy reopened in 2022, and it lost subscribers two quarters in a row. Since then, the streaming leader has regrouped, launching initiatives that some investors had long asked for, such as adding an ad-supported tier and cracking down on password sharing.
The results of those moves have been overwhelmingly successful with the stock up 47% year to date, even as many of its streaming peers like Disney and Warner Bros. Discovery are trading near 52-week lows.
With the help of paid sharing, Netflix has added nearly 15 million new subscribers over the last two quarters, beating its total additions from the previous five quarters. The stock jumped following the third-quarter earnings report in October on strong subscriber growth as well.
Building on this recent momentum, Netflix provided an update Wednesday that shows its new ad-based strategy is paying off.
A key milestone
It's been one year since the company launched its ad-supported tier in a handful of its biggest markets, and the company said the new service has now signed up 15 million subscribers, up from just 5 million in May. That news should not only tamp down concerns that growth from this tier has been weaker than expected but also show that the ad-supported option is clearly resonating with subscribers. Additionally, it's impressive to see those gains coming at a time when much of the digital advertising industry is struggling.
That figure represents more than half of net subscriber additions over the last year, though some of the ad-tier subscribers likely traded down from the more expensive ad-free tiers, especially after Netflix just raised prices on some of its plans in the U.S., U.K., and France.
Netflix has also refined its advertising product since launch and now offers five different ad lengths, ranging from 10 seconds to 60 seconds. It also offers targeting to mobile devices as well as options like more genres, time of day, and new audience demographics. Downloads are expected to be available by the end of the week, making Netflix the only ad-supported streamer to offer downloads.
The company has more new features planned for next year, including a binge-watching bonus that gives ad-tier subscribers an ad-free episode after they've watched three episodes in a row. It will also begin offering QR codes in ads and is expanding its partnerships program globally, allowing advertisers to sponsor certain shows.
Netflix's ad-supported tier may cannibalize some ad-free subscribers, but that's part of the company's strategy. Offering ads gives it cover to raise prices on ad-free tiers, as it just did, allowing the company to make more money from the ad-free side of the business (with the idea that the ad-supported tier should be revenue-neutral compared to the ad-free subscription, as it has been for Hulu).
The ad-tier option also capitalizes on massive existing demand from advertisers. As former CEO Reed Hastings noted in an Oct. 2022 earnings call, advertisers have been left behind by the transition to streaming and are anxious to follow the eyeballs that have already gravitated over to streaming services.
With more than 200 million subscribers globally, intimate knowledge of their viewing habits, and the ability to perform precise targeting, Netflix can offer advertisers much more than a traditional linear TV platform.
Why it's a buy
A little more than a year ago, investors seemed to think the growth story at Netflix was over. However, the recent rebound and strength from paid sharing and advertising shows the streamer's second act is well underway.
The company forecast subscriber additions of around 9 million in the current quarter, showing the recent momentum should continue, and its subscription business model means that incremental revenue flows through to the bottom line. Indeed, management sees operating margin improving from 20% this year to 22% to 23% in 2024.
If Netflix can continue to deliver subscriber growth, there's room for profits to go significantly higher. The success of the ad-supported tier will only make that easier.
NFLX SELL +++NFLX SELL $440 to $450 or ADD here. Should retest support of $411 in coming two weeks or so

[EN] Netflix at all-time highs // GaliortiTrading NASDAQ:NFLX in late July attacked the 61.8% Fibonacci of the entire previous decline since November 2021 . It pulled back to its liquidity zone between $370-385 from which it has made a new impulse. Final target: new all-time highs .
1 M
On a long term chart we note that NASDAQ:NFLX in July 2022 rested on its bullish trendline to develop a new bullish leg . Its final target for the next few years would be around $2,000.
1 W
In the shorter term on a weekly chart we observe that NASDAQ:NFLX is developing a symmetrical triangle that is highly likely to break to the upside . The minimum target for such a breakout would take it to around $580 . It should be remembered that the first obstacle after that breakout will be the 61.8% Fibonacci ($492) so it is likely to make a pull-back to the breakout line. In addition, the bearish gap from the end of July will be a resistance to be taken into account.
The 470-495$ is a great liquidity zone that will allow it to perform a new bullish wave with a first target at 580$ (target of the broken triangle) and a second target at new all-time highs.
1 D
The company's third quarter results have led to a large bullish gap with a large volume (the second largest of the year), this translates a great strength as demonstrated by the verticality of the rise. It is logical that in the coming days there could be a correction as prices hit the medium-term downtrend line . It will be a healthy and necessary correction to develop a new momentum that will allow it to definitively leave the 61.8% Fibonacci level .
Pablo G.

Flix... NetflixPrice is consolidating in a narrow range and forming a wedge pattern.
Trend deciding zone is 418 - 422. Above this zone price can gain momentum.
Where to buy?
Buy above 414 with the stop loss of 410 for the targets 418, 422, 426 and 430.
Where to sell?
If price did not gain bullish strength, sell below 406 with the stop loss of 410 for the targets 402, 398, 394 and 390.
As of now price is in neutral zone. Do your own research before taking any position.

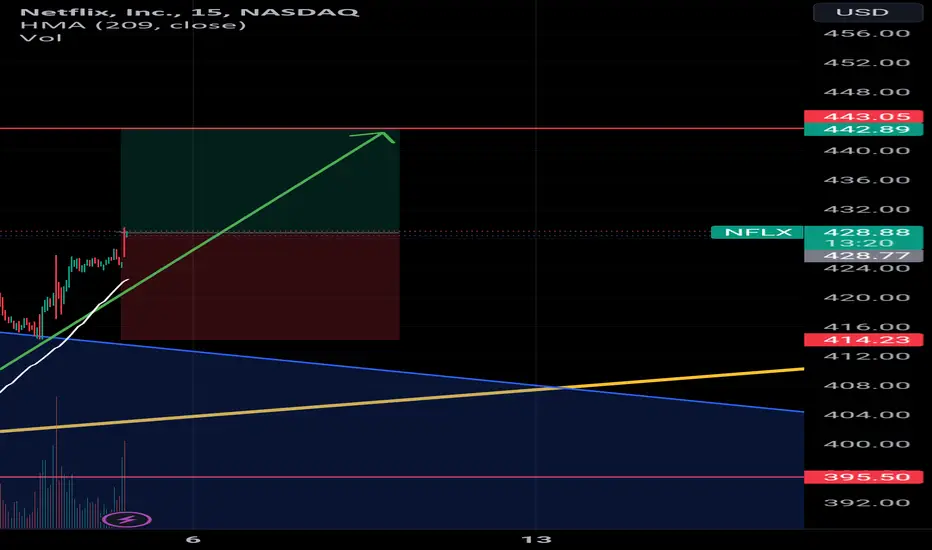
Long Signal on NITFLIX _15MinHello enveryone,
We have a good Signal to short on NITFLIX for a short term investement, with a target of 443$,
Best regards
NFLX Long Term OutlookIf the awaited recession comes into play, this could be a possible scenario for Netflix.
Remember that this is a long term view.
Trade Safe!

Netflix in a fall, unless it breaks the channelAn unlikely winner in the current recession, Netflix could continue a trend down unless it breaks out the trend channel within the remainder of October. Despite promising results earlier this week, Netflix bounced on the channel's upper edge. Now this could be only a resolution of a few targetted positions by a few traders aware of the channel, but if the trend isn't broken within the next five days, or the price comes back to the PEG ground, the downtrend of Netflix will continue.

Netflix Consolidates After Earnings Surge Netflix jumped earlier this month after announcing results. It’s now consolidating, and some traders may see potential for more upside.
The first pattern on today’s chart is the bullish gap on October 19 following the quarterly report. Prices cleared a peak of $394.90 from two weeks prior and have remained there since. Has old resistance become new support?
Second, that level is near the 50-day simple moving average (SMA).
Third, NFLX is now trying to form a bullish inside week. That could indicate the stock is digesting its gains and consolidating.
Next you have the falling trendlines along the peaks of July and September. Traders could be watching for a breakout through this resistance.
Short-term indicators may also have gotten more bullish: The 8-day exponential moving average (EMA) is above the 21-day EMA, and MACD is rising.
Last, the fundamental case may have improved because NFLX entered earnings season under a cloud of negativity. It then shocked the bears with strong subscriber growth, making it a potential turnaround story.
TradeStation has, for decades, advanced the trading industry, providing access to stocks, options, futures and cryptocurrencies. See our Overview for more.
Important Information
TradeStation Securities, Inc., TradeStation Crypto, Inc., and TradeStation Technologies, Inc. are each wholly owned subsidiaries of TradeStation Group, Inc., all operating, and providing products and services, under the TradeStation brand and trademark. TradeStation Crypto, Inc. offers to self-directed investors and traders cryptocurrency brokerage services. It is neither licensed with the SEC or the CFTC nor is it a Member of NFA. When applying for, or purchasing, accounts, subscriptions, products, and services, it is important that you know which company you will be dealing with. Please click here for further important information explaining what this means.
This content is for informational and educational purposes only. This is not a recommendation regarding any investment or investment strategy. Any opinions expressed herein are those of the author and do not represent the views or opinions of TradeStation or any of its affiliates.
Investing involves risks. Past performance, whether actual or indicated by historical tests of strategies, is no guarantee of future performance or success. There is a possibility that you may sustain a loss equal to or greater than your entire investment regardless of which asset class you trade (equities, options, futures, or digital assets); therefore, you should not invest or risk money that you cannot afford to lose. Before trading any asset class, first read the relevant risk disclosure statements on the Important Documents page, found here: www.tradestation.com .

NETFLIX Can it realistically reach $600 in this environment?Netflix (NFLX) has established itself above the 1D MA50 (blue trend-line) since the aggressive price jump of October 19 on its bullish earnings. Still, the price is failing to break above the top (Lower Highs trend-line) of the blue Channel Down and technically the longer it fails to do so, the higher the chances become of a rejection. Until that happens, we can see that during similar 1D MA50 consolidations after price jumps in the recent past, Netflix rallied more. Now it has the 1W MA100 (red trend-line) as its long-term Support, hence a potential new rally can be even stronger.
The previous 3 medium-term rallies have hit (or marginally missed) the 2.0 Fibonacci extension, so that is our target in case the price breaks above the top of the Channel Down. $600 is technically fair as it is on the Higher Highs trend-line of the Bullish Megaphone. Time-wise, this target is achievable by January 2024 as this is what the Sine Waves suggest. As you can see all 3 previous Higher Highs have been within the peak spectrum of the Sine Wave.
-------------------------------------------------------------------------------
** Please LIKE 👍, FOLLOW ✅, SHARE 🙌 and COMMENT ✍ if you enjoy this idea! Also share your ideas and charts in the comments section below! This is best way to keep it relevant, support us, keep the content here free and allow the idea to reach as many people as possible. **
-------------------------------------------------------------------------------
💸💸💸💸💸💸
👇 👇 👇 👇 👇 👇

Netflix Q3 EarningsNFLX Q3 September 2023 earnings are on Wednesday 10/18/23 at 4pm. Netflix (NFLX) reported earnings of 3.29 per share on revenue of 8.19 billion for the second quarter ended June 2023. The consensus earnings estimate was 2.83 per share on revenue of 8.27 billion. The company beat expectations by 13.84% while revenue grew 2.72% on a year-over-year basis. The company said it expects third quarter earnings of approximately 3.52 per share on revenue of approximately 8.52 billion. I'm posting this as a long because of the setup with NFLX price at its VWMA200 level.
Q3 September 2023 Consensus:
EPS = 3.47
Revenue: 8.43B
VWMA 50 = 409.41
VWMA100 = 417.44
VWMA200 = 369.33
YTD anchored VWAP = 374.60
TTCATR20:
R3 = 424.27
VWMA20 = 385.69
S3 = 347.10
Options data:
10/20 expiry
Put Volume Total 14,812
Call Volume Total 15,144
Put/Call Volume Ratio 0.98
Put Open Interest Total 82,510
Call Open Interest Total 67,499
Put/Call Open Interest Ratio 1.22
highest open interest call strike = 390
highest volume call strike = 370
highest open interest put strike = 350
highest volume put strike = 365

Netflix: Bearish Crab with Bearish ConfirmationNetflix recently traded just above the HOP level of a Bearish crab and has since gapped down below the 1.618 PCZ and given us a Bearish Divergence on all Oscillators as well as PPO Circle Confirmation. We could see Netflix begin a full retrace of the Harmonic range from here.

Netflix Surges 16% Post Earnings!Netflix's stock surged 16% due to a 70% spike in subscribers for its new ad-supported tier, adding over 8 million users.
This pushed the global subscriber count to 247 million, marking the largest growth since Q2 2020, a period influenced by pandemic-driven home entertainment demand.
Financially, Q3 earnings exceeded expectations: projected at $3.49, they reached $3.73.
Although the stock previously neared a concerning $300, positive earnings pushed it back up past the $400 level.
Yet, a challenge remains: breaking the $423 resistance level from June 2018.
Still, with a 7% rise in October and a 37% annual increase, the outlook remains optimistic.

$NFLX TIME TO STOP HEREI believe this was enough of a rally for Netflix and we should start seeing more selling pressure.
62% Fib along with a resistance zone makes me feel Netflix will be back at 400 soon.


Earnings Glory and Quiet Storms: Netflix's Path ForwardNetflix has experienced a remarkable surge in subscriber growth attributed to its proactive measures to curtail password sharing and the introduction of a new ad-supported subscription tier. In the third quarter, the global streaming juggernaut welcomed an impressive 8.76 million new subscribers, significantly outpacing Wall Street's conservative estimate of 5.49 million. This milestone represents the most substantial quarterly increase since the second quarter of 2020, a period marked by a surge in subscriptions due to the COVID-19 pandemic.
In terms of financial performance, the results for this quarter are as follows:
1- Earnings: Netflix achieved earnings of $3.73 per share, surpassing the projected figure of $3.49 per share (as per LSEG, formerly known as Refinitiv).
2- Revenue: The company generated revenue of $8.54 billion, aligning precisely with the expected figure of $8.54 billion (according to LSEG).
3- Total memberships: Netflix reported a total of 247.15 million memberships, exceeding the anticipated 243.88 million (according to Street Account).
Nonetheless, it is important to consider that there are underlying aspects that may not be immediately apparent to investors, but could impact the company's stock price in the future.
Firstly, Netflix's trailing twelve-month Price to Earnings (P/E) ratio currently stands at 38.19, which exceeds the historical average of approximately 15. This valuation places Netflix in the category of overvalued stocks, as investors are paying a premium compared to its earnings. Netflix's trailing twelve-month earnings per share (EPS) of 9.39 may not fully justify its current market valuation. It is important to note that trailing P/E ratios may not account for a company's projected growth rate, which can lead to elevated P/E ratios driven by expectations of substantial future growth, even if current earnings appear low.
Further, Netflix boasts a 12-month forward Price to Earnings Growth (PEG) ratio of 1.36. This suggests that the market is currently valuing Netflix above its expected growth potential, given that a PEG ratio above the fair market value of 1 indicates overvaluation. The PEG ratio of 9.39 is calculated by dividing its forward price to earnings ratio by its growth rate. PEG ratios are a widely used valuation metric, as they consider various fundamental metrics and prioritize the firm's future rather than its past performance. The combination of these valuation metrics paints a somewhat unfavorable picture for Netflix at its current market price, due to an overvalued PEG ratio despite robust growth.
Furthermore, Netflix recently implemented price hikes for its services, with the basic subscription rate in the UK rising by £1 to £7.99 and the premium option increasing by £2 to £17.99. Similarly, premium plans in the US and France experienced price increases of $3 and €2, respectively. While these adjustments are indicative of the company's growing confidence, they come at a time when Netflix is confronting concerns about its ability to continually attract new members amidst mounting competition, escalating prices, and disruptions caused by a Hollywood strike.
It is worth noting that in a landscape of intensifying competition and Netflix's imposition of increased constraints on its subscribers, such as price hikes and sharing limitations, there is the potential for adverse implications on future subscriber growth.
From a technical standpoint, Netflix's price chart illustrates the completion of five upward waves within an ascending channel, with a subsequent breakage and retesting of the channel. This retest has generated a considerable price gap that suggests a likelihood of retracement to fill the gap. Should this scenario unfold as anticipated, there is a possibility that prices may revert to prior lows, particularly around the 61.8% Fibonacci Retracement level at approximately $286.00. A breach of this level could precipitate a further decline, potentially revisiting the initial channel starting point at $170.00.
I encourage you to delve into my other analyses, as they provide valuable insights into the broader economic landscape. By combining these analyses, you'll gain a clearer understanding of what's on the horizon.
Your commitment to assessing multiple viewpoints is a commendable approach to informed decision-making in the complex world of financial markets.
Goodluck!

Positive Earnings Gaps Seldom Fill: NFLXTo follow up on my analysis of NFLX from Wednesday ...
Despite the market moodiness and selling, NASDAQ:NFLX reported well above estimates.
HFTs triggered a huge gap up on heavy pre-open order flow yesterday. Volume was also huge, so smaller funds' VWAPs triggered and retail traders chased the stock while Pro Traders and HFTs made some big profits.
Gaps up on positive earnings seldom fill completely. There is a strong support level at $350 which the gap up now confirms.

ANOTHER SCENARIOThere are 2 patterns I see, the bat and a head and shoulders. I hate to contradict myself but I see it )o; This could have been a Head and
Shoulders pattern that did not make a 100% fall which is not unusual. This pattern can fall more or less than 100 percent.
The 2 spinning tops are sitting on the prior neckline so I turned this level blue versus green as it has been recently broken.
The prior fall from the possible neckline hit between the .618 and the .786 before reversing up. This would mean it hit T2 and almost hit T3 (.786) on the last descent.
H&S is bearish versus a Bullish Bat pattern.
Time will tell and one or the other pattern will play out. it is possible the H&S fall is complete. The H&S can break back above the neckline as no pattern lasts forever and patterns continually morph.
Nothing in the market is written in stone and anything can happen.
Change is the only thing that never changes )o:
No recommendation

BATBullish Bat as most M patterns are bullish meaning they reverse on the 4th leg which is down.
The first leg is Up. Peak 2 s lower than peak 1.
This did not quite hit the .886 but still very close. News popped this early and there was also a very small gap that acted as support.
Price is at a horizontal resistance level and 2 spinning tops are struggling at this level. Spinning top candles represent indecsion. Price must surpass this level to hit above targets.
No recommendaton

NFLX To Reverse Its Course Soon After forming a 1-2-3-4-5 Motive Wave, NFLX is forming an A-B-C Corrective Wave. Currently, NFLX is in C wave of this Corrective Wave.
C wave retraces 100 percent of A wave of A-B-C Corrective Wave. In this C wave, waves 1 and 2 have formed and wave 3 is under formation.
The spike after recent earnings is a short pull back in wave 3.

NFLX, BUY, 16.91% PROFITBought NASDAQ:NFLX on 10/18/2023 at market close and closed position on 10/19/2023 at market open. Net 16.91% profit.
