PH - on watch for bullish movePH is breaking a wedge pattern to the upside.
This play looks promising to continue to move higher.
The only risk is earnings coming up and its a lighter volume name....
Watching for continuation move to go long after earnings.
P1HC34 trade ideas

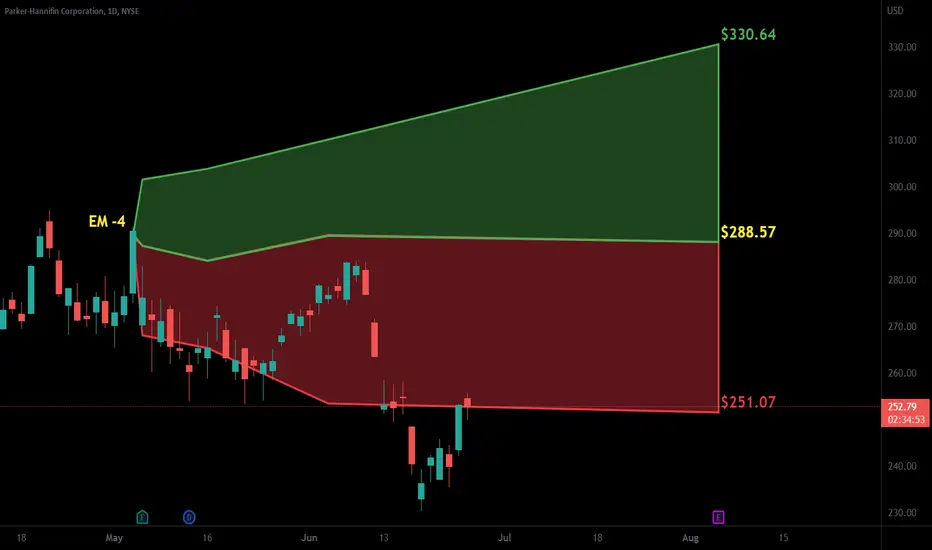
$PH with a Bullish outlook following its earnings #Stocks The PEAD projected a bullish outlook for $PH after a Positive under reaction following its earnings release placing the stock in drift A with an expected accuracy of 88.89%.

$PH with a Neutral outlook following its earnings #Stocks The PEAD projected a Neutral outlook for $PH after a Negative over reaction following its earnings release placing the stock in drift C with an expected accuracy of 100%.
PH $PH High-risk Initial LongPH High-risk Initial Long. SL and TP on chart. 10-20x leverage. Move SL on TP.

PH had a strong earnings gap up!* Great earnings
* Very strong up trend
* High relative strength in the Industrial sector
* Broke out of a ~7 month consolidation period with very high volume (162.6% above average)
Note:
With very high volume on earnings, this very well may be a break away gap and may continue going higher from here.
Trade Idea:
* You can enter now and ride higher.
* Or you can look for buying opportunities near the $321.65 area
* A daily close below $321.65 would expose $311.70 as the next key support which should hold firmly.

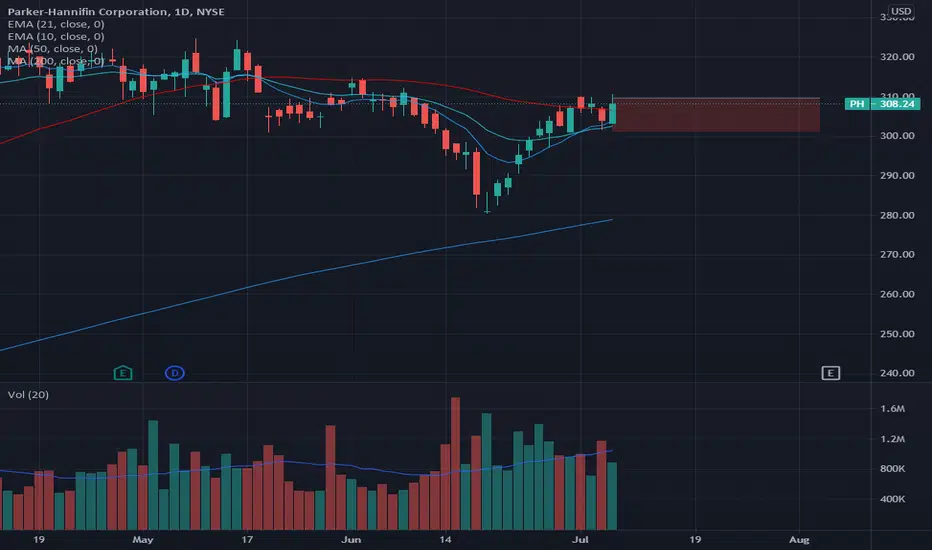
PH, Longed but I suggest trading as a wick play I took a position in PH in the late morning today with a stop under the 50 ma.
I like it because there is ample evidence of insiders going on a buying spree with buying starting around June 14 ( note the initial stopping volume start to come in around then). And for the most part, volume tells us accumulation has kept up pretty consistently from June 14th to date. So this definitely has the holders and smart money behind it . I think that will help to sustain the move but we did close with some weakness today , displayed by upper wick of todays candle.
I was long prior to this upside wick developing, but based on the new evidence, I think that this would be best entered as a wick play . If we are able to open in the upper wick of todays candle tomorrow that is ... then we will have an early sign to support likelihood of support for moves up higher . In any case , at this point the 50 ma is an important line in the sand for me .
PH 6 tap breakoutPH has tested the 321 area now 6 times, with each test taking out supply at the resistance level. The aerospace sector looks poised for a breakout as well. I expect this to breakout here soon to the 335 area, above 324 is all time highs.

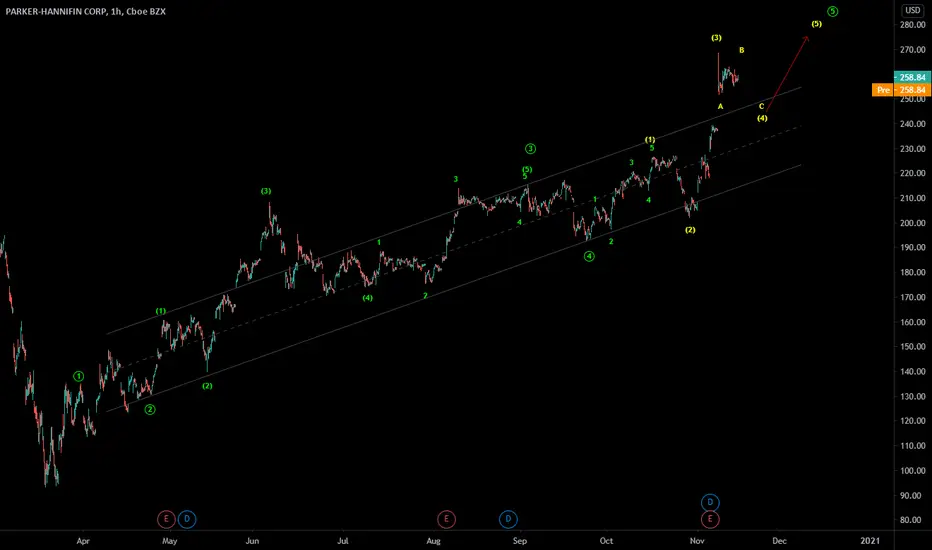
PH - Elliottwave analysis - 5th wave upPH - It is in impulse cycle from major low in chart in 4 hr time frame. It is correcting in 4th subwave of 5th wave up and good buy zone near 250 or little lower for the target of new high above 275.
Give thumbs up if you really like the trade idea.

PAY to PAKER-HANNIFIN CORP DailyHey my friends, PAKER-HANNIFIN CORP is in a bullish continuation, strong buying volume it is located on a strong trend support. It is very plausible that we break the fibonnaci with power, to go up on the second precedent above and that we start again in the fall given the number of purchase volume before last sessions.
Please LIKE & FOLLOW, thank you!

PH FlagPH is about to breakout of its consolidation Flag. It had a run up, then has been consolidating over the past several weeks. It is now looking to breakout upward to the 190-195 range, with the moving averages trending upward underneath as well


PH Detected possible contract win!!!PH: parker-hannifin corp
2018-07-17 04:53:01
Detected possible contract win

$PH Weekly Chart - Setting up for a breakout buy -Recently published a daily chart for PH that shows a breakout buy setup.
RSI looks like it may come back to test its trend line. I would buy if RSI broke out along with Price action on heighted volume.
Personal Note----> Note that the RSI has not "reset". Will the potential break be of significance?
^If you are wondering what this means it is a long story. Something that I have begun to connect the dots with so to speak. When I figure it out and have a "concrete" answer to the "reset" phenomenon I have noticed in the past I will publish and education post.
Thank you for looking at this post. Plz like it if you agree :)
Blessings

Breakout Setup -RSI & MACD- $PHActually some decent characteristics coming together for this chart.
RSI has a top side resistance line that it is nearing. Today it closed at its "uniform action" line seen in the green. Look for a break of the green line first. This could be a level 1 entry. A level 2 entry on the top side resistance line break. Obviously we are looking for volume at the break.
^if it breaks top side resistance on the RSI expect it to also be breaking the price action resistance at the same time
MACD also giving a solid setup. About to break a trend line at the same time that it would also perform a zero crossing. This would be 2 signals in one and carries more weight than a single MACD signal.
Overall chart looks good.
Fundamentally the company has decent growth I know. As far as fundamental drivers for this I could not tell you. Its an industrial. S&P IQ has a positive outlook for the sector.

