A+ dip entry setup here!boost and follow for more ❤️🔥 very simple setup here on Paypal, holding above previous resistance which is now the new support since its last breakout.. Also holding above trend support zone from October 2023.
It could dip a bit more to 63-70 but I think a rally higher 90s and 100s should happen either way. 🎯
PYPL34 trade ideas

PYPL a Bright Spot in a Sea of RedPYPL may have begun a turnaround on Friday. It is teasing both the SMA 9 and SMA 300, with a possible gap fill beginning at around $82.69.
Meanwhile, XLF bounced off the SMA 140, which I like to use as a support level.

PYPL Long OpportunitySimple EWT in play -- finally retested the top of the previous lower range, finishing the formation of the broader inverse H&S pattern.
Will update with more fundamentals as I continue research, but feel the e-commerce competition is overblown and the company is generally undervalued.

$PYPL - potential inverse head and shouldersNASDAQ:PYPL broke below the buy area. Added more. It looks to be forming inverse head and shoulders.

ContinuationAny way you look at this, the chart looks insanely bullish.
The moves it has made in the arch looks a mirror to what it done throughout the years prior and gives me the impression we should see some aggressive moves upwards in the coming weeks. We can dip outside the arch as it has done that before, but it doesn't change its path. Lets hope it finds the momentum and reaches the Fibonacci target which is sitting in the 120-130 zone.
P.S:
Funnily enough, this is the exact same pattern as SQ (XYZ) so I will be doing a copy and paste as the direction potential is the same.

PYPL IS BEING PREPAREDI think the price will rise from the 65-67.5 price range. It is a nice range and we can see it as a test of the area it breaks. Although 75 is the first resistance, it should not bring much selling. After staying above 78, I expect a movement towards the 86 gap and the 110 region.

bullish retracement retracing to it's neckline, look to buy around 68$ - 65$ with a stop below 56 and a target of 120$

PYPL: Zone 2PayPal returning to the 40wk ma after a stage 1 breakout. In an early stage 2 chart, touches on the 40wk tend to be good times to buy.

pypl trend is your friendLong since 76
PayPal is a online payment method that follows you wherever you go. Pay any way you want. Link your credit cards to your PayPal Digital wallet, and when you want to pay, simply log in with your username and password and pick which one you want to use.

PayPal: We've been here before (?)August 2019, PYPL saw the same market structure as we see now (1:1). Market has currently dropped on weak payment transactions but the forecast and main figures remain strong.
Currently PYPL is trading with multiples below fintech's average with P/E 17 (sector 84), market price 100 USD (1:1 target) would make P/E about 22,5, which still makes sense in context of current tech valuations, that are often priced at significantly higher multiples.

Markup phase begun ?It seems like a massive accumulation phase has been completed in paypal and potentially a markup phase has begun. If an impulsive move has begun, then its a good trade to go long on a correction.

$PYPL PAYPAL’S FINANCIAL LANDSCAPE: VALUATION & OPPORTUNITIESPAYPAL’S FINANCIAL LANDSCAPE: VALUATION & OPPORTUNITIES
1/8
PayPal ( NASDAQ:PYPL ) has been on the move lately—announcing a FWB:15B buyback and posting mixed but intriguing earnings results. Let’s dive into what’s making this fintech giant tick! 💳💡
2/8 – Recent Revenue Growth
PayPal’s revenue soared during the digital payment boom but has moderated recently.
Although the exact figures aren’t in the latest posts, growth since 2017 is substantial.
Stabilization might indicate a new normal in digital payments.
3/8 – Earnings & Guidance
Some quarters saw EPS pop by 61%—pretty impressive! 🚀
Mixed guidance ahead: margin expansion concerns and flat-to-down cash flow.
The FWB:15B buyback suggests management sees long-term potential.
4/8 – Valuation vs. Peers
Forward P/E near 10, PEG ratio of 0.52—that’s cheap compared to Visa/Mastercard.
PayPal straddles fintech + payments, competing with everyone from Square ( SET:SQ ) to Apple Pay.
Lower growth vs. some peers, but strong operating margins help PayPal stay ahead.
5/8 – Risk Factors
1️⃣ Regulatory: New rules could cramp expansion.
2️⃣ Market Saturation: Need emerging markets to fuel next leg of growth.
3️⃣ Competition: Stripe, Apple Pay, & countless fintech upstarts.
4️⃣ Tech Disruption: Blockchain, AI, or next-gen payments could reshape the landscape.
6/8 What’s PayPal’s biggest near-term challenge?
1️⃣ Regulatory Hurdles
2️⃣ Competition
3️⃣ Market Saturation
4️⃣ Tech Disruption
Vote below! 🗳️👇
7/8 – SWOT/SCOT
Strengths: Massive user base, recognizable brand, buyback confidence.
Weaknesses: Slowing user growth, uncertain future margins.
Opportunities: Emerging markets, strategic partnerships, AI integration.
Threats: Fierce competition, cyber risks, evolving payment tech.
8/8 – Your Next Move?
PayPal’s at a pivot—undervalued or a value trap? 💰
Let’s see if NASDAQ:PYPL can keep up the momentum!
#PayPal #Fintech #DigitalPayments #PYPL #Investing #Earnings #Valuation #Finance

PYPL: Buy ideaOn PYPL as you can see on the chart, we would have a high probability of seeing the market go higher. This is explained by the fact that we have a red candle with a small body and a long wick which signals us to a possible rise in the market. In addition, this increase will be confirmed by the appearance of a large green candle accompanied by a large green volume which will cause the Vwap indicator to forcefully break, hence this upward trend.

PYPL : Another Dive or Finally Time to Buy?PayPal (PYPL) has been getting slapped around like a rookie in a heavyweight fight. The stock is now chilling above a thick support zone—right above the 50% and 61.8% Fibonacci retracement levels. Sounds like fancy chart talk, but all it really means is: This could be where the pain finally stops.
There's also an unfilled gap across multiple timeframes, and gaps like these tend to get filled at some point. If NASDAQ:PYPL keeps sliding, it might take out the previous quarterly low. Why does that matter? Because these lows act like a magnet, dragging price down just enough to shake out weak hands before launching higher. That’s when the selling pressure finally dies down. And the RSI? Almost in the basement—last time we saw this (November 2023), PYPL ripped higher shortly after.
My plan? Set alerts, watch closely, and pounce when the signs point to a reversal. I’m not about to catch a falling knife, but if this thing turns around, I sure as hell don’t want to be left behind.

Can AI Predict the Future of Payments?PayPal stands at the vanguard of the digital payment revolution, not merely as a facilitator but as an innovator through its strategic use of artificial intelligence (AI). This article delves into how PayPal is harnessing AI to redefine the parameters of financial transactions, challenging the reader to envision the future landscape of digital payments.
PayPal's integration of AI into its operational core has transformed it from a standard payment gateway to a leader in financial technology. By enhancing payment authorization rates and strengthening fraud prevention, PayPal leverages AI to predict and adapt to user behaviors and transaction patterns. This predictive capability ensures smoother, faster, and more secure transactions, pushing the boundaries of what was previously thought possible in digital payments.
The application of AI to improve payment authorization is particularly groundbreaking. Through sophisticated analysis of vast datasets, PayPal's AI models can predict declines, suggest retry strategies, and optimize transaction processing. This not only led to higher authorization rates but also improved user experience, prompting businesses and consumers to reconsider the effectiveness of digital transactions.
In the realm of fraud prevention, PayPal's AI-driven approach sets a new standard. By employing machine learning and graph technology, PayPal maps out transaction networks to spot anomalies in real-time, drastically reducing fraud while minimizing disruptions from false positives. This dual focus on security and user experience presents a compelling case for how technology can be both a guardian and a facilitator in the financial world, urging us to consider the balance between innovation and safety in our digital interactions.
PayPal's journey with AI doesn't just highlight its current capabilities but also signals its readiness for future challenges in the digital payment landscape. As we ponder the implications of such technological advancements, we are invited to explore how AI could further shape the economy, security, and daily financial interactions, making PayPal not just a leader today, but a visionary for tomorrow.

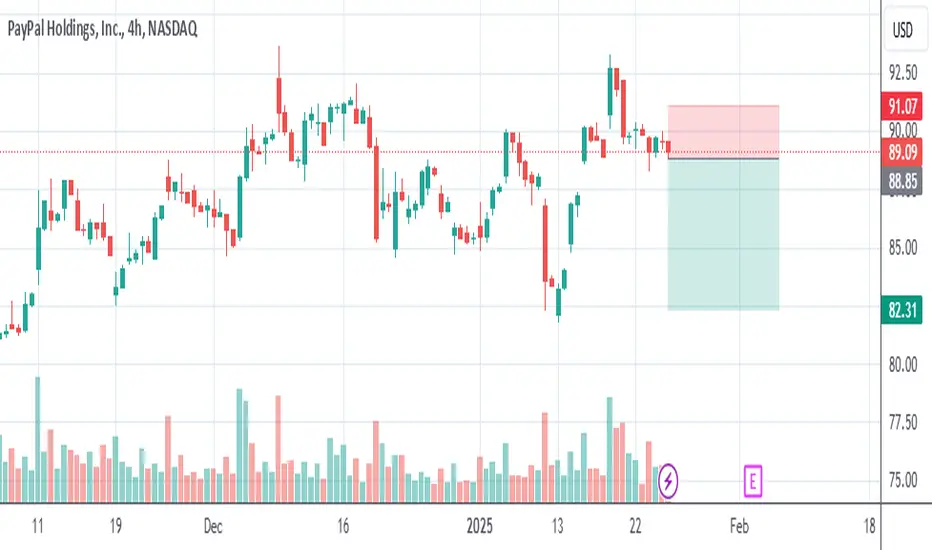
PYPL possible H&S patternIf stock fails retest of ~$89 mark, we could see the stock drop back to $85 and test support there. PYPL has already broken the trendline that started at $58 and reached as high as $94.

PayPal's Market Crossroads: Rebound or Further Downside?Is PayPal Ready for a Comeback? Key Levels to Watch Now
The digital payment giant PayPal (NASDAQ: PYPL) is at a crucial market intersection. Trading at $88.27, the stock has slipped 14.3% from its absolute high of $103.03, recorded over 900 days ago, but remains 75.6% above its multi-year low of $50.25. With recent buy-side volume spikes and a key resistance challenge at $89.34, the question arises: Is PYPL gearing up for a bullish breakout, or will sellers take control again?
The RSI14 at 33.35 signals an oversold condition, while the MFI60 at 38.5 suggests weakening selling pressure. Meanwhile, major moving averages remain clustered near $89.2-$89.49, hinting at a decisive moment ahead. Adding to the mix, the VSA Buy Pattern Extra 1st recently emerged, a sign of potential accumulation after a sharp decline.
Market sentiment is further fueled by macroeconomic uncertainties, interest rate expectations, and sector-wide volatility in tech and fintech stocks. Will buyers push past resistance, or is another wave of selling ahead? For investors and traders alike, this could be the defining moment to make a move.
PYPL Roadmap: Decoding the Market’s Next Move
The market never moves in a straight line—it's a battlefield of buyers and sellers, where every pattern leaves a footprint. Let's break down PayPal’s (NASDAQ: PYPL) recent price action using the roadmap of confirmed patterns that actually played out, filtering out the noise and focusing on what mattered.
January 27, 2025 - Buy Volumes Max (Buy Signal) PYPL opened at $89.57, climbed to $90.29, and closed at $90.24, with strong buy-side dominance. This signaled the start of an accumulation phase, pushing the price upward.
January 28, 2025 - Buy Volumes Max (Buy Confirmation) The momentum carried forward as PYPL opened at $87.87, surged to $89.36, and closed at $89.16. This confirmed the previous buy signal, proving that demand was actively stepping in. The low of the last three bars at $86.88 acted as the trigger, validating the long setup.
January 28, 2025 - Sell Volumes Max (Reversal Signal) Right after buyers showed strength, sellers hit back hard. The stock opened at $88.82, peaked at $88.85, but closed weak at $88.17. This shift hinted that smart money might be cashing out after the recent rally.
January 30, 2025 - Increased Sell Volumes (Bearish Confirmation) The downward momentum continued as PYPL opened at $90.11, dropped to $88.84, and closed at $89.56. The trigger was met—the breakdown from the previous low played out, confirming that sellers had control.
January 31, 2025 - VSA Buy Pattern Extra 1st (Bullish Reversal) The market didn’t stay bearish for long. A new buy pattern formed as PYPL hit a low of $88.28, bounced off, and closed at $88.56. This was a classic Volume Spread Analysis (VSA) buy signal—a sign that buyers were absorbing supply before a potential upward move.
What’s next? With resistance looming at $89.34, the market is at a crossroads. If bulls take charge, we could see a push to $91.44 and beyond. But if resistance holds, another leg down might be in the cards.
Technical & Price Action Analysis: Key Levels to Watch
When it comes to trading, levels are everything. Whether you’re scalping, swing trading, or positioning for the long haul, understanding where price reacts is what separates winners from bag holders. Here’s the must-watch roadmap for PayPal (NASDAQ: PYPL). If these levels fail, expect them to flip into resistance—because in this game, what was support can quickly become a selling zone.
Support Levels (Dip-Buy Zones)
85.905 – First line of defense. If bulls hold, expect a bounce play. If lost, it’s a new ceiling.
80.96 – Mid-range safety net. A break below would signal real weakness.
79.16 – The last soft support before things get messy.
71.19 – A break here sends alarms—this level needs to hold.
59.9 – If we hit this, something bigger is at play. A strong reaction is expected.
Resistance Levels (Profit-Taking & Rejection Zones)
89.34 – Immediate wall. Bulls need to flip this to keep momentum alive.
91.445 – Strong barrier. A clean break could open breakout conditions.
93.85 – High probability rejection zone. Needs volume to push through.
96.12 – Final boss before a larger rally.
Powerful Support Levels (Last Line of Defense)
102.57 – If we ever reclaim this, it’s game on for higher timeframes.
Powerful Resistance Levels (Big Money Zones)
81.46 – Needs to turn into support for a true trend shift.
70.46 – Heavy weight here. Any test is make-or-break.
58.5 – Historical battleground. Expect strong reactions.
51.09 – If bulls conquer this, deep discount buyers will wake up.
💡 Trading Playbook: If support doesn’t hold, don’t marry the trade—watch for the level to flip into resistance. Same applies in reverse—if resistance breaks, it could be the fuel for a strong bullish continuation. Stay sharp. 🚀
Trading Strategies Using Rays: Precision Entries & Probable Targets
The market moves in waves and phases, not in straight lines. That’s why using Fibonacci-based dynamic rays allows traders to catch moves from ray to ray instead of chasing price at random levels. Each ray is constructed from the beginning of a movement, not traditional highs and lows, making it a leading indicator for upcoming reversals or continuations.
The interaction with rays is what defines trade opportunities. A position is taken only after price touches a ray and confirms movement. Each next ray becomes the target for the trade. Alongside this, the Moving Averages (MA50, MA100, MA200, MA233) act as dynamic factors of support and resistance, strengthening key zones.
💡 Two Trade Scenarios: Be Ready for Both
Optimistic Scenario (Breakout & Trend Continuation)
If PYPL pushes above $89.34 resistance and secures a close, momentum traders can look for:
Entry: After interaction with the ray at $89.34
Target 1: $91.445 (next ray)
Target 2: $93.85 (if buying volume confirms)
Target 3: $96.12 (longer-term extension)
🚀 Trade Rationale: Bullish confirmation through ray breakout & support retest. RSI & MFI confirming strength.
Pessimistic Scenario (Rejection & Drop to Lower Rays)
If PYPL fails to break $89.34 and shows weakness:
Entry: After rejection from the ray at $89.34
Target 1: $85.905 (next lower ray)
Target 2: $80.96 (if bearish continuation forms)
Target 3: $79.16 (major liquidity grab zone)
🔥 Trade Rationale: If price rejects resistance and closes below MA50/MA100, sellers gain control.
💰 Potential Trade Setups Based on Ray Interactions
Ray-to-Ray Breakout Trade (Momentum Play)
If price closes above $89.34 → Enter long targeting $91.445.
If price closes above $91.445 → Ride the wave to $93.85.
Ray-to-Ray Breakdown Trade (Short Play)
If price fails at $89.34 → Enter short to $85.905.
If price loses $85.905 → Target next ray at $80.96.
Moving Average Interaction Play (Reversal Signal)
If price bounces off MA233 ($88.67) → Go long, targeting next ray up.
If price breaks below MA233 → Short it down to next key ray.
These strategies allow flexibility—reacting to price instead of guessing moves. Whether it’s a breakout ride or a rejection short, the market always provides opportunities for those watching the right signals. Stay ready. 🚀🔥
What’s Next? Let’s Talk in the Comments!
Trading isn’t just about setups—it’s about understanding the game and watching how price reacts to key levels. That’s why I want you to do one thing: save this idea, hit Boost, and check back later to see how price moves according to my ray-based system.
Have questions or want to discuss a specific asset? Drop a comment! I always read them and will answer whenever I can. Want a full breakdown on your favorite stock, crypto, or forex pair? Let’s talk—I can do some analysis publicly or, if you want to keep it private, we can work something out.
My indicator automatically maps out all rays and key levels—no guesswork, just clean structure. But it's available only in Private. If you’re interested, send me a message, and I’ll explain how you can get access.
And if you want a custom markup for any asset, I can do that too. Just hit Boost, drop your request in the comments, and I’ll add it to my list. If you're serious about improving your trading, follow me here on TradingView—this is where I post real setups that actually play out.
Markets move, opportunities come and go—let’s make sure you catch the next one. 🚀🔥

PayPal sell ideaThe Relative Strength Index (RSI) is showing a downward trend, indicating weakening momentum. Additionally, the Moving Average Convergence Divergence (MACD) is showing a bearish crossover, further supporting the potential for a downward move
PYPL , PEPS, COIN | HOT STOCKSThere are a few stocks that could be good buys, and are approaching idea l buy zones.
PEPSICO VIE:PEPS
Pepsi is showing it's "annual correction" as we're finally getting close tot he apex of the correction, which may be an ideal buy zone.
PAYPAL NASDAQ:PYPL
Paypal is still on my watchlist, for great growth, further adoption and upside potential after finish of a clear bearish cycle:
COINBASE NASDAQ:COIN
Fairly recently released, coinbase could be a good buy for a long term hold. Also currently observing a pattern that can either be called an Inverse Head and Shoulders, or Cup and Handle.
________________

Are Fintechs Making a Mega Comeback?This chart, tracking the performance of PayPal NASDAQ:PYPL , Coinbase NASDAQ:COIN , Block NYSE:SQ , and Robinhood NASDAQ:HOOD over the past year. I think the chart offers a captivating glimpse into the potential return of a sector that has gone through a fairly large downturn, and drawdown, but continues to show resiliency.
I should add that this is also an area of the market that I am simply fascinated by, having spent my career deeply embedded in it, building, growing, and watching the stories emerge first hand. At the core, there are several powerful trends to look forward to well into the future. Although, like anything, the risks are massive.
The key question is: What does the future hold for the fintech sector and the new companies that coming up in this space? Will traditional financial powerhouses like JPMorgan and Bank of America reassert their dominance over the next decade and beyond, or will these startups disrupt the industry? Whether these are long-term buy and holds, depends entirely on that question.
While the charts above mostly show a new wave of retail participation in markets, from banking to investing, brokerages and consumer finance, there are several stats to observe in detail:
Retail Investor Surge: Retail investors now account for an estimated 20-25% of U.S. equity trading volume, up from around 10% a decade ago.
Commission-Free Trading: The rise of commission-free trading platforms has significantly lowered the barriers to entry for individual investors.
Digital Adoption: The COVID-19 pandemic accelerated the adoption of digital investing tools and platforms. Money went digital at its fastest rate ever as cash payments slowed dramatically.
The future of investing lies in providing accessible, user-friendly, and comprehensive financial services that empower individuals to take control of their financial futures. For the next part of my research piece, I'll briefly write about each company listed and where I think they are at:
PayPal's Resurgence: The recent rebound of PayPal, following a significant dip, is particularly noteworthy. It shows resilience. Despite the bad news and massive drop, they managed to keep the ship sailing in the right direction. Venmo remains a powerhouse.
Coinbase's Rollercoaster: Coinbase's trajectory mirrors the fluctuating fortunes of the cryptocurrency market. As the leading cryptocurrency exchange in the U.S., Coinbase's performance is intrinsically tied to the adoption and regulation of digital assets. If digital assets task over, Coinbase is uniquely benefited to be THE leader because of their current positioning. But, if it does not, well, that means it's possibly a zero.
Robinhood's Staying Power: Robinhood, despite weathering some reputational storms, remains a significant player, particularly among younger investors. Yes they started commission free trading, but the most interesting move they are making is into retirement, wealth management, and more. They are gaining a mega head start here, coming for Goldman and JP Morgan.
Block Keeps Going: Block seems to be caught between payments and crypto, attempting to bridge the gap between the two. They are having a harder time than most realize. But I have not forgotten that they are technically a bank, and there's no reason to think they don't have Bank of America in their sights over the long-term.
Anyways, I'll continue watching this sector. It's been a bumpy ride.
Disclaimer: This is my personal opinion and not financial advice. I only share for education and entertainment!

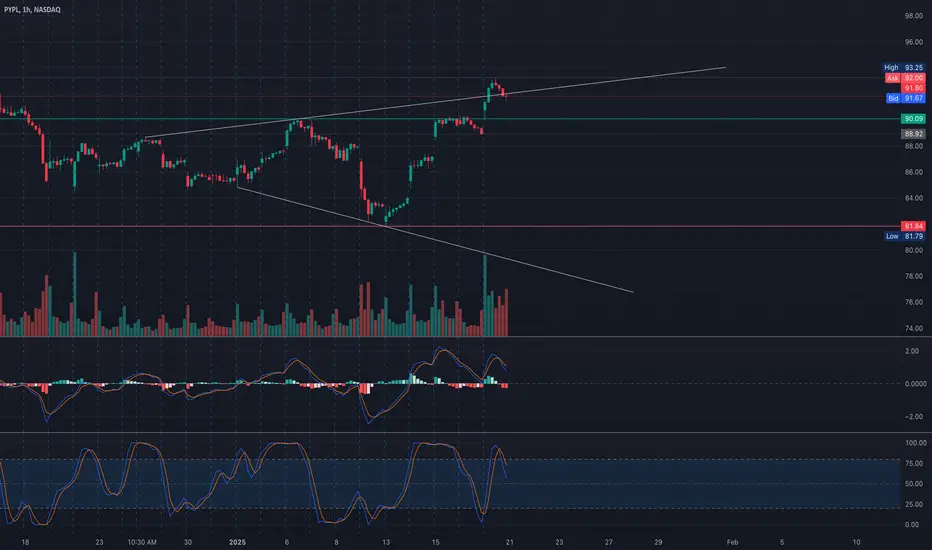
PYPL Testing Key Resistance! Trade Setups for TomorrowAnalysis:
PYPL has rallied sharply after bouncing from $81.84 support and is now testing critical resistance near $92. The price is approaching the upper boundary of its ascending channel, indicating potential exhaustion or further breakout momentum. The MACD is still positive but showing signs of waning momentum, while the Stochastic RSI is overbought, signaling caution for a pullback.
Volume has increased during the uptrend, but resistance at $92-$94, coupled with significant call wall activity, may cap near-term gains.
Key Levels to Watch:
* Resistance Levels:
* $92: Immediate resistance at the current price level.
* $94: Key resistance zone aligning with the second call wall and significant gamma exposure.
* $95: Extended upside target if bullish momentum persists.
* Support Levels:
* $90: Strong support aligned with positive GEX positioning.
* $88: Secondary support near the gamma wall.
* $86-$84: Critical downside support zone.
GEX Insights:
* Gamma Exposure (GEX):
* Positive GEX levels dominate near $92-$94, creating strong resistance.
* Negative GEX support is visible around $88-$86, providing stability against sharp declines.
* Options Activity:
* IVR: Moderate at 61.9, reflecting above-average implied volatility.
* Call/Put Ratio: Calls dominate at 44.4%, showing bullish sentiment but with resistance overhead.
Trade Scenarios:
Bullish Scenario:
* Entry: Break above $92 with strong volume.
* Target: $94 (first target), $95 (extended target).
* Stop-Loss: Below $90.
Bearish Scenario:
* Entry: Rejection near $92 with bearish price action.
* Target: $90 (first target), $88 (extended target).
* Stop-Loss: Above $93.
Directional Bias:
The bias leans cautiously bullish, but with resistance at $92-$94, a pullback or consolidation may occur before a sustained breakout. Traders should monitor volume and momentum for confirmation of the next move.
Disclaimer: This analysis is for educational purposes only and does not constitute financial advice. Always do your own research and manage your risk before trading.
PayPal PitchFanNASDAQ:PYPL
Next range looks to be up to $120's. Have to see the stock start to move in this new range.
Could this company start to do more in crypto space?
Comment what you think about this chart.
Comment any tips or suggestions.
NASDAQ:PYPL

$PYPL - looks goodNASDAQ:PYPL is trading inside a channel and currently sitting on a support. I re-entered with a small position.
As always, I share my opinions and trades. I'm not suggesting that anyone follow my trades. You do you.
