Bullish CrabThe Crab is another reversal pattern that allows you to enter the market at extreme highs or lows. Peak 2 is lower than peak one, unlike the Cypher or the Shark. Valley 2 of the crooked M is lower than valley 1, which is similar to the Butterfly. The Crab is very similar to the Butterfly pattern but the final C-D leg makes a deeper 161.8% extension of the initial X-A leg and the pattern's inner retracements are also slightly different. The Butterfly retraces .786 of the XA leg and CD should ideally land at the 1.272.
The bands are contracting suggesting a move soon one way or the other. Price is being squeezed similar to when price hits the nose of a triangle. These bands are set on 2 standard deviations. There is no way to know for sure which way price will break. Some may place a limit buy order over the top band to ensure it breaks to the upside.
The bands expand when volatility is high and contract during price consolidation.
Bollinger Bands are comprised of three lines – the upper, middle, and lower band. The middle band is a moving average, and its parameters are chosen by the trader. The upper and lower bands are positioned on either side of the moving average band. The trader decides the number of standard deviations they need the volatility indicator set at. The number of standard deviations, in turn, determines the distance between the middle band and the upper and lower bands. The position of these bands provides information on how strong the trend is and the potential high and low price levels that may be expected in the immediate future.
Bollinger bands can also give you overbought (above top band) and oversold signals.
The Alligator indicator uses three smoothed moving averages, set at five, eight, and 13 periods, which are all Fibonacci numbers. The initial smoothed average is calculated with a simple moving average (SMA), adding additional smoothed averages that slow down indicator turns. Tangling of the moving averages suggest the alligator is sleeping, but the gator will awaken and move one direction or the other.
No recommendation
Bullish engulfing candle at this moment on daily time frame.
If you do not have rules, then every move you make can be a mistake, yet you may never know it until it is too late.
PYPL34 trade ideas

PYPL TO THE DOWN SIDE PYPL (PAYPAL HOLDINGS INC) can go around $149 - 140 to finish the correction. Most likely we will go down for finish correction and you can check the RSI indicator for better confirmation.
DISCLOSURE - Please be informed that the information I provide is not a trading recommendation or investment advice. All of my work is for educational purposes only. All labeling and wave count have been done by me manually and I will keep changing according to the LIVE MARKET PRICE ACTION. So don't bias, hope on my trade plans. Try to learn Elliott Wave or other strategies and make your own strategy. Following is not that much easy. I am not responsible for any losses if u took the trade according to my trade plans.
#PYPL #PAYPAL

watch for a clear break past 174 for breakdown confirmation🚩after weeks of consolidation we are finally seeing where paypal wants to go next.. leaning to the downside!
remember after long consolidation we see big breakout moves, under 174 look for a quick test of 169.8-156.65-143.5
If support holds look for more sideways action.
like and follow for more💘

Paypal on the way down.Let`s summarize the facts:
1. the stock gained incredible 275% from March 2020 to February 2021
2. revenue and business outlook weaker than expected
3. it's currently below all moving averages
4. double top created (Feb 2021 / Jul 2021)
5. dead cross on 3rd Nov 2021
6. currently consolidating as bearish rectangle between range 195 and 177. the bearish rectangle is known as continuation pattern.
Considering all facts including market situation of high priced tech stocks I think paypal will move down soon. Watch out for breaking the support line.
No financial advice.

PYPL $215 PTThe crooks on Wall St have probably built out a nice position in PYPL, ready to sell back to retail when it rallies. I'm betting PYPL breaks out of the down trendline and pushes back into the $205-$210 range. Playing a calendar spread on this one. $205 Strike with short leg expiring 1/21 and long leg expiring 2/4 for a debit of $1.30. Potential 3X'er if all goes well.

WOWWPYPL is trading at very solid support and is consolidating nicely. I am looking for it to ripppp in the coming months.

$PYPL waiting for a bounce off of supportWhat was once resistance is now support after the massive selloff
Weekly chart is looking mega oversold

PayPal's bad days are about to end!In this article, I will try to shine the light on the mathematical aspects of technical trading!
The mathematics behind the harmonic patterns!
What is a dynamical system?
A dynamical system is all about the evolution of something over time. To create a dynamical system we simply need to decide (1) what is the “something” that will evolve over time and (2) what is the rule that specifies how that something evolves with time. In this way, a dynamical system is simply a model describing the temporal evolution of a system.
The state-space
The first step in creating a dynamical system is to pin down what is the special “something” that we want to evolve with time. To do this, we need to come up with a set of variables that give a complete description of the system at any particular time.
By “complete description,” we don't necessarily mean that the variables will completely describe a real-life system we may be trying to model. But, the variables must completely describe the state of the mathematical system. In a dynamical system, if we know the values of these variables at a particular time, we know everything about the state of the system at that time. To model some real-life system, the modeler must clearly make a choice of what variables will form the complete description for the mathematical model.
The variables that completely describe the state of the dynamical system are called the state variables. The set of all the possible values of the state variables is the state space.
The state-space can be discrete, consisting of isolated points, such as if the state variables could only take on integer values. It could be continuous, consisting of a smooth set of points, such as if the state variables could take on any real value. In the case where the state space is continuous and finite-dimensional, it is often called the phase space, and the number of state variables is the dimension of the dynamical system. The state space can also be infinite-dimensional.
Geometry and Fibonacci Numbers
Harmonic trading combines patterns and math into a trading method that is precise and based on the premise that patterns repeat themselves. At the root of the methodology is the primary ratio, or some derivative of it (0.618 or 1.618). Complementing ratios include: 0.382, 0.50, 1.41, 2.0, 2.24, 2.618, 3.14 and 3.618. The primary ratio is found in almost all-natural and environmental structures and events; it is also found in man-made structures. Since the pattern repeats throughout nature and within society, the ratio is also seen in the financial markets, which are affected by the environments and societies in which they trade.
By finding patterns of varying lengths and magnitudes, the trader can then apply Fibonacci ratios to the patterns and try to predict future movements. The trading method is largely attributed to Scott Carney, although others have contributed or found patterns and levels that enhance performance.
The Bat
The bat pattern is similar to Gartley in appearance, but not in measurement.
There is a rise via XA. B retraces 0.382 to 0.5 of XA. BC retraces 0.382 to 0.886 of AB. CD is a 1.618 to 2.618 extension of AB. D is at a 0.886 retracement of XA.
Conclusion:
No matter which approach you use, try to pick the one that works for you!
Reference:
mathinsight.org
www.investopedia.com
You can see the most important support(green line) and resistance (red line) levels.
Best,
Moshkelgosha
DISCLAIMER
I’m not a certified financial planner/advisor, a certified financial analyst, an economist, a CPA, an accountant, or a lawyer. I’m not a finance professional through formal education. The contents on this site are for informational purposes only and do not constitute financial, accounting, or legal advice. I can’t promise that the information shared on my posts is appropriate for you or anyone else. By using this site, you agree to hold me harmless from any ramifications, financial or otherwise, that occur to you as a result of acting on information found on this site.

Paypal Purchase ideaIIf the price overcomes the resistance, a buy signal could be generated. Target= Gap 224$

PYPLDaily Stock Report
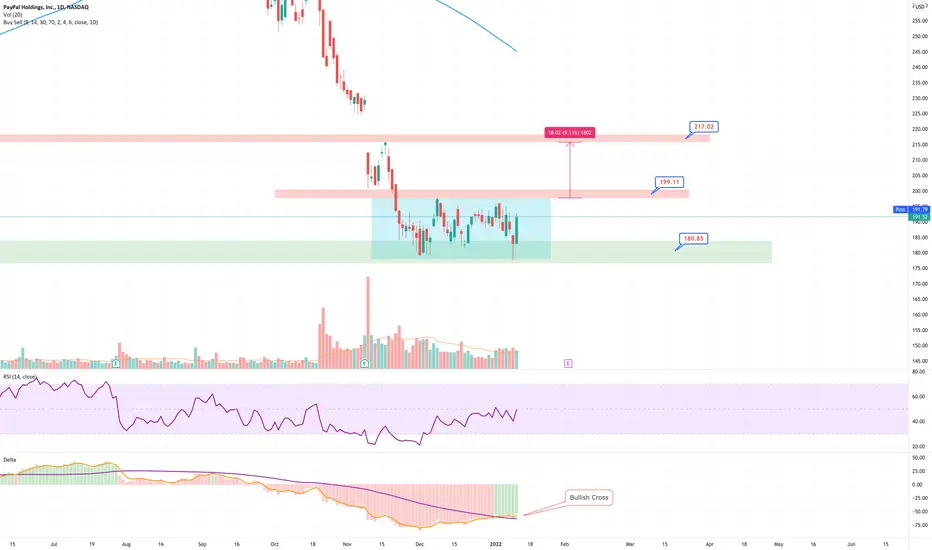
PYPL looking great for a breakout. It has been consolidating right at support. If it can break above 199 the next level of resistance would be at 217 level. Earnings coming out on Feb 02 so it can either run into earnings or breakout after earnings.
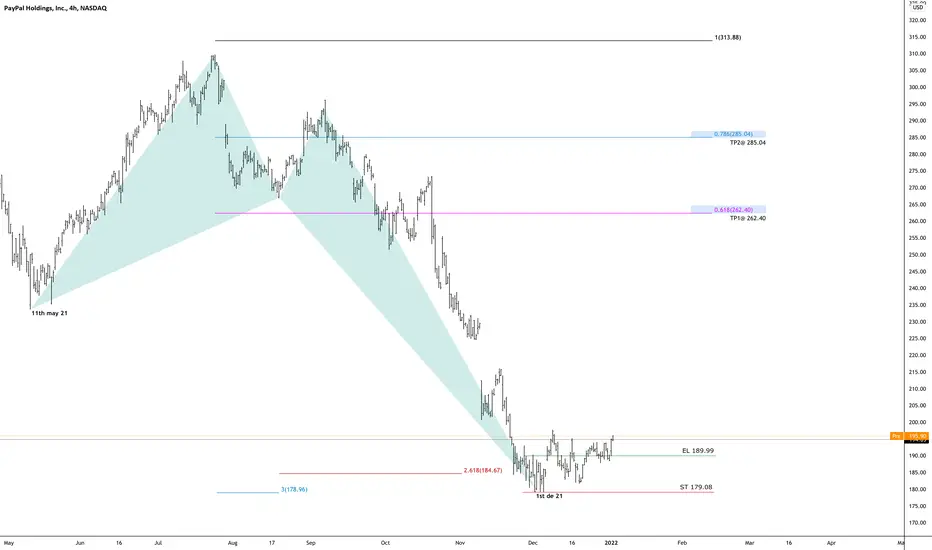
PAYPAL ADVANCE HARMONICS PATTERNPAYPAL has formed an advance harmonics pattern (bullish crab)
price is treading above the entry level @ 189.99 with stop @ 179.08 with targets projections to 262.40/285.04
PayPal - Ready for new All-Time-Highs?Hey Investor,
please see my longterm idea on PayPal, where my counts suggests a possible bottom printed which will now lead to the next bullish cycle. What is important here is that we close above the 1.618 Fibonacci extension level in order for this analysis to be invalid. A break o the 1.618 level would lead to a bearish wave 3 which would change dramatically my count.
This is no financial advice, just my technical expertise.
RT

PayPal wave idea analyze the nasdaq paypal stock. there is a small down move left. only for educational purposes.

PYPL 8 Hr chartPaypal is entering into an accumulation zone. I see the lows of July to be the trigger to the upside.

PayPal Long, Building Zone of AccumlationI believe we are currently trading within an accumlation zone. The volume profile suggests that at these levels both shorts and longs are particularly active. On the weekly chart I see almost 11 weeks of straight dump on oversold conditions now, adding to my belief we will see some sort of larger bounce off this accumlation zone to possibly fill the gap at 225. As of the time of this post we are hovering at support at 180, making this moment a great time to add shares to at least take it up to the top of the range high at 195.

$PYPL set up on my Putshere was the set up on both of my put wins on PYPL this morning. major entry was last friday but missed so took the short term entry for 2 easy $100.00 profit with a goal of hitting 500.00 for the day. follow indicators for direction and divergence for day trading was my key.

PYPL to fill up the gap by end of Feb 2022buy at 185 and sell at 195 or ride the run up to fill the gap.

PYPL: The Pain Isn't Over By A Long ShotPYPL has been a huge disappointment since the end of Q3 '21. Old tech, no innovation, and other payment companies starting to make it look like a boomer stock.
Looking at swinging this short to AT LEAST the 138.96 gap going into the end of the month. The pain is not over if you're a PYPL bull. Possible 108.45 by end of January if market has a taper tantrum and rates increase.

$PYPL | WEEKLY WATCHLIST 1/10$PYPL 1D
Been continuously warning of the uncertainty of this one. Looks like it wants the projected leg down in the coming few weeks.
Watching the $160-170 area for support, otherwise mid $130s possible before recovery begins.

Historically, it’s time to buy Any time PayPal’s PE reaches these levels, it rips to the upside. It seems high in the mid 40s, but it’s expensive for a reason.


