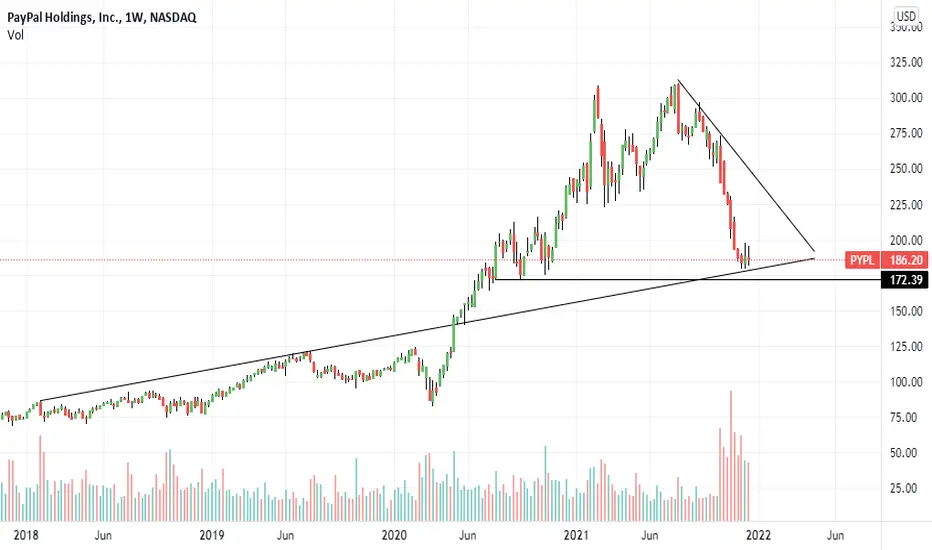
PYPL had hit rock bottom at the 1H chart and is turning aroundPaypal had fallen almost 40% from the peak and I was actively searching for a potential reversal. Looking at the 1H chart tallied with the 4H chart and 1D chart. I think PYPL is currently reversing its falling trend. Hope I got it right and being able to benefit from the analysis.
Buy@ 191
Stop loss@ 180
Profit @ 226 and 263
Profit to loss ratio : 6
PYPL34 trade ideas

PAYPAL, ready for recoveryLook at the support and resistance levels. Paypal broke out, so ready for the big recovery.
Very good R:R. This could be a big winner long term.

Is $PYPL ready to take off next year?It's been a bloodbath for NASDAQ:PYPL over the Q3 and Q4 this year, it has lost about 40% so far, will it take off next year?
Follow for more updates...
#AHMEDMESBAH

PYPL, 2 HrsNASDAQ:PYPL
PYPL, 2 Hrs,
We have to wait until the Bat harmonic pattern complete then. if we get any bearish sign, then
Short @ 208.25 - 211.79
Sell @ T1: 198.88 , T2: 191.20
Stop Loss @ 218.99
---------------------------
Please. Read the disclaimer, and do your own diligence.
------------------
DISCLAIMER:
I am not a financial /investment advisor. All information I am sharing here is for entertainment purposes only and should not be considered personal investment advice. While the information provided is accurate, it may include errors or inaccuracies. Please, do your diligence when it comes to investing or trading in the market. You are responsible on your choice. Thank you

PYPL GOOD IDEA SELLI am a consultant for anyone who needs a consultant, I see that PYPL will GO DOWN IN THIS NEXT DAYS
1, When you decide to use my ideas in your trading, please contact me to inform you of some things and monitor the position together without specifying a take profit or stop loss, we will decide when to open and close the position
2 (When I set the take profit and stop loss in a number that does not mean that the price will reach it, I gave a buy or sell signal only according to the analyzes I made in the chart and delete it later, in the order to share it with you so that you have a clear picture and read it clearly, thank you!)
3, we can work together and try me for one or two weeks to decide to work with you and give you signals about buying or selling

Paypal easy like a piece of cakeMonthly in red , weekly in Blue and short term in Pink
no talk , only action
Monthly low is in, Weekly low is in. Well at least in this speculative market you have to take some assumption, so everything here is in my opinion, do your DD.
BTW stop loss is may be 175
Ideally entry is monthly 50% to 61.8%, that's where we are exactly and now let's take weekly 23.6% level and best part is short term extension in pink is at 210, we will see when it gets there first then another downturn or upward??? you let me know if you are aware. Thanks for your time one more time.

PYPL (PAYPAL HOLDING) WILL MAKE NEW LOWPYPL (PayPal Holding) will rise a little bit and after that, it will make a new low to finish the correction and after that, it will most likely go upside.
DISCLOSURE - Please be informed that the information I provide is not a trading recommendation or investment advice. All of my work is for educational purposes only.
All labeling and wave count have been done by me manually and I will keep changing according to the LIVE MARKET PRICE ACTION. So don't bias, hope on my trade plans. Try to learn Elliott Wave or other strategies and make your own strategy. Following is not that much easy. I am not responsible for any losses if u took the trade according to my trade plans.
#PAYPAL #PYPL #PAYPAL-HOLDING

Strong PRZ on PYPL weeklyI think anything we need is in this chart!
Price is so close to the weekly strong support area, also near to 61.8 of Fibo ret and level 2 of Fibo Time zone. In addition, it is in the oversold area of RSI and touches the weekly MPL. So, I think the price is in a strong PRZ and we can expect a bullish trend.

$PYPL if we go long...Still going to keep coming back to this if we go long. Been playing both sides lately, but yesterday I entered a calendar spread that I turned into a call spread today $197.50/$210 call spread for 12/31. Also grabbed $200 calls at $1.02 before close today. If this can continue the next two days, any call spread into the end of the year could be solid. No reason not to protect yourself with a small put just in case...

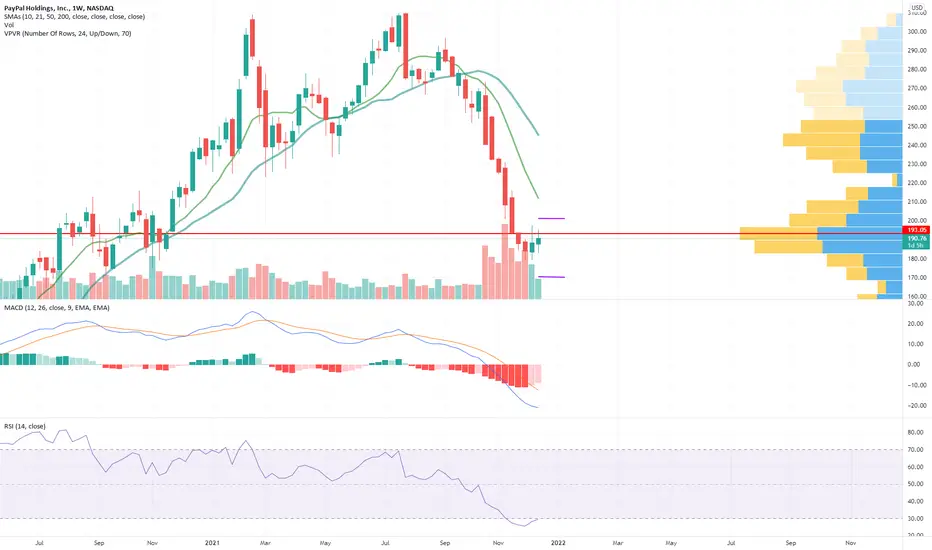
Paypal weekly reviewI see Paypal is on my oversold area which might potentially rebounce just above the EMA200 as the dynamic support-resistance.
I also see the trading divergence shape that may be a sign for the price to rebounce.

$PYPL | WEEKLY WATCHLIST 12/20$PYPL 1D
Still tons of indecision and very unclear chart imo. Is THE bottom in? Maybe. Is there another leg down? Maybe. I expect lots of chop to build out a base at the very least. Be patient with this name and wait for some clarity.

$PYPL just one play...Xmas week offClosed everything else out, not sure of market direction right now with OPEX. Entered a strangle for 1/21/22 $220 call/$150 put for $2.10. Will wait until after Christmas to reassess.
Taking next week of, good luck all!

$PYPL day trade recap...After closing out the $200 12/31 calls yesterday, I wanted a play that gave me a chance if this kept moving, but protected myself to the downside. Grabbed a $190 put, with some $195 call lottos. Closed the $190 put at $7.00 from $1.80, over all solid play.

PYPL LONG - Reversal Coming?PYPL another stock looking great on the weekly (and daily) at these levels for LONG term holds.
** NOT TRADING ADVICE **

$PYPL still setting up as planned, but taking risk off...So far so good, this is a tough one to turn around completely after the downtrend it just had. Going to close out long term with 60% gain, then take a small short term position while the market digests the news from yesterday. Will post any reentry.


4HR div and waning momoLookin good for a short with a nice and easy R:R. Let me know your thoughts below!

$PYPL end of year strangle...When we started to run last week, we touched $197...now we have the FOMC that is creating alot of anxiety and could end up causing more capitulation. If it doesn't, this thing runs again and I think goes over $200 quick. If not, the downside to the next volume shelf maybe at $140 is pretty far. Into the end of the week going to try a 12/31 $200 call/$170 put both at $1.60, see who wins. Consolidation burns my premiums so looking for movement.

$PYPL relative strength...This is one that has been consolidating and trying to move, so on a day like this I am asking, Why does this have relative strength? Is this turning into a value play from a tech play? Taking note and considering another attempt at a call, but if I do I'll protect myself with something to the downside.

Catching the falling knife?#PYPL meet the strong resistance with the monthly demand zone and trendline. Waiting for signals to buy and hold for long with very small risk

$PYPL rolled over...Too much weakness in this market, continued fake outs and more weakness. Planned on holding this for awhile, but the market is starting off pretty poorly, so I'm going to move on for now and wait for another set up.
