RCL- long Term bullishLooks like RCL could make a little comeback as last week confirmed a breakout and let's see if earings helps a little continuation. I'll be shopping for a 2022 Call tomorrow before opening.
R1CL34 trade ideas

RCLI think cruiselines do well this next month, but I expect some pullback to support for RCL earnings tomorrow before a multi week run towards $100
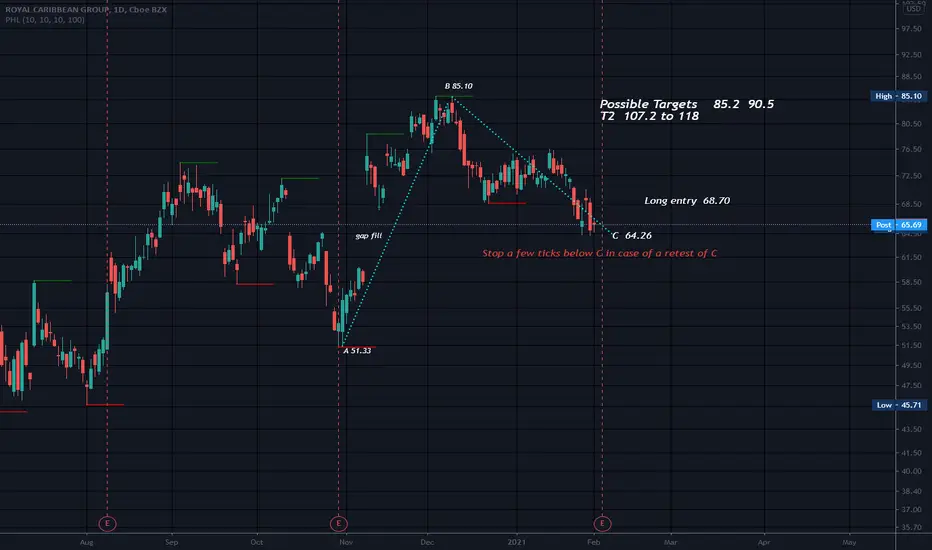
ABC BullishRCL has come down and filled a gap it left behind previously..
Support can often be found at the top of at the bottom of a gap.
Windows as they are called in Japanese Candlestick Charting, or Gaps, as they are called in the west, are an important concept in technical analysis.
Whenever, there is an open gap that means that no price and no volume transacted hands between the gap. Resistance: Once price gaps downward, the gap can act as resistance. Support: When prices gap upwards, the gap can act as support to prices in the future. When a gap has started filling, it will rarely stop due to there often being no immediate support or resistance.
Gaps are like a vacuum on the price chart. Most large gaps will be filled within a year. The average time for a gap to be filled in the stock market is 3 months.
Not a recommendation

First Chart I Have Created!! Would love some feedback!Looking for feedback in order to improve future analysis.


ABC BullishPossible stop below C but good to place it at least 5 to 10 cents below C as C is sometimes retested
Long entry when price breaks the BC leg with an uptrend..
Targets calculated from length of AB leg using fib levels. Fib levels are not as easy to use sometimes as they sound. Figuring out where to place them can be a task and I never used them until the last year or so. They are often correct, but sometimes they are not (Like most trading tools I suppose). The first issue is created by the series of Fibonacci lines that can be drawn at each significant turn or pivot point: After a stock has zigged and zagged a few times, the resulting pivot points create a cacophony of levels that can render a chart unreadable. And I like a clean looking chart and I use very few indicators so Fibonacci and I do not always work out. I love them for calculating targets though and they can come in useful for trying to pin point turns in the market as well.
I suppose RCL just had to go fill that gap down there!
ABC Bullish patterns are a a measured move down within a larger measured move up. It's a stop run of the first pullback after an aggressive move to the upside that signifies more potential in the direction of the larger move. Being sure you are at C can be a challenge and often price will retest C at least once or more. But getting in close to C is usually about as safe as I feel I can get in trading IF it is a valid C.
C needs to be above A in this particular ABC pattern. If not, you are looking at another harmonic pattern perhaps. IE..the gartley pattern can make you think you have a double top with the second top lower, but in the end it is a bullish pattern There are bearish versions of all harmonic patterns.
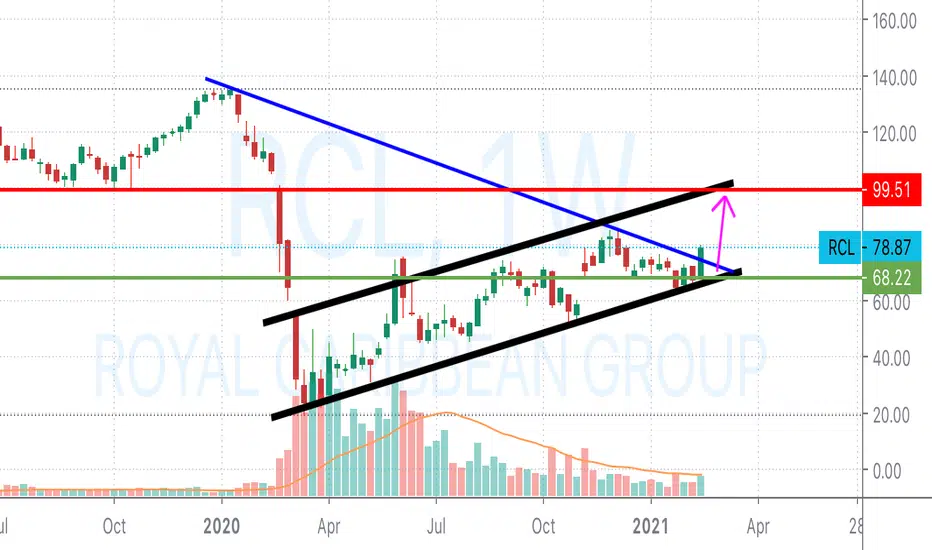
There are no rising wedges in the yearly chart.
Not a recommendation
Understand that most problems are a good sign. Problems can indicate that progress is being made and you are moving toward your goals. Sometimes best to be leery when you have no problems. Then you've really got a problem ... Problems can be like landmarks of progress


RCL - Bullish Triangle ConsolidationAfter taking some time into consolidation and to be honest more than I was expecting, now we can see that the price broke out of a bullish triangle.
Targets to consider:
$78.78
$84.83
$90.16
Thank you and Good Luck!

RCL, Next week with Stimulus hope!We can see here RCL is consolidating in Fibo retracement between 23 and 38 level and breaking out with good news coming over this week, it is targeting the level between (50-61.8 %) Fibo, that means between 76-78 and could be higher
Good luck every one
NYSE:RCL

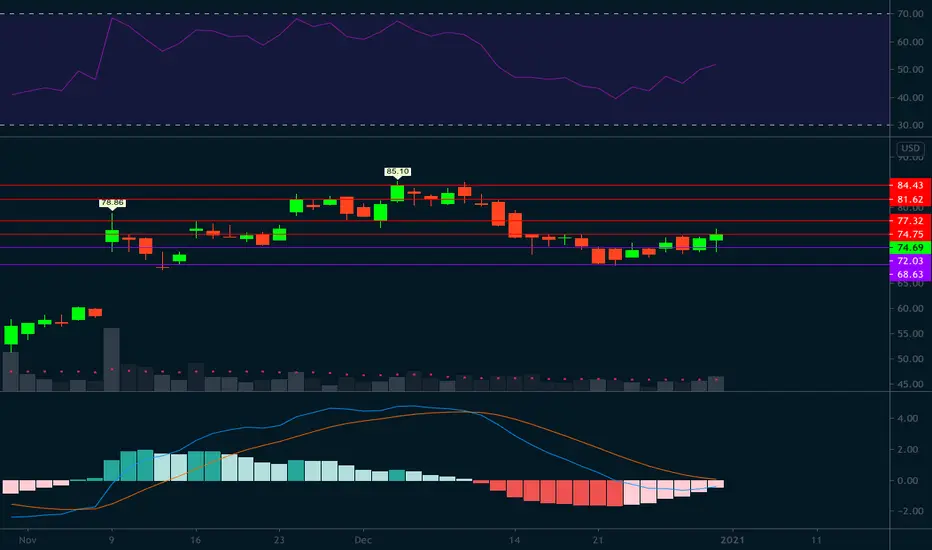
MACD moving up long to 90MACD is changing direction, the stimulus is pumping up these recovery stocks and RCL looks like its about to pop, probably should wait for confirmation though.

RCL for the long termStories aside about a vaccine and return to normal I like the price action of NYSE:RCL . What the price has done is brush up against the 50% retracement level several times this year and finally has broken above it for a week and come back this morning to spike out and confirm it now as support. This presents a great LOW RISK trade because you know where your stop needs to be (below this morning's low).

RCL and DAL BULLISH Recovery StocksSome price action this week got me very interested in stocks that were all the rage through the pandemic trading in 2020. NYSE:RCL is a trade I posted about yesterday that was up 4% on the day today. I like this price action to go more. NYSE:DAL is another stock in recovery that a friend had me look at and it has almost identical price action. He also took a LONG date option and I love it... he's getting PAID FOR PATIENCE!

RCL - Ascending Triangle BottomWhile an ascending triangle usually forms with a prior uptrend (ie a "continuation" pattern looking to resume the prior (up) trend), the odds are also good as a trend reversal pattern when it forms at the bottom of a chart.
Looks like a breakup of this triangle is getting close especially when we see a strong gap up as it approaches the apex of the triangle (although another minor pullback cannot be ruled out).
Declining volume is also typical as the triangle is being formed and once it breaks up (for good), an increasing volume will help increase the odds of a sustainable trend.
Theoretical target is ~ 128 (a cool 68% profit potential from breakup level of 76). I would put an initial stop loss 65 and trailing the stop up on if and as the trade goes our way. Let's check back in several weeks / months to see how this will play out!
Disclaimer: This is just my own analysis and opinion for discussion and is not a trade advice. Kindly do your own due diligence and trade according to your own risk tolerance. Thank you. Feel free to comment and share your opinion :)

$RCL Royal Caribbean Group Bullish Targets
Potential Bull-flag breakout targets for RCL- above major resistance at $75.55
-$77.40 Monthly candle resistance
-$82.93 Yearly horizontal resistance.
-$89-90 Major pivot point and Fibonacci Golden pocket

Royal Caribbean Stock Analysis - RCL stock forecast todaThe Idea is to hold - refer to NYSE:CCL Technical Analysis


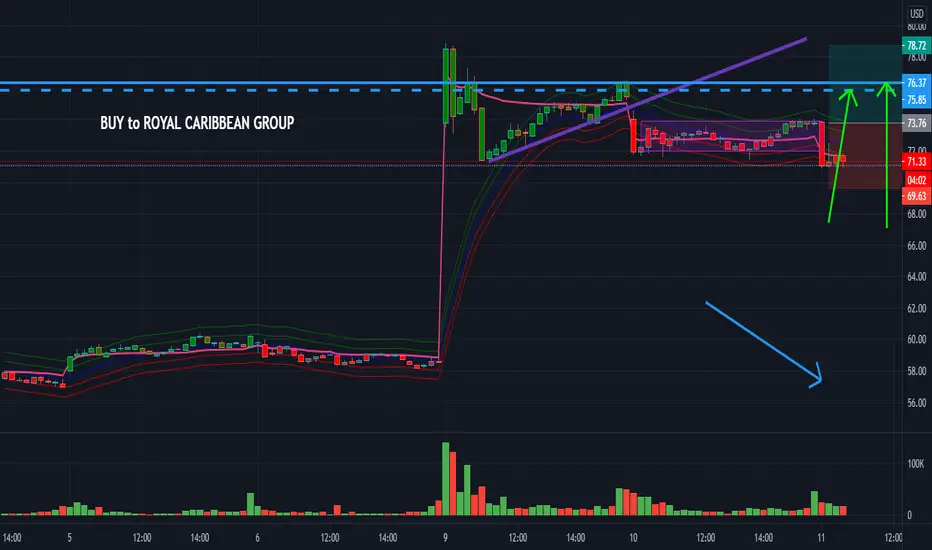
ROYAL CARIBBEAN GROUP Course Hey guys, ROYAL CARIBBEAN GROUP is in a false bearish trend with a large volume of purchases issued and an attempt by repressed buyers. Leaning on the TIMEFRAME M1 we see a hammer bull candle shape with past purchase volume. It is very plausible to break the VWAP then to breakout the price zone and put it away to go to a new zone. Subsequently go fill the gap of bearish breakout and breakout again to revel on the high after.
Please LIKE & FOLLOW, thank you!

Royal Caribbean falling below support lineIn case anyone still follows RCL. Price has fallen below support as earnings date is approaching.

RCL oversold short term bullish with ER to gap fill struggling w/ support at 100MA, very close to the previous close from last ER
under quarterly POC, expecting for a bounce off 100MA to POC. bull case to find support near POC before gap fill.
ER as catalyst coming up, so short term bullish.

ABC BullishPossible T2 (long term) 116.5 to 136
Possible stop below 45
RCL had formed a intra-year C&H pattern but is not to long entry level on that pattern of 75.7
I think travel stocks will move after election when the covid scare goes away. I do not think there will be a point in continuing the fear instilled in to this country by the media anymore, no matter who wins. The purpose will have been served.
Not a recommendation
