$NU : 30% CAGR for your portfolio for the next 3-5 years!- NYSE:NU is a big name in the LATAM.
- LATAM is expected to grow significantly in next decade with digitalization as the strongest theme.
- Let's talk about fundamentals:
Year | 2025| 2026| 2027 | 2028
EPS | 0.56 | 0.77 | 1.05 | 1.45
EPS growth% | 31.99% | 37.71% | 36.05% | 38.58%
For a company growing EPS at 30%+ deserves a forward p/e of 30
Base Case Stock Value ( Forward p/e = 30 ):
Year | 2025| 2026| 2027 | 2028
fair value | $16.8 | $23 | $31 | $43
Bear Case ( Forward p/e = 20 )
Year | 2025| 2026| 2027 | 2028
fair value | $11.2 | $15.4 | $21 | $29
Bull Case ( Forward p/e = 35 )
Year | 2025| 2026| 2027 | 2028
fair value | $19.6 | $26.95 | $36.75 | $50
ROXO34 trade ideas
Nu Holdings: Is Latin America's Fintech Star Sustainable?Nu Holdings Ltd. stands as a prominent neobank, revolutionizing financial services across Latin America. The company leverages the region's accelerating smartphone adoption and burgeoning digital payment trends, offering a comprehensive suite of services from checking accounts to insurance. Nu's impressive trajectory includes acquiring 118.6 million customers, accumulating $54 billion in assets, and consistently demonstrating robust revenue and net income growth, primarily driven by its strong presence in Brazil, Mexico, and Colombia; - this strategic alignment with digital transformation positions Nu as a significant player in the evolving financial landscape.
Despite its remarkable expansion and optimistic projections for continued customer and asset growth, Nu faces notable financial headwinds. The company experiences an erosion in its net interest margin (NIM), influenced by increased funding costs from attracting new, high-quality customers and a strategic shift towards lower-yield, secured lending products. Furthermore, the depreciation of the Brazilian Real and Mexican Peso against the US dollar impacts their reported earnings. Nu's ambitious ventures, such as the NuCel mobile phone service, require substantial capital investments, introducing execution risks and demanding efficient capital allocation.
Beyond internal financial dynamics, a significant, albeit external, geopolitical risk looms: a potential Chinese invasion of Taiwan. This event would trigger a global embargo on China, leading to unprecedented supply chain disruptions, widespread stagflation, and hyperinflation worldwide. Such a catastrophic economic cascade would profoundly impact Nu Holdings, even given its regional focus. It would likely result in drastically reduced consumer spending, a surge in loan defaults, severe challenges in accessing funding, further currency devaluations, and soaring operational costs, thereby threatening the company's stability and growth prospects.
Ultimately, Nu Holdings presents a compelling growth narrative rooted in its innovative model and strong market penetration. However, internal pressures from evolving interest margins and high capital expenditure, combined with the low-probability but high-impact global economic upheaval stemming from geopolitical tensions, necessitate a cautious and comprehensive assessment. Investors must weigh Nu's demonstrated success against these complex, intertwined risks, acknowledging that its future prosperity is inextricably linked to both regional economic stability and the broader global geopolitical climate.

NU - One of my favorite long term holds. Loading up every chanceI believe this company is way undervalued and it is growing exponentially. Overlooked because of where it does business (mainly Brazil, Mexico) but the leader in those countries.
I am adding every chance I get for a long term hold here - and the algorithms are agreeing with me!
Happy Trading :)

Nu Flag breakoutNU given flag break out and also retested channel breakout hope it will make new highs in future
Nu Holdings Ltd. (NYSE: NU), the parent company of Nubank, is a leading digital banking platform in Latin America, operating primarily in Brazil, Mexico, and Colombia. As of May 22, 2025, the stock trades at $12.25, with a market capitalization of approximately $58 billion
Nu Holdings demonstrates robust growth and profitability, driven by its expanding customer base and strategic initiatives in Latin America. The company's strong financial performance, coupled with its expansion into new markets and leadership appointments, positions it well for continued growth. However, investors should remain mindful of potential risks, including FX volatility and market-specific challenges.

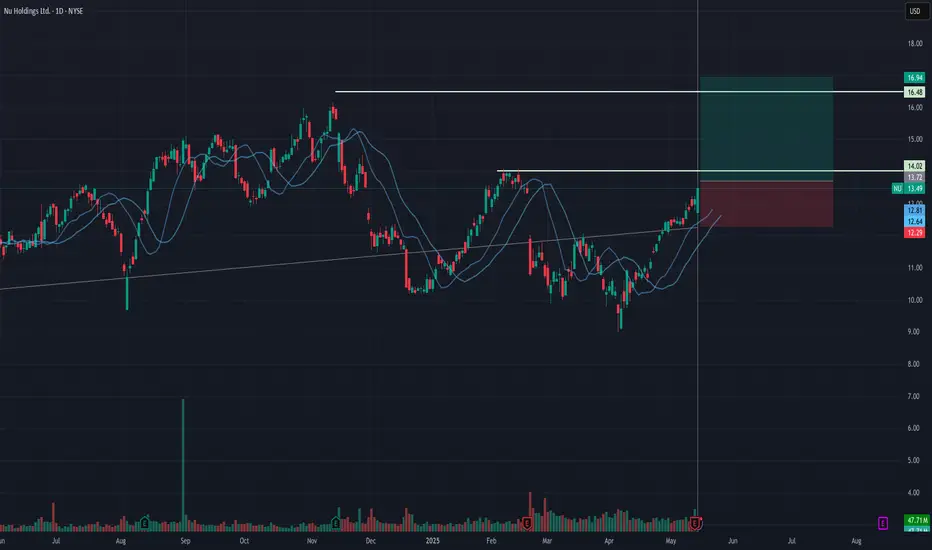
Nu Holdings (NU, 1D) — Technical AnalysisNu Holdings (NU, 1D) — Technical Analysis: Trendline Breakout, EMA/MA Confirmation, Recovery Toward Key Levels
On the daily chart, Nu Holdings has broken out of a descending trendline, signaling a potential structural reversal. The breakout was confirmed by a close above key exponential and simple moving averages (EMA 50/100/200), with the EMAs beginning to align in a bullish sequence. The price has held above the critical Fibonacci retracement level at $11.73 (0.618), which now serves as a key demand zone. Volume shows signs of increasing during upward impulses, suggesting accumulation interest. The current recovery structure indicates potential targets at $12.58 (0.5 Fibonacci), followed by $13.42 (0.382) and $14.46 (0.236). A more extended move could lead toward the previous supply zone near $16.15 if momentum persists.
From a fundamental standpoint, Nu Holdings continues to attract investor attention within the fintech sector, especially amid broader rotation back into growth and tech-driven financial platforms. The company's expanding market presence and improving financial metrics may support the current technical setup. As long as the price holds above the broken trendline and maintains strength above the key $11.73 level, the bullish scenario remains in focus with targets pointing toward the $13.42–$14.46 range and potentially higher in the medium term.

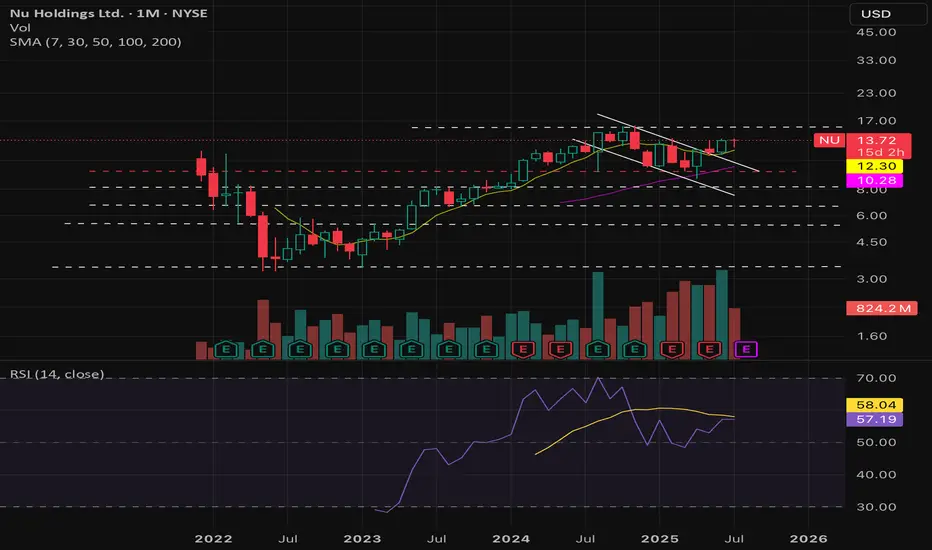
NU in the verge of a correction?Nu has been respecting the RSI and overall technical indicators pretty well, meaning that we can rely on them for swing trading with some level of confidence.
From the recent bottom to the current price we saw a 44% increase in the price. Do you really want to risk not taking profits or buying right now?
We will take the smart decision and sell or wait to buy again.

Elliot wave - NU HOLDINGSThis is my analysis of NU, where a wave 3 is currently in development. We will soon see the completion of the first five subwaves, forming the entire first subwave of the larger green wave 3. So far, everything is going exactly according to plan. The target for this trade is when the blue wave 5 reaches approximately $15–16, at which point we will wait for a correction and prepare for a new position with even more strength behind it.

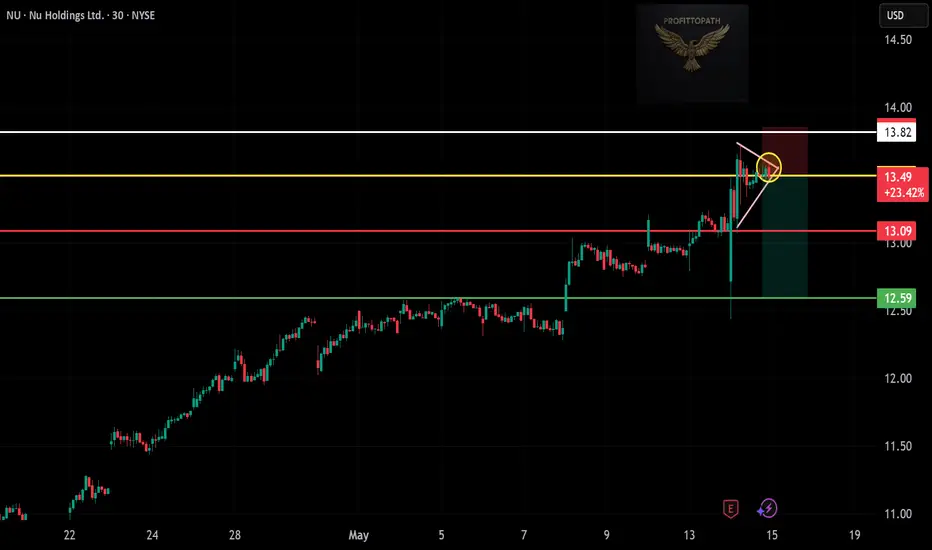
Short Trade Setup – NU Holdings (NU)!🔻
Timeframe: 30-Minute Chart
Pattern: Rising Wedge Breakdown (Bearish Reversal)
📝 Trade Plan
📌 Entry: ~$13.49 (Breakdown confirmation from rising wedge)
🛑 Stop-Loss (SL): $13.82 (Above wedge resistance / invalidation zone)
🎯 Take Profit Targets:
TP1: $13.09 (support zone – red line)
TP2: $12.59 (major support – green line)
📊 Risk-Reward Calculation
Risk: $13.82 - $13.49 = $0.33
Reward to TP1: $13.49 - $13.09 = $0.40
Reward to TP2: $13.49 - $12.59 = $0.90
➡️ Risk-Reward Ratios:
To TP1: ~1:1.21
To TP2: ~1:2.72
🔍 Key Technical Zones
🔻 Entry: Breakdown at $13.49
🛑 SL: $13.82 (wedge invalidation)
🟥 TP1: $13.09 (prior demand)
🟩 TP2: $12.59 (strong support base)
✅ Setup Summary
Clean wedge breakdown pattern
Tight stop-loss above recent highs
Excellent risk-reward profile, especially toward TP2
Watch for volume confirmation and market sentiment
Nubank reports earnings showing continued growth. Up from here.Sell the news event, earnings were great. Expect a revisit to ATH within the year.
NU | Long | Earnings Growth Outlook | (April 2025)NU | Long | Post-Liquidity Grab + Earnings Growth Outlook | (April 2025)
1️⃣ Short Insight Summary:
NU Holdings has been climbing steadily after grabbing liquidity from key levels earlier in 2024. With strong fundamentals and a potential channel breakout, the setup looks favorable for upside continuation.
2️⃣ Trade Parameters:
Bias: Long
Entry Zone: Watching around $10.80 for potential compounding
Stop Loss / Invalidation: Below $10
TP1: $13.00
TP2: $14.50
TP3: $15.00
✅ Trade structure favors compounding near key supports, with partial take profits along the way.
3️⃣ Key Notes:
🔹 Fundamentals:
🔹Revenue: SEED_TVCODER77_ETHBTCDATA:10B
🔹Net Income: SEED_TVCODER77_ETHBTCDATA:2B
🔹Market Cap: $54B
EPS & Revenue Growth: Expected to increase significantly over the next few quarters and into the coming years.
NU is showing strong financials for a fintech player in a growing market, and forward-looking earnings per share (EPS) projections are bullish. These factors support a longer-term accumulation strategy.
🔹 Technical Setup:
Liquidity was swept from both the January 2024 lows and the February 2024 levels, clearing out weak hands. Now, NU is trading within an ascending channel and could be preparing for a breakout. Key resistance areas are marked at $13 and $14+, and a clean move above these could open the door to $15+.
🔹 Macro View:
As long as market sentiment holds and fintech sector strength continues, NU has the potential to outperform. Still, invalidation below $10 would signal caution, and that’s where risk should be tightly managed.
4️⃣ Follow-up Note:
I’ll be watching for more confirmation and price behavior near $10.80 for a possible compounding opportunity. Updates will follow if structure or sentiment shifts significantly.
Please LIKE 👍, FOLLOW ✅, SHARE 🙌 and COMMENT ✍ if you enjoy this idea! Also share your ideas and charts in the comments section below! This is best way to keep it relevant, support us, keep the content here free and allow the idea to reach as many people as possible.
Disclaimer: This is not a financial advise. Always conduct your own research. This content may include enhancements made using AI.

NU - Updated analysis and how to build a position hereWe already at pretty attractive levels to be building a position on NU but it may get even better. We should see some intentional movement in the coming days to allow for big money to enter as well.
Something to keep on the watchlist for sure because one good earning report or news report and this is a $20 company easily.
Happy Trading :)

Update and Opportunities on FVRR and NU after earnings missesDefinitely playing out as expected on these charts (especially considering earnings lightly missed) so seeing these as opportunities to get into great growth companies at a nice discount.
Happy Trading :)

$NU will be 15+ before end of FY 2025- This bank has phenomenal growth, expanding TAM in latin america.
- Numbers speaks for themselves, It's poised for success for rising middle class consumers in latin america.
- Digital Banking will provide immense value in latin america where typical banks were the only way to do banking in the past.

NU straight up since add.NU is one of the fastest growing companies in South America. Look at the revenue growth in the earnings tabs. It showed strong support near the $10 area I felt it was oversold so I bought a lot of shares and synthetic longs. There is still a lot of upside to this one new highs will come but I expect a few pullbacks as we get there. I'll be shocked and hedged if we ever see $10 again.

NU Stock Analysis for Jan 31, 2025Technical Analysis (TA) Summary
* Trend: NU is in a short-term uptrend with a rising channel as seen in the chart.
* Key Support Levels:
* $12.80: Strong support near recent price action.
* $12.39: Intermediate support in case of a pullback.
* $11.85: Critical support and potential stop-loss area.
* Key Resistance Levels:
* $13.55: Immediate resistance, aligning with the upper channel trendline.
* $14.00: Next potential breakout target.
* Indicators:
* MACD: Neutral momentum; awaiting cross signal for clarity.
* Stoch RSI: Overbought but still holding strength. Watch for cooling off.
Gamma Exposure (GEX) Insights
* Options Sentiment: GEX remains positive, with 34.3% of open interest leaning toward CALLs.
* Significant Walls:
* Call Wall: $14.00 - Bullish resistance; needs volume to push through.
* Put Wall: $11.50 - Strong downside protection level.
Trade Plan
1. Bullish Scenario:
* Entry: Around $13.00 on pullbacks with a tight stop below $12.80.
* Target 1: $13.55.
* Target 2: $14.00 (breakout potential).
2. Bearish Scenario:
* Entry: Below $12.39 (breakdown confirmation).
* Target 1: $11.85.
* Stop: Above $12.80.
Options Trade Suggestion
* Bullish Play: Buy $14 Calls (Feb expiry) if price sustains above $13.00 with volume.
* Bearish Play: Buy $12 Puts (Feb expiry) if price breaks below $12.39.
Directional Thoughts
* NU shows strong buying pressure at current levels, but overbought conditions could result in short-term consolidation. A break above $13.55 confirms bullish continuation toward $14. Monitor volume for follow-through.
Disclaimer:
This analysis is for educational purposes only and does not constitute financial advice. Price levels may change; traders should adjust according to pre-market data. For questions or more details, please PM me.

LONG NU @ 12.53 - patience is a virtueThis one has been a little temperamental lately, and can take some time for the trade to work out when it is, but ultimately still has a perfect record (79-0) of coming through after a buy signal since it went public near the beginning of 2022. It has also been in an almost 2 year long uptrend and trading strong stocks improves my odds dramatically.
However, I'm always a bit more skeptical when I trade stocks with short trading histories, and 2 years is short for me, but in the end I just trust my numbers. And this one has pretty good ones.
Its average daily returns have been top quartile for me, returning an average of about .20% per day held. That's close to 4.5x the long term average daily return of the S&P and almost double the daily return of the of the market this year, which has been a VERY good one for the market.
Average hold has been about 3 weeks but that's skewed longer by a couple of long trades. The median trade length is 1 day, so having a 50/50 shot at this being a 1 day trade and the vast majority taking less than a week makes it worth the risk of tying up capital for longer.
Per my usual strategy, once I'm in I'll add at the close on any day it is still given a buy signal by my algorithm, and I will use FPC (first profitable close) to exit any lot on the day it closes at any profit.
As always - this is intended as "edutainment" and my perspective on what I am or would be doing, not a recommendation for you to buy or sell. Act accordingly and invest at your own risk. DYOR and only make investments that make good financial sense for you in your current situation.

Bull flag still in formation- NU makes great opportunities to go long for swingtrade
- Wedge/Bull flag needs to mature some more
- Several gaps unfilled, particularly October lows will push price further down to ~9.5 area
- As always, patience and proper timing is key

NU might be worth a look~$10 stock looks like it might be heading back up. MACD showing value area with a cross showing momentum could be coming back in.

I am calling NU's bottom from hereGreat company fundamentals and great management. I fully believe price will return to the 14-16 range in S1.
Their expansion is LATAM is notable.

NU | Nu Holdings Ltd.Disclaimer:
This is not financial advice. Please do your own research or consult with a financial advisor before making any investment decisions. Investments in stocks can be risky and may result in loss of capital.

NU - Strong long term fundamentals but uncertain near termIncredible growth from NU over the past few quarters but tough outlook ahead as Brazil's economy (NU's main market) is not the strongest right now.
Still worth looking at this company as a longer term investment!
Happy Trading :)

Will Joey help NU push on, or will they need even more Friends?NYSE:NU has had a good run rising 50% last 12 months, however since releasing positive earnings a month ago the share is down 25%. Among reasons for this is that the AR per customer has dropped from all-time-high of $11.40 to $11 in the last two quarters. Also, they are struggling to attract high(er)-income customers, having their fair share of customers in the low-income bracket. In their key market Brazil, a whooping 56% of the adult population has a credit card from Nubank ( NYSE:NU ’s brand), accomplished in just 10 years. However expansion into other markets is proving difficult, and the company is facing headwinds in Mexico. The somewhat known investor Warren Buffet is an investor, and he recently sold 20% of his share in the company. This could just be rebalancing after a good run but is worth mentioning.
Technically the stock is not looking its best at the moment. After a steady growth pretty much since January 2023, we have now seen a steeper correction than usual (on the daily chart). Price has dropped from an ATH of $16.15 to currently $11.99. This meant price dropped below the support of the rising baseline and is now in consolidation. This consolidation can be viewed as a bearish rectangle, indicating a potential break to the downside of the rectangle. Should this happen, there is some support around $10.50 with next support at $8.50. Should price however break to the upside, the mentioned baseline will serve as resistance. The stock is approaching oversold levels on the RSI, and we have seen bounces in such situations before, however the drop before has been steeper this time.
Fundamentally I believe the company might have hit if not a wall, then some serious obstacles in expanding their business, both at home in Brazil and internationally. Key numbers are rising, and this might be a sign to the upside potential, if they can be maintained and reached. Technically it looks bad in my view. I believe price will break to the downside of the rectangle and have my eyes on $8.50. On the 4H chart we saw a brief break to the upside of the rectangle, but price very quickly retreated down.

12/2/24 - $nu - Bot $12, load closer to $10 if/when (LONG)12/2/24 :: VROCKSTAR :: NYSE:NU
Bot $12, load closer to $10 if/when
- is one of the three stonks in latam that i've commented in the past is worth keeping a v close eye on b/c of the growth rates and tremendous product. the others are NASDAQ:MELI and NASDAQ:DLO (the latter of which worked out nicely and we made a good exit earlier this year from the lows, but it took a minute).
- back to Nubank:
1/ brazil in earlier innings of economic funeral, but what's new this happens every so often and those battle tested growers tend to come out of these events eating massive share, Nu will be one of these
2/ timing is always the tricky thing. you want to take calculated risk, but unlike the US stonks, you have clear geo/ FX and therefore adverse flows risk to consider. invest in emerging mkts and you need to have a tolerance/ knowledge of currency risk, minimally. i'm not going to downplay that here, but only to flag this needs to be something you consider if/when considering a stake in $nu. the counter point is they're growing bananas outside of Brazil as well and likely take over pretty much over every other latam country similar to Meli. IMO, there's no competition for the growth engine they can export into latam.
3/ let's math and use two approaches... PE and ROE -> book value
a1. PE: let's imagine the 62c next year (in USD) is 50c - only a 15% growth. the reason you'd look at this is b/c most investors r going to be focused here, so you stand the chance of risk-evaluating what others see and making a call (similar to support and resistance vs. some esoteric TA you've developed). in this vein, what would you pay for a 15% EPS grower (ignoring all other factors of what this biz is and only considering it's a bank in Latam)? maybe 10-12x? def sub 1x PEG. b/c it's brazil, brazil is currently fukt. so you put a "depressed multiple" on a depressed EPS. at call it 50c and 10x - you're at $5 bucks. sick downside from the $12 it closed at today. so that's probably *worst* case, from today's POV. let's call that -60%. diddy slip and slide party pain.
a.2: PE: but this isn't some "new kid on the block". a lot of Nu investors are smart int'l types that are going to look beyond trough '25, even today, including papi warren B. so if we assume we pick up from 15% toward 20% the following year and go 50c -> 60c, you'd probably start to consider at that point at least a PEG of 1x given growth would extend to the following yrs as well. at 20x on 60c you're at $12 for year-end '26. and let's give it a 15% discount (Ke brazil finger in air - but likely in the ballpark) and you get to $10 and change for the 12M view e.g. YE25, which is the bogey we're all looking at today given we're already done w/ '24. so that's 20% downside.
combining a.1 and a.2 above... i'd likely weight a.2 as being perhaps a 70% and a.1 as 30% given the logic described, investor base and this isn't some going concern issue. also i'm being mega conservative w/ my EPS estimates as well. if you haven't noticed, they keep ripping the cover off the ball on EPS. so combined that's -60%*30% + -20%*70% = 33% downside more or less or a $8 stonk.
b: ROE thinking. 25% ROEs (probably expanding) and growing book at probably ~$1/shr for the next 2 yrs combined gets you to a book of $5. when you consider this likely continues to grow nearly 15-20% a year... and we could be conservative and say it's 10% a year (cut it more than in half)... at a 15% Ke you get:
Price = BookVal * (ROE - g)/(Ke - g) then discount 2 yrs by 15%.
this is Price = $5 * (25 - 10)/(15 - 10)/1.15/1.15 = $11+ today.
tying this all together... fair value is probably between 10 and 11 today. so buying $12 is defn being a bit opportunistic and playing a reversion move on BRL related assets. i'd not be surprised to see this thing move back toward $13/14 into year end, and equally i'd not be surprised to see it test the big green dilly from Aug 5 this year that ripped thru $10.
So, it's not an obvious trade for those who don't know this asset or haven't been following that closely. perhaps easier to wait for better entry even if that means some chop here/ there and you get a bit of fomo if first move is up.
The way i'm personally playing it are $10 and $11 strike 2027 leaps. allows me to amp my exposure without necking out too hard on a notional cash-in basis. offers about 3-1 leverage, so a 1.5-2% options position gets me a gross effective of about 5-6%. that's comfy for now. i'd like to get this position closer to 10-15% if/when we hit the $10s area or below (and it will be one to manage b/c *WHY* we go there will matter a lot - not just a rote plan, these things always evolve and perhaps there are other better deals out there too esp in the US or my favs NASDAQ:NXT , NYSE:TSM , NASDAQ:META ).
anyway. wanted to flag. should be on your radar. this is a quality LT compounder that's gotten cheap b/c of geography, but is a neo-bank virus to the existing dino's in latam.
LMK what u think or esp if u see it differently.
have a good week my friends
V
