Time to go long on $LUV$LUV bottomed out in early July, now has been on a steady bullish run. Expectedly It met with some resistance at $37.5 level (and closed below it today). Overall, it has formed a domed bottom, and likely will form a "cup-and-handle" pattern. I expect this stock to recover to the mid $40 range in a few months.
S1OU34 trade ideas

$LUV is $36.97. Price Target Hit. Great HPS Trade.$LUV is $36.97. Price Target Hit. Great HPS Trade.


LUV at Weekly SupportAfter breaking though the daily trendline, recent support at ~38, and closing below the 50/200 SMA on the weekly and daily respectively. I will be watching the nearest daily support level for signs of strength or weakness. Any closes below this level could see a much greater pullback as this is a more significant support on the weekly chart. Any ideas/opinions/criticisms are welcome.

Stochastic Pop and Drop Strategy - Jake BernsteinHere is another strategy code for Jake Bernstein's Stochastic Pop and Drop.
Follow the link -
Unfortunately, I do not have any videos on how to use these, The Link for reference posted with the Script will give you enough information to trade.
Enjoy...
UCSgears

Airlines share the LUVBounded up to all time highs on strong earnings, every indication that this sector is not finished yet. Take advantage of high premium with covered call

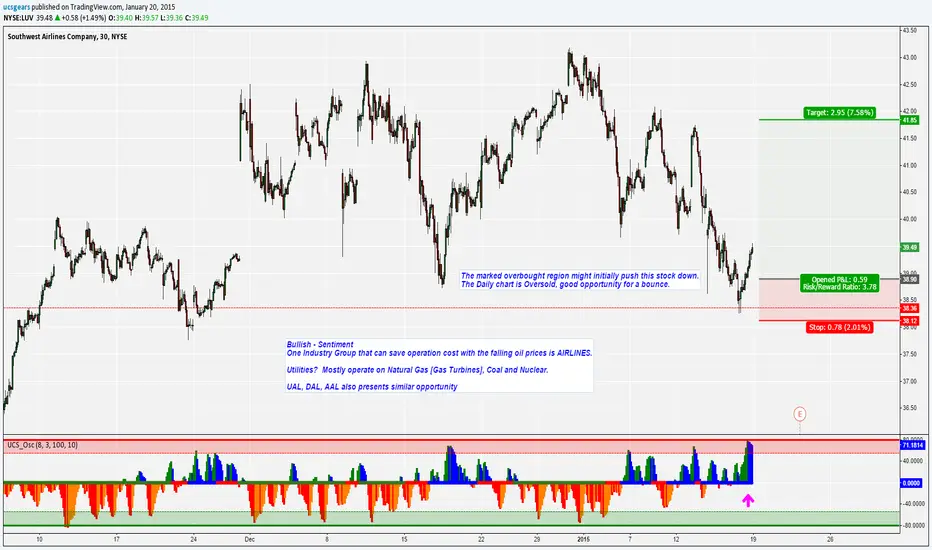
LUV - The upside for a bounce (Pure Technical Setup)Airlines are flying high, Time to short? absolutely not. Are there divergences? Yes. Is there weak trend? Absolutely on the overall industry group. Will this be a short, Not until the Oil prices finds its bottom.
Yes, this may have trouble flying to new high, if the market is capped with current level. The Usual suspects for the current weakness is from the Sensitive sectors, Techs, Industrial and Energy. Remember these are important, with 40% weight on SPY and 60% weight on QQQ.
Before i get diverted, The next bull mode in SPX/QQQ the airlines are to be watched for.
Also keep an eye on their earnings as it unfolds. FYI - Earning on LUV is 1/22

LUV AND USO JOINED AT THE HIP.LUV consoladiting as oil looks for a bottom. Two classic indicators have been diverging for a while. As oil goes LUV will trade the opposite direction. Major trend for luv is still strongly positive. And USO strongly negative,

LUV still in an uptrendI posted on LUV on 1st December and I was triggered into a long position the same day.
Since then it's been going sideways and appeared on our Gap & Go list this morning. This isn't a Gap and Go opportunity as the last bar has stayed within the small range. And it isn't a buy opportunity either (based on the last bar). But I am already long this stock and, so far, there is no reason for me to exit this position.
At the moment LUV is still very much in an uptrend. The current pullback isn't too deep and has only been a few bars. I am happy to let this position play out. Trades don't always immediately go your way. Let's see what develops.

LUV gaps up above $40LUV has been a good trending stock I have traded until the October pullback earlier this year.
Breaking above the September high (and confirming a cup and handle chart pattern) offered the first opportunity to re-enter this stock. But with some uncertainty still in the markets I passed this one by.
Since then price has continued its bullish rise with a more recent pullback/flag with plenty of indecision candles. But with Friday's gap up, above the pivot high, above $40, and on higher volume this is a positive buying set-up.
This looks good for either a near-term or long-term trade. I will be entering this trade on the next set-up.

Southwest Airlines Co (NYSE:LUV): Tails Signal TopSouthwest Airlines Co (NYSE:LUV) has a topping tail on the daily from Tuesday. In addition, today it initially shot higher, testing the recent highs from Tuesday, then sold off sharply. This created another tail on the daily chart. This shows institutional sellers are meeting retail buyers. Considering the stock is up over 40% in less than a month, the probability of a sell off is above 80% here.
Gareth Soloway
Chief Market Strategist
www.InTheMoneyStocks.com

I jumped the gun firstUsing 15min timeframes, my put options triggered at 39.8. It's considered shooting star.
Another big red marubozu tonight at closed would be a good evening star and RSI would give a bearish divergence
MACD lines too widely apart, needs to be shut.
I might be wrong.

Southwest Breaks Out AgainSouthwest will benefit from lower oil prices and the continued recovery of the american economy. It is well managed with a good balance sheet and expanding with the integration of AirTran. Conviction buy for growth at a reasonable price. Technically speaking it has made a strong recovery from the recent turmoil and still shows strong momentum. My stop is placed at the SuperTrend point just under $30, if you prefer a tighter stop then $33. I don't like to set price targets but I will update this pick when I sell.

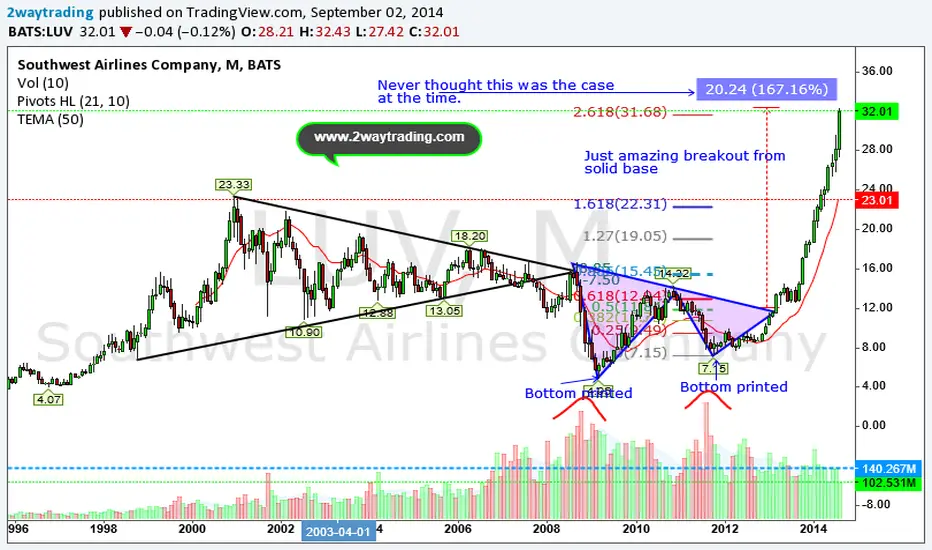
How high will it keep going? Maybe time to short it!When the trend is strong, and buyers keep coming, short sellers get burned. Year to date up 70%, every metrics u check it only tells you more upside is coming ROE, ROI, ROA not great but compared in the industry seems the best. The price is above 35% from its 200sma rare to see in the market. Short sellers stayed away from this as they get burned again and again last few years and now only 2.2% short interest compared 37% of $BBRY. On March 2013 we made a call about the breakout from the solid base but never expected more than 25% move..Just woow! If u want to get a real time alerts checkout www.2waytrading.com
SOTHWEST... SHOULD BE NORTHEAST B/C THAT's WHERE IT's GOING!LUV has been going up since 12/2012 and it doesn't seem to know how to quit. It is on a landslide run and its major support is the 50 day EMA.
It is showing a little bit of weekness right now so a pullback close to 28 would be a good entry point into this one. I have no reason to believe that this uphill sprint will fail anytime soon. 6/26

Still loven' LUVFinally made it over trend resistance and into what I hope is a new bull session.
The technicals aren't perfect, but history doesn't care. Still up in all time highs with more room to grow, if patterns stick I'll have more option money in June.
I think it's possible we could drop back into the previous zone, the volume is not yet there and I'm interested in what Friday may hold before going full throttle.
I'd also recommend generally ignoring the latest news on Southwests' Advertising faux pas p.pw , definitely doesn't look great, I don't think it'll really effect share price.
Id addition, The Street analysts are generally bullish;
"The stock currently has a dividend yield of 0.93%. The company has a P/E ratio of 21.7. Currently, there are 9 analysts who rate Southwest Airlines a buy, 2 analysts rate it a sell, and 2 rate it a hold." p.pw
Set your stops and hope for a Redbull (punny!).
- - - - -
All opinions expressed by Emuffn3 on this website are solely Emuffn3’s opinions and do not reflect the opinions of TradingView, or their affiliates. You should not treat any opinion expressed by Emuffn3 as a specific inducement to make a particular investment or follow a particular strategy, but only as an expression of his opinion. Emuffn3’s opinions are based upon information he considers reliable, but neither TradingView nor its affiliates and/or subsidiaries warrant its completeness or accuracy, and it should not be relied upon as such. Emuffn3 is not under any obligation to update or correct any information provided on this website. Emuffn3’s statements and opinions are subject to change without notice.
Past performance is not indicative of future results. Neither Emuffn3 nor TradingView guarantees any specific outcome or profit. You should be aware of the real risk of loss in following any strategy or investment discussed. Strategies or investments discussed may fluctuate in price or value. Investors may get back less than invested. Investments or strategies mentioned on this website not be suitable for you. This material does not take into account your particular investment objectives, financial situation or needs and is not intended as recommendations appropriate for you. You must make an independent decision regarding investments or strategies mentioned. Before acting on information on this website, you should consider whether it is suitable for your particular circumstances and strongly consider seeking advice from your own financial or investment adviser.
Cheers!~
& Happy Trading!


Ratio chart warning for LUV long term investorsAlready overextended. Look olso at longer time ftame. GOOD LUCK

Southwest overboughtSouthwest is having a really difficult time breaking 14.70 and it is near the peaks on the weekly chart.
It has made new highs, but given the overbought signal on the stoch and this recent difficulty to push higher I believe a short play with a stop around 14.85 is in order.
HAPPY TRADING!

Still no love for LUVMy previous LUV chart failed with a very little loss. But the idea is the same. Look on the weekly charts and you will see how this pattern is copying a previous pattern starting in Oct with similar highs. It is now testing a stronger resistance zone than my previous chart and formed a dark cloud cover at this zone.. Cover around 12. Happy trading.

