SPOTIFY-Turn the Music Up!NYSE:SPOT
Why did profit drop?
Spotify reported an operating loss of $75M — at first glance, that looks bad. But there’s logic behind it:
• Increased spending on marketing and podcast development (long-term investment)
• Higher royalty payments — short-term pressure
• Expansion of features and product offerings — costs now, growth later
What’s good?
• Revenue up 17% YoY — Spotify keeps growing steadily
• Premium subscribers +14% — user base continues to expand
• Streaming cost per user is decreasing
• Podcasts and audio ads growing faster than expected
• Announced $1B share buyback program
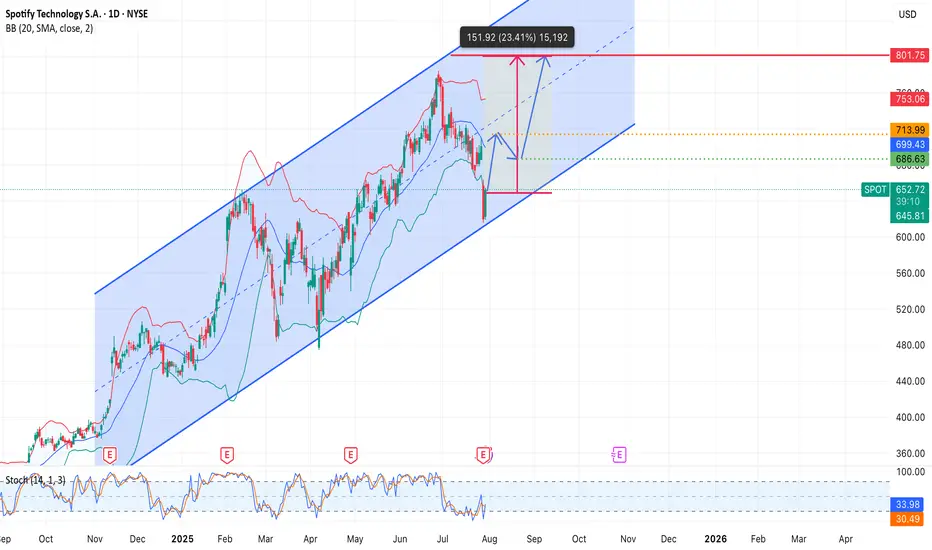
Technically:
• Bounce from the bottom of the rising channel — strong support
• Upside potential to $800 (~+23%) if trend holds
Spotify is investing in growth. Yes, it hurts earnings now, but markets care more about direction than past numbers. And right now, the arrow points up.
S1PO34 trade ideas
ShortifyI don't post all my trade ideas ahead of time but I will share another short position that I executed before posting, this time in Spotify.
Short entered at $770, stop lost at $790.
Added to my position when we lost the monthly level of support.
The end of the 5 Wave Supercycle.
Trailing stop loss, I don't like shorting solid companies but this one got overextended.
I am short several positions, including Palantir, DuoLingo and commodities like cocoa.
Not financial advice, do what's best for you

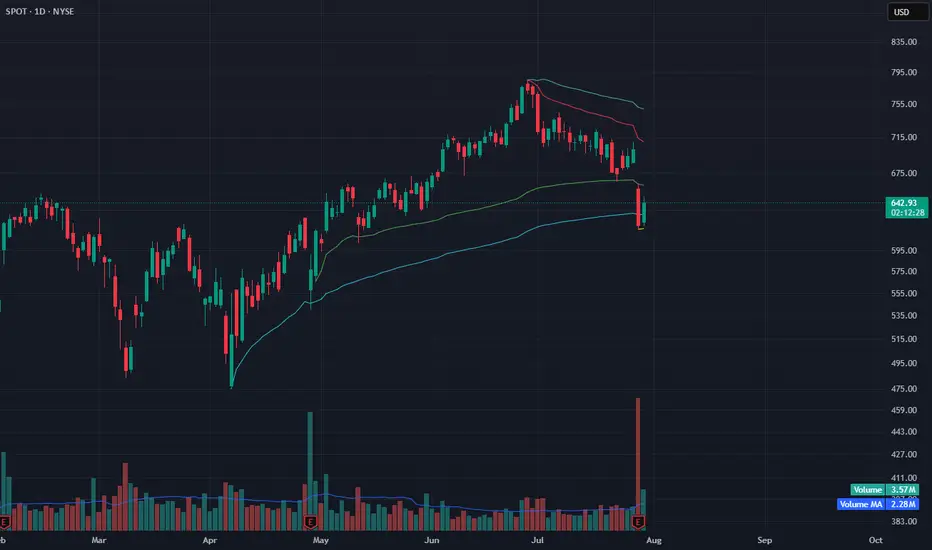
SPOT Reversing at VWAP Support – Signs of Seller ExhaustionAfter a sharp drop, SPOT is showing early signs of reversal at a key anchored VWAP support zone. The intraday bounce occurred on low volume, which may indicate seller exhaustion rather than aggressive dip-buying.
Price is holding near the blue VWAP anchored from the April low, a level that previously acted as dynamic support. Although today’s bounce lacks volume strength (3.53M vs. 2.28M MA), the selling pressure appears to be cooling off.
If SPOT can reclaim $665–670 in the coming sessions with improving volume, a recovery toward $700+ is possible. However, failure to hold above $640 may resume downside momentum.
Indicators used:
Anchored VWAP (support holding from prior pivot)
Volume (low, signaling possible seller fatigue)
Price structure (early reversal after steep correction)
Entry idea: Watch for reclaim of $665
Target: $700–715
Stop: Below $638 or new low
Raising the bar for SpotifySpotify has been my favorite stock so far this year. Primarily because resilience in uncertain economies. Subscription-based services, especially freemium models, are seen as defensive. Spotify is the number one music streaming service in the world and unless that changes people will keep using it every single day in their lives.
They will generate revenues based on advertisements and subscriptions which are in my opinion reasonable and conducive of a strong business model. I am raising my price target to $985. This is not unreasonable considering the intrinsic value of the stock is between $400 and $2900. I am confident Spotify will find ways to stay ahead of its competitors and dominate the music streaming industry. While keeping its customers happy and loyal.
Spotify's Valuation Is Red-Lining (Rating Downgrade)📈 Spotify's Remarkable Comeback
Spotify NYSE:SPOT has transformed itself from a money-losing audio platform into a disciplined, profit-generating tech firm. Through smarter podcast investments, layoffs, and better monetization strategies, the company recently swung from red ink to positive free cash flow and strong earnings — a major shift for long-frustrated shareholders.
This operational turnaround helped fuel a massive rally: Spotify shares have surged nearly 140% since May 2024.
💵 Financials Look Strong... for Now
Revenue jumped from $15 billion to $17.4 billion over the past year — a 16% increase. Spotify also improved gross margins from 25% to 31.6%, while net margins turned positive at 7%. Bottom-line earnings exploded from a $119 million loss to $1.25 billion in profit.
These gains came from several smart moves:
- Reduced payouts to creators (from 75% to 70%)
- AI-generated content, like white noise playlists, cutting royalty costs
- Ad growth in podcasts and better ad tech
- Higher efficiency in infrastructure and operations
Analysts now expect Spotify’s earnings to grow another 74% this year, 45% in 2026, and 30% in 2027.
💰 But Valuation Is Stretched
Despite the impressive financial performance, Spotify's stock appears overheated. It now trades at:
117x trailing earnings
71x forward earnings
37x estimated 2027 earnings
These multiples are far above historical norms — and could spell trouble if growth slows even slightly. The company is running out of levers to improve margins further, and rising operational costs may start to weigh on profits.
Spotify also trades at its highest-ever price-to-sales ratio, indicating elevated investor expectations. If the company underdelivers, the stock could face a significant correction.
⚖️ Our Take: Time to Hold, Not Buy
We still believe in Spotify's long-term story. Its subscription model, improving margins, and global scale offer compelling advantages. But after this big run-up, the stock no longer offers favorable risk-reward.
We’re downgrading from "Strong Buy" to "Hold", suggesting investors with gains may want to trim positions and wait for a more attractive entry point.
📌 Bottom Line: Spotify has executed well — but the stock price now reflects near-perfect performance. A pause, or pullback, wouldn’t surprise us.

Bullish Strength candle close above Bollinger Band midline.Nice price cross over and close above the midline of the Bollinger Band. Long entry at open on 7/7/25. Expecting volume to follow thru with average or even better above average on green candle. Target is upper BB line and then $785. This could happen fairly quickly in the bull market.
As always, because I like to catch the momentum thrust, I will be looking at call options.
Good luck

Take a bullish position as price action shows momentumCurrent Price: $772.60
Direction: LONG
Targets:
- T1 = $795.00
- T2 = $810.00
Stop Levels:
- S1 = $755.00
- S2 = $735.00
**Wisdom of Professional Traders:**
This analysis synthesizes insights from thousands of professional traders and market experts, leveraging collective intelligence to identify high-probability trade setups. The wisdom of crowds principle suggests that aggregated market perspectives from experienced professionals often outperform individual forecasts, reducing cognitive biases and highlighting consensus opportunities in Spotify.
**Key Insights:**
Spotify demonstrates strong potential as a leading innovation-driven company within the tech and digital entertainment space. Its continued audience expansion, effective monetization strategies, and increased global adoption have positioned it as a compelling investment opportunity. Recent market trends reflect investor confidence in Spotify’s ability to sustain growth, driven by its technological advancements and strategic initiatives. Furthermore, expanding the podcast segment and improving advertising monetization have generated complimentary revenue streams, indicating higher profitability outlooks.
A current focus on market share expansion in previously underserved regions also highlights strategic innovation that could strengthen Spotify's valuation over time. The company's strategies align with macroeconomic trends emphasizing digital solutions in entertainment consumption.
**Recent Performance:**
Spotify has recently experienced upward momentum, mirroring the broader strength seen in growth-oriented tech stocks. Its quarterly improvement showcases robust investor interest supported by healthy subscription growth figures. The $772.60 price level underscores resilience, especially in the face of uncertainties across broader equity markets. Spotify’s ability to maintain consistency despite broader market fluctuations adds credibility to long-term investment prospects.
**Expert Analysis:**
Technical analysts note the breakout above resistance levels last week and emphasize Spotify’s rising momentum as a reason to consider bullish positions. Notable moving averages suggest increasing buying pressure, supported by confidence in the broader earnings cycle. Financial experts consistently rank Spotify as a strong portfolio addition for growth-oriented strategies amidst ongoing technological tailwinds.
While price volatility is still present, technical indicators such as RSI in the mid-60s confirm bullish sentiment without the risk of overbought territory. Furthermore, rising institutional interest reinforces this momentum, as Spotify continues outperforming in its niche markets.
**News Impact:**
Spotify's increasing focus on AI-enhanced content recommendations and partnerships with major artists has positively influenced sentiment in recent weeks. Market analysts highlight the expansion of geographical content delivery as a key driver of customer acquisition. These achievements strengthen its fundamentals, with news cycles reflecting optimism from investors aligned with global digital growth themes.
**Trading Recommendation:**
Spotify offers a bullish opportunity, backed by key growth strategies and improving fundamentals. Investors should consider long positions, aiming for price targets of $795.00 and $810.00 while placing protective stop levels at $755.00 and $735.00 to mitigate downside risks. Spotify's innovative approaches and market positioning make it well-suited for those seeking exposure to growth-focused tech equities.

Spotify is the most beautiful chart of the yearI made chat GPT write this because i was too lazy;
ps. (The intrinsic value for the stock right now is between $400 and $2900)
Q. Why is Spotify stock doing so good this year.
A.
1. First-ever full-year profit in 2024
Spotify swung to a €1.1 billion net profit in 2024—its first annual profit—on the back of cost-cutting, layoffs, and effective pricing. Margin improvements (gross margin hit 30–32%) and leaner operating expenses fueled this turnaround.
2. Robust user growth and pricing power
Monthly Active Users (MAUs) rose 10–12% year-over-year to roughly 675–700 million, with 263–268 million premium subscribers
Spotify has successfully raised subscription prices—and free users haven't objected, demonstrating strong loyalty and pricing resilience.
3. Diverse revenue mix
Spotify’s expanding beyond music—podcasts, audiobooks, video podcasts, and AI-powered ad tools are creating new monetization channels. Podcast ad tech and AI-enabled features like “AI Ads” and smart playlists enhance advertiser value.
4. Analyst upgrades and bullish sentiment
Pivotal Research just raised its price target to $900, praising Spotify’s dominance in audio streaming, user-friendly UI, under‑penetrated global markets, and ad business improvements. Evercore ISI and others raised targets to near $750 and reaffirmed outperform ratings. Most analysts rate SPOT a Buy.
5. Strategic partnerships & scalable economics
A renewed deal with Universal boosted confidence in Spotify’s content licensing and pipeline. Hedge fund accumulation and strong ROI (ROIC ~23%) reflect effective capital use.
6. Resilience in uncertain economies
Subscription-based services, especially freemium models, are seen as defensive in slower economies. With strong retention (“stickiness” due to loyalty and seamless experience), Spotify keeps users even with higher prices.

SPOT Weekly Options Trade — June 15, 2025🎧 SPOT Weekly Options Trade — June 15, 2025
💡 Ticker: SPOT
🎯 Strategy: Bullish Swing — Call Option
📅 Expiry: June 20, 2025
⏱ Entry Timing: Market Open
📈 Confidence: 70%
🔍 Analysis Summary
All four models (Grok, Llama, Gemini, DeepSeek) indicate strong bullish momentum on SPOT based on:
✅ Above all key EMAs (5-min and daily)
🔁 Bullish RSI, MACD, and Bollinger Band alignment
📢 Catalyst: Evercore ISI upgrade to $750
📊 Notable call open interest in OTM strikes
⚠️ Max Pain: $665 — a known drag, but outweighed short-term by momentum and the upgrade catalyst.
✅ Recommended Trade
🛒 Trade Type: Long CALL (Naked)
🎯 Strike: $740
💵 Entry Price: ~$4.25
📅 Expiry: June 20, 2025 (Weekly)
📈 Profit Target: ~$8.50 (100% gain)
🛑 Stop Loss: ~$2.10 (50% loss)
🔍 Why $740? It's the sweet spot between DeepSeek’s speculative $780 and Grok's expensive $725—offering leverage with decent odds.
⚠️ Risks & Watchouts
🧲 Max Pain gravity at $665 — may cap gains closer to expiry
📉 Rejection at $714–$718 resistance range
🌪 Elevated VIX = potential for wide intraday swings
📏 Stick to small sizing (risking <2% of portfolio) due to premium volatility
🎯 Bottom Line: Strong bullish setup, solid catalyst, and technicals support a move higher. Enter on strength near open, manage tightly, and take profits on a double.

Spotify: Target Zone AheadSpotify has already come quite close to our turquoise Short Target Zone (coordinates: $725.67–$829.30). In our primary scenario, we continue to expect further upside in the near term, as the projected peak of wave B should materialize within this zone—a range that could present opportunities to lock in long-side gains or initiate short positions. Once the top is in place, we anticipate a more pronounced downward move. The focus then shifts to the magenta Target Zone (coordinates: $452.69–$390.93), which we consider a potential accumulation range for new long positions. That said, we’re also monitoring an alternative path, currently assigned a 36% probability. In that scenario, magenta wave alt.(5) would already be underway—meaning prices would bypass the magenta zone altogether.
📈 Over 190 precise analyses, clear entry points, and defined Target Zones - that's what we do.

Spotify's Bullish Momentum Indicates Upside Potential
Direction: LONG
Targets:
- T1 = $733.63
- T2 = $747.89
Stop Levels:
- S1 = $700.02
- S2 = $692.45
**Wisdom of Professional Traders:**
This analysis synthesizes insights from thousands of professional traders and market experts, leveraging collective intelligence to identify high-probability trade setups. The wisdom of crowds principle suggests that aggregated market perspectives from experienced professionals often outperform individual forecasts, reducing cognitive biases and highlighting consensus opportunities in Spotify.
**Key Insights:**
Spotify's recent developments signal strong bullish potential, backed by both technical strength and robust fundamental drivers. The company's moves toward content diversification, including exclusive podcasts and audiobooks, promise sustained user engagement and revenue growth. Moreover, Spotify’s partnerships with major record labels contribute positively to market sentiment, enhancing its competitive edge in the audio-streaming industry.
From a technical perspective, Spotify's price action suggests higher lows and consistent upward momentum, signaling robust demand among institutional and retail investors. Breakthroughs above key resistance levels have reinforced long-term bullish sentiment, paving the way for further growth opportunities.
**Recent Performance:**
Spotify stock has seen steady upward performance over the past week, supported by stronger-than-expected earnings reports and an increase in monthly active users. With notable improvements in premium subscriptions, the stock has gained traction, showing resilience against broader market fluctuations. Near-term volatility has remained moderate, offering an attractive setup for long-focused strategies.
**Expert Analysis:**
Market analysts maintain a positive outlook on Spotify, highlighting its ability to innovate within a competitive landscape of streaming platforms. Strategic investments in AI-powered audio recommendations have amplified user retention rates while differentiating its offerings in an increasingly saturated market. Technical experts also point to robust support levels in the charts, suggesting favorable conditions for sustained upward price movement.
**News Impact:**
Recently, Spotify announced advancements in playlist curation powered by AI technologies, significantly enhancing user personalization features. This aligns with growing consumer trends toward tailored entertainment experiences. Additionally, new licensing agreements with key record labels contribute positively to content exclusivity, attracting both creators and listeners. These factors bode well for future stock performance in the medium term.
**Trading Recommendation:**
Based on strong fundamental drivers, continued technical momentum, and positive market sentiment, taking a bullish position in Spotify at current levels offers a compelling upside opportunity. With clearly defined stop-loss and target levels, traders can optimize risk-to-reward ratios while capitalizing on Spotify's growth trajectory in the audio-streaming industry.

SPOT Breaks Out of Multi-Month Base Into New High Ground Spotify ( NYSE:SPOT ) is breaking out of a multi-month base into new all-time high territory. The structure is clean — a double bottom with three shakeouts and a volatility contraction on the right side, showing tight action before the move.
While recent earnings were underwhelming, the stock is being driven by a shift in narrative: Spotify’s push into audiobooks, AI content tools, and creator monetization is capturing investor imagination. This future-facing story, paired with improving user growth and strategic positioning, is outweighing short-term profitability concerns.
Volume is picking up as it clears resistance, relative strength is climbing, and moving averages are stacked bullishly. The broader risk-on environment is adding fuel to the move.
Trade Parameters:
Entry: 652.63 – 685
Stop: 623.87 – 608.59 (5–7% risk)
Target: 786.24 – 815 (2:1+ reward-risk)

SPOTIFY (SPOT) ... Time to cut the chord ??Technically Spotify is exhibiting weakness.
There is a clear Bearish Wolfe Wave pattern as well as an evolving Bearish Harmonic Cypher one.
Additionally RSI is exhibiting bearish divergence.
Certainly worth watching as WH Fake News tariff negotiations fail to materialize and consumers face increased costs and reduced incomes.
SPOT is definitely economically sensitive.
I would look to sell a break of the dotted line or a rally that is unsustainable.
Do your own due diligence. Not Investment advice.
This is a short time frame !
Good Luck
S.

Spotify’s Steady UptrendSpotify Technology has climbed steadily for several quarters, and now some traders may think it’s ready to extend the uptrend.
The first pattern on today’s chart is the new high in mid-February, followed by a double bottom on March 10 and April 7. The resulting W formation may signal continuation of the longer-term advance.
Second, SPOT just closed above its previous high. Does that confirm a breakout in the streaming-media stock?
Third, MACD is rising.
Fourth, the 8-day exponential moving average (EMA) crossed above the 21-day EMA last month. The stock subsequently rose above the 50-day simple moving average (SMA) and has stayed there since. Meanwhile, the 100-day SMA has steadily risen from below.
Those patterns may be consistent with bullishness resuming in the short and intermediate terms, while remaining intact over the longer term.
TradeStation has, for decades, advanced the trading industry, providing access to stocks, options and futures. If you're born to trade, we could be for you. See our Overview for more.
Past performance, whether actual or indicated by historical tests of strategies, is no guarantee of future performance or success. There is a possibility that you may sustain a loss equal to or greater than your entire investment regardless of which asset class you trade (equities, options or futures); therefore, you should not invest or risk money that you cannot afford to lose. Online trading is not suitable for all investors. View the document titled Characteristics and Risks of Standardized Options at www.TradeStation.com . Before trading any asset class, customers must read the relevant risk disclosure statements on www.TradeStation.com . System access and trade placement and execution may be delayed or fail due to market volatility and volume, quote delays, system and software errors, Internet traffic, outages and other factors.
Securities and futures trading is offered to self-directed customers by TradeStation Securities, Inc., a broker-dealer registered with the Securities and Exchange Commission and a futures commission merchant licensed with the Commodity Futures Trading Commission). TradeStation Securities is a member of the Financial Industry Regulatory Authority, the National Futures Association, and a number of exchanges.
TradeStation Securities, Inc. and TradeStation Technologies, Inc. are each wholly owned subsidiaries of TradeStation Group, Inc., both operating, and providing products and services, under the TradeStation brand and trademark. When applying for, or purchasing, accounts, subscriptions, products and services, it is important that you know which company you will be dealing with. Visit www.TradeStation.com for further important information explaining what this means.

Potential break and retest of ATH's on SPOT!OptionsMastery:
🔉Sound on!🔉
📣Make sure to watch fullscreen!📣
Thank you as always for watching my videos. I hope that you learned something very educational! Please feel free to like, share, and comment on this post. Remember only risk what you are willing to lose. Trading is very risky but it can change your life!

Super Performance CandidateNYSE:SPOT , displaying market dominance, consistent user and revenue growth
Given with its recent earnings report and immediate market environment, prices sustained to attractive levels displaying institution appetite for risk.
With a RS Rating of 98,
I have reasons to believe this security price could increase

$SPOT Facing Resistance at 627–652 with Key Support at 484 UnderSpotify’s weekly chart shows a peak around the 627–652 range, where price action has failed to break through multiple times. This lack of upward momentum has left NYSE:SPOT vulnerable to potential downside. At the moment, 484 serves as an important support level. If it fails, it could open the door to a deeper pullback, possibly towards the 380–320 zone. Even if the price moves above 627, caution is advised, as there’s no solid signal for a sustained upward trend yet.

Spotify stock falls more than 11% after earnings releaseSpotify's stock has shown significant price weakness and is now trading below $600 per share, shortly after a large bearish gap formed following the release of its quarterly results. The company reported earnings per share of €1.07, below expectations of €2.13 per share. Additionally, Spotify projected operating profit for Q2 at €539 million, under the market estimate of €557 million. The earnings miss and weak forward guidance have led to persistent bearish pressure, triggering strong selling momentum in the short term.
Uptrend Weakens:
Spotify has been in a consistent uptrend since around November 2022. However, in recent months, buying pressure has failed to push the price to new highs, with the stock now trading in a lateral range that signals a period of price consolidation. If the uptrend continues to stall, this neutral phase may extend in the short term.
ADX:
The ADX line has started to show early signs of neutrality, hovering around the 20 level. This indicates reduced volatility over the past 14 trading sessions. If ADX remains in this range, it suggests that price neutrality could persist.
RSI:
A similar condition is seen in the RSI, which has reached the neutral 50 zone—where bullish and bearish momentum are in balance. This reinforces the neutral sentiment and may support continued sideways movement in upcoming sessions.
Key Levels:
$640: The most recent high. A breakout above this level could signal a continuation of the long-term uptrend.
$540: Current support level, aligned with the 100-period simple moving average. Stability here may support ongoing consolidation.
$480: Major support at recent lows. A bearish move back to this level could trigger a fresh selling trend in the short term.
Written by Julian Pineda, CFA – Market Analyst

Spotify Tunes Up for Q1 EarningsSpotify heads into this week’s earnings update with a solid tailwind behind it, both in terms of financial performance and share price strength. After rebounding sharply from the recent Trump tariff sell-off, the shares are now trading within touching distance of their highs.
Big Expectations
The market is expecting another strong set of numbers from Spotify on Tuesday. Consensus forecasts point to earnings of $2.49 a share, up 139% on the same period last year, with revenue expected to grow 23% year-on-year to $4.78 billion. Subscriber growth remains healthy, with forecasts suggesting the platform added around 2 million premium subscribers during the quarter, lifting the total to approximately 265 million paying users and 679 million monthly active users overall.
Financially, Spotify has come a long way over the past year. In 2024, the group delivered an operating profit of €1.36 billion and a net profit of €1.14 billion — a sharp improvement on the losses reported in prior years. Free cash flow generation is equally strong, with free cash flow per share up 35% year-on-year. The balance sheet remains in excellent shape, with €7.4 billion of cash and negative net debt of €5.4 billion, giving the company plenty of flexibility as it scales.
Riding Relative Strength
Spotify’s share price has been in a clear uptrend over the past two years, comfortably holding above a steadily rising 200-day moving average. More recently, the shares showed resilience during the Trump tariff-driven sell-off, consolidating within a broad wedge formation before breaking decisively higher. Importantly, they have reclaimed the 50-day moving average and broken out above the wedge, putting them back on the front foot.
Relative to the wider market, the shares have been notably strong. While the S&P 500 remains more than 10% below its highs, Spotify is now trading less than 4% from its peak. The RSI is pushing higher above 60, but has yet to move into overbought territory, suggesting that momentum still has room to run. Volume has remained fairly modest during the bounce, although this could well pick up following this week’s results.
It’s worth noting that earnings can often trigger outsized volatility, particularly when a stock has rallied strongly into the event. As always around earnings season, managing position size and expectations will be key.
SPOT Daily Candle Chart
Past performance is not a reliable indicator of future results
Disclaimer: This is for information and learning purposes only. The information provided does not constitute investment advice nor take into account the individual financial circumstances or objectives of any investor. Any information that may be provided relating to past performance is not a reliable indicator of future results or performance. Social media channels are not relevant for UK residents.
Spread bets and CFDs are complex instruments and come with a high risk of losing money rapidly due to leverage. 83% of retail investor accounts lose money when trading spread bets and CFDs with this provider. You should consider whether you understand how spread bets and CFDs work and whether you can afford to take the high risk of losing your money.

Earnings catalyst but TA shows a different storyOverbought indicators are slowly moving higher, but showing signs of a slowdown and potential correction.

SPOT: Possible Rejection at Resistance Several tickers have bounced significantly but my eye are out for shorts - SPOT looks like. a possible candidate. Price jumped to resistance but failed to break. Could make another attempt depending on earnings but considering the broader market conditions, its likely that investors will be reducing exposure - since resistance isn't broken there may be a follow up retest of support. Watching the retrace and will be staying tuned for earnings

Spotify - JRE noticing sellers market exhausted, monthly sellers bear target met, big boys profiting atm. so l will monitor behavior of monthly candles, notice yearly candle close will happen also at months end, helping with more price action PA analysis. Sellers are weakening down here.
awaiting more weekly candles ..
Perma

SPOTIFY: Short at supply switch your directions
now bearish PA forming
Exit your long term long now. get ready for discounted shorts with highest prices IF dynamic change and price structure becomes clear to you
you can then send it..
wait for confirmation whatever that means to you.
