S1PO34 trade ideas
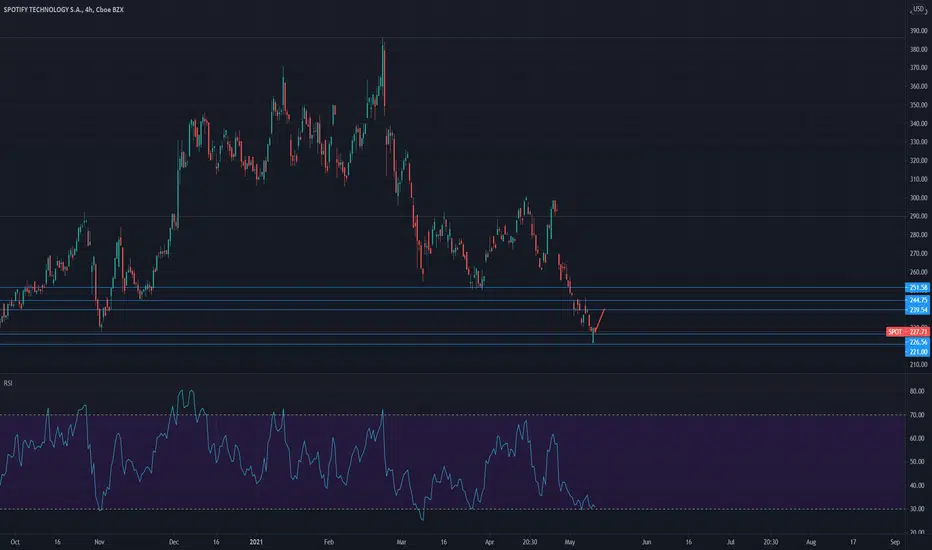
Spotify (SPOT) Nice Entry PointSpotify, D1: Support level + Bollinger bands + Hammer + Divergence + Nice sell off

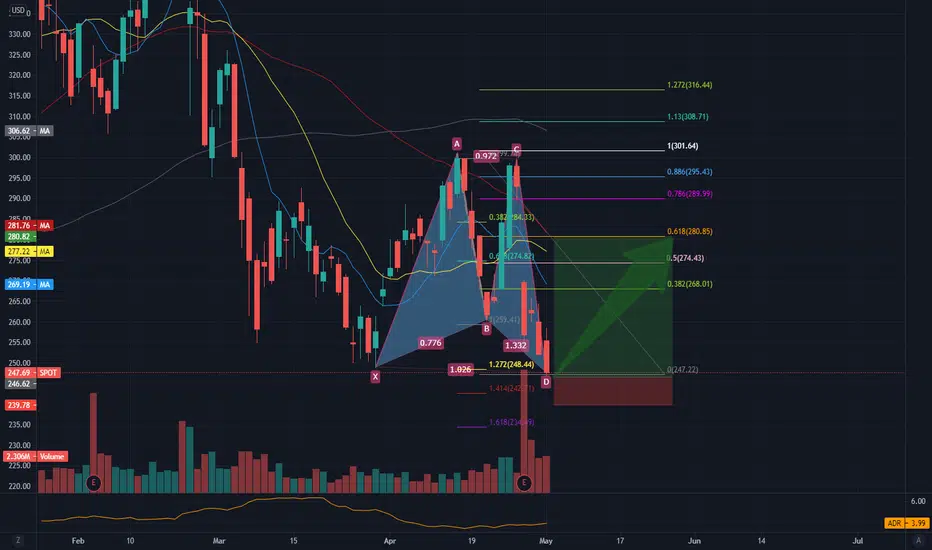
$SPOT Butterfly @srp192 Correct on the butterfly, bars are a little too big for my liking going into it, it can work, needs to bounce tomorrow

If you have tech stocks be careful of of earning calls..!I warned my private followers before this week started!
How is it possible?
Don't you believe it?
Check this:
My followers are way ahead of others in the market..!
SPOTIFY LONGSPOTIFY is recovering a bullish trend. Around 270 is the mark of the .618 fib retracement.
Just my opinion.
This is not financial advice.

SPOTLong swing idea
Rejection of support with a strong candle, might see a move back to the upside
Also had some good news yesterday

SPOT getting ready for weekly level breakoutSPOT touched 292 levels twice. That is also its current EMA 20 weekly.
A breakout from here will be powerful and ATH is probably next. On watch.

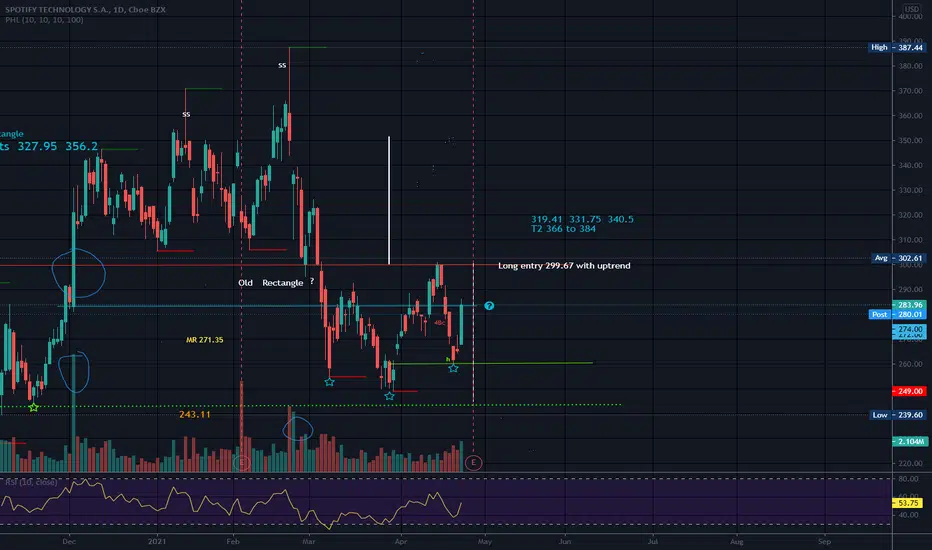
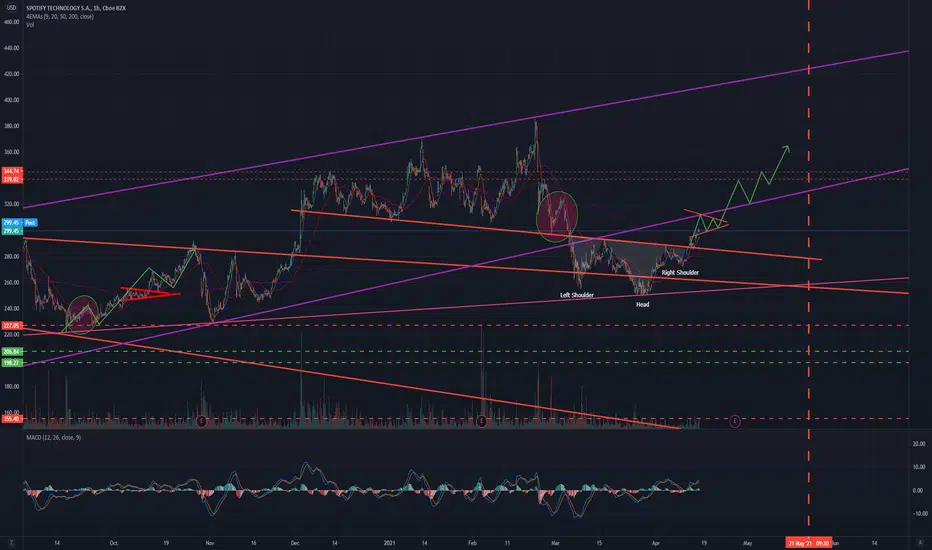
Inverse Head and Shoulders RectangleI saw the Inverse H&S pattern, then looked back and saw the older rectangle pattern that SPOT is now back inside of. It made finding the neckline a bit easier.
SPOT broke free from the old rectangle pattern before latest fall to earth in a single thrusting green candle.
From looking at volume, it looks like smart money has invested in this at lower levels, and I am sure they invested in it a long time ago at really low levels as well (o: When I see a huge volume bar like the one that short SPOT out of the rectangle, makes me wonder if anyone other than smart money could have acheived that much volume on a security at this price? Sure I see the general trading public acheive this day trading penny stocks etc. I am just not sure we could have done that volume bar by ourselves? What do you think?
No recommendation.
Rectangles can be hard to bust out of but SPOT has done it before.
Rectangles are horizontal consolidation zones and this is a wide one. The bottom is support and the top represents resistance. Spot has passed Mid Rectangle (MR) which is 271.35. Some use this as a stop whichever way the rectangle breaks.
SPOT got past the bottom of the big green candle today, but closed right at the bottom of it. If I could go back in time, I would have used that candle as support, or a stop vs mid rectangle if I were using a trailing stop. It looks like it may be causing a little bit of resistance right now. I am thinking SPOT will eventually get past it. Lots depends on market conditions and things we have no control over.


SPOT LONG!Go long on this name.
Inverse head and shoulders, will retest trend and consolidate in 310s before leg up on earnings.
LT target = 400

Spot to 330 by end of AprilSo many reasons to love this daily chart.
inverse head and shoulder pattern
breakout and retest of downtrend line with decent volume
rsi bullish
macd looking to crossover bullish soon
great business overall
personally love podcasts
looking for an easy retracement back to its 0.618 at a PT of 334 by end of April.

SPOT Potential sell zone approachingI'm expecting to see the price find its way into a strong fib zone and resistance level and then maybe a sell off. I don't trade the high or lows, I wait for confirmation before I press the trigger


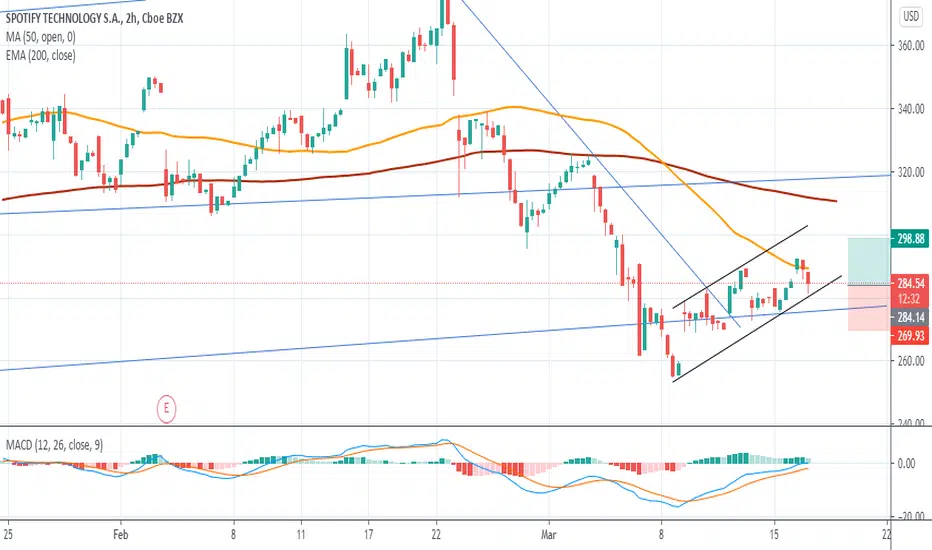
SPOT coiling$SPOT Trading within tightening range
- Closed above the 20 SMA
- Challenging the 200 SMA/EMA
- Closed above the 8 ema while challenging the 21 EMA
Nice bounce of lower trend. May need some time but see this testing 305


SPOT🌦Pattern recognized: Running flat Elliot Correction Wave.
Thesis: Bullish sentiment.
Conclusion: Waiting for signal on the 5 min.
My strategy: MEWT (MODIFIED ELLIOT WAVE THEORY).
***This does not constitute financial advice.***

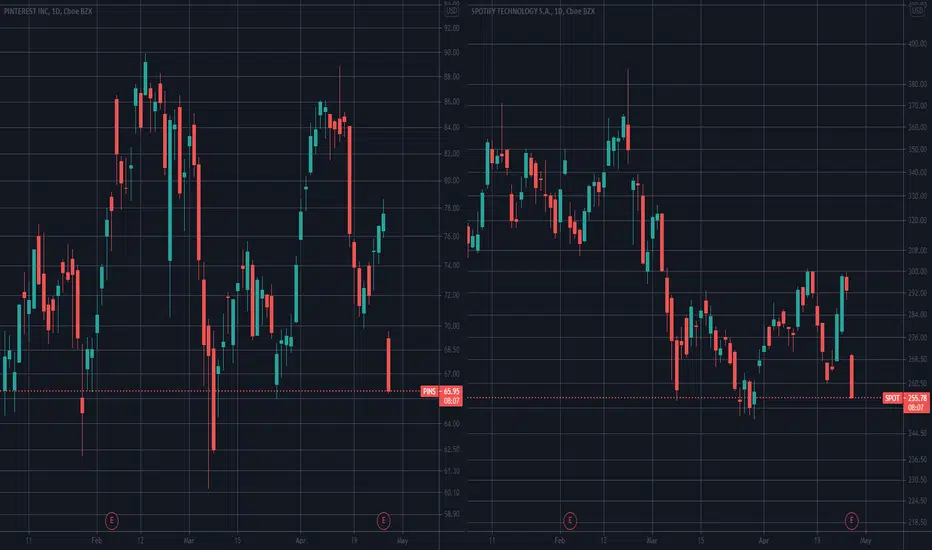
SPOT liquidation breakAnother tech with a big liquidation break pattern(b shape). Since there is plenty that has this shape now I'm trying to see who will be the "leader". Others that look similar are SHOP, AMZN, DDOG, TWLO, ORCL, and prob more. Hopefully, we can play them all the same.


