SFM Rising Wedge BreakoutSFM had a strong push up, entered a falling wedge, and recently broke out of the wedge. Looking for continued move up.
S2FM34 trade ideas

SFM Clean Stores Clean RiseThis chart shows a lot but basics:
-Wedging into a quick fall (prediction will rise back to $126 at least)
-Slow grind but could hit $28 based on history before drop again
-Following Elliot Waves Smoothly and EMS opened up
-Waiting for a good bounce to enter a trade

SFM ACCUMULATION $SPY WYCOFF
NASDAQ:SFM
AMEX:SPY
SFM, WEEKLY CHART
looks like Accumulation after Phase C to follow up
returned all the damage of COVID 19 and looks like a lot of interest
thanks

SFM continuing bullish move?With a nice bounce of the $20 support and daily showing a bullish trend I believe SFM will continue higher breaching its most recent high $22.
Catalyst: price action, earnings May 5th.
Thoughts?


Healthy ShoppingI had to endure 3 weeks of Complete Manipulation!
Even today, "They" ran it Up, then pulled it Down.
But Alas, I am Rewarded for "Holding" SFM
Zacks said that SFM would miss Earnings Estimates.
How wrong they were.
I shop here.
It is always crowded.
Buy what you know.


Sell the breakout - Rising Wedge Sprouts Farmers MarketOn Sprouts Farmers Marker we see a rising wedge in a downtrend,
breakout can occur upwards or downwards, but in a bearish trend I am looking for more confluence indicators
On a large timeframe I will wait until the candle closes below structure.
The initial target is market below around $17.00
Cheers!

SFM is holding trendSFM appears to be holding this wacky step-up pattern. It's been trading between 22.25 and 25.25 ever since their then-current CEO left on Nov 29th. SFM could possibly make another run up to the top of the range at 25.25.
If earnings are juicy, I expect a breakout followed by an attempt at reclaiming the ~27 level.

Long SFMThe last year for SFM has really shown incredible potential and movement as well has paved the ground for growth for the coming year ahead AVG Analyst price target is sitting around $27.21 for the next quarter. Sales over the last 5 years have shown consistent growth. Looking forward to maintain increase in price value. Looking for options trades to hold on the monthly and potentially weekly basis.

Bullish Divergence & Low Risk Entryjust saying... Extreme bullish divergence on both oscillators... now making consecutive higher lows... and about to cross bullishly over the 200ma

SFM on WatchSFM After a good run up spent time consolidating on lower volume. Has now printed a candle I like right at trend line support telling me there was buyer cued up.


acting as expected hereDotted trend line was drawn early last week. Lets see if it continues creeping up.


Ideally, would like to see it complete a dbl bottom next week.IBD50 stock holding strong in this weak market. Long @ $27

Position SFM- Decline to support level.
- If RSI and MACD hold then increase to next Fib level.
- If not, strong short.

SFM - Call EntryThis has plenty of bullish indicators as this is riding a strong uptrend; such as the hammer candlestick following the doji, the golden cross, and the 1,2,3 pullback. The strong up trend support is at 27.40, but thanks to a great Friday this looks to be continuing on a steeper uptrend. This may deal with some resistance testing the 52 week high at 29.50-30.00, but expect a solid bull run if it breaks through this level. I'm looking for a call entry ion 9/17 at 28.00-28.25.


SFM SUPPORT LVLI make stock analyses before the opening, these levels i draw are strong support/resistance and are the most powerfull on the same day. So i use them the moment when the market opens.
You can see somethimes i use 2 - 3 levels because i dont know where the market will open.
when the market open i see witch levels are still valid if it gaps above or under my level this one cannot used anymore.
If price come close to my level i place a limit order.
time frame i use are 5-10 min candles if price close right under or below the level with few penny's its of the table ! my risk reward ratio is 2:1 would be good to use trial these are scalp trades in high illiquidity market conditions !

$SFM Long Term HoldWeekly breaking out of downtrend line and holding
Daily timeframe showing positive price action with increasing buying pressure
new 50 day highs with above average volume!
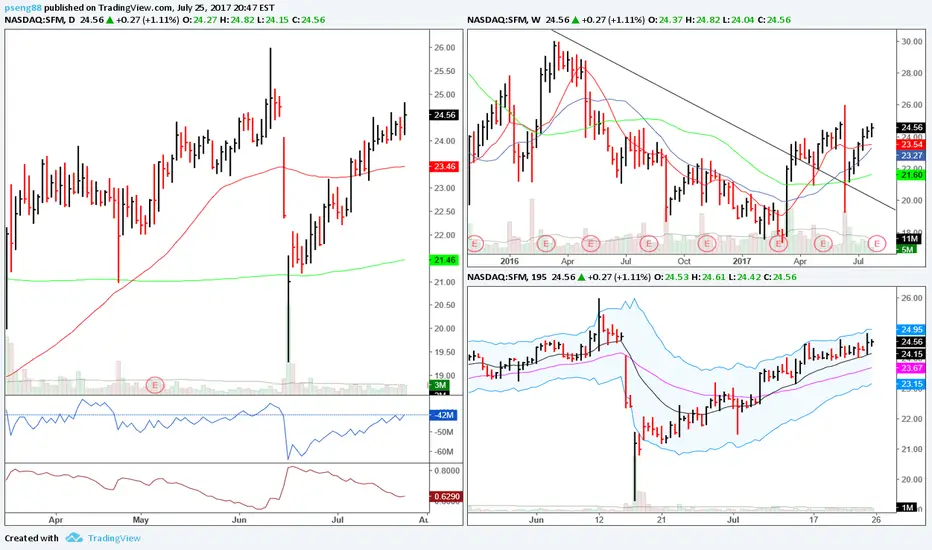
Sprouts Farmer’s Market Breaks Out of Trend, But Caution RemainsSprouts Farmer’s Market ($SFM) Weekly: Sprouts Farmer’s Market has been in a downtrend ever since it came on the market – making lower highs and lower lows, it finally seems to have found some support and bottom at the $18 price level. After retesting this level in March, the stock proceeded to make a strong move up and above the trendline resistance that it has been for so long, extending to about the .618 Fibonacci level before finding resistance there; be that as it may that this happened on the week where $WFM was acquired by $AMZN, it did actually make a new three month high and seemed to be stalling a bit before the big move down on Friday like the rest of the grocers.
And as with some of them like $KR, for example, it did have buying interest and make some of that loss back Monday, as well as part of Friday’s lows, Weekly view still shows weakness, as MACD is looking to roll over to the downside at present course. It may retest the trendline and ride along that downward slope to retest the $18 low (once again), or manage to make a higher low in the current trend and make a bid to head higher past $30 (hence breaking the current lower low, lower high trends, which would be bullish for the stock). But keep in mind that, despite it having breaking out above this downward trendline, that is to no avail should it make its way down to $18 and BREAK BELOW that important support level, as it would be certainly heading to resume the longer term lower lows that it’s been making since its ipo – that would be very bearish as it tries to find another support level in to uncharted levels for the stock. Keep eye on any bullish RSI divergences, or continued positive trends in the RSI, as well as MACD crosses to the upside to see where this stock will turn and head higher if you’re a bull, and the exact opposite for those looking to short the stock.

