Week 09: ZSK2021 Price is consolidatingThis week 09, we will be using ZSK21 as a chart reference.
There are few things that I would like to share:
(1) This morning the price was continuing the rally and created a gap upon opening. Price gap normally is closed within a day or two; so for a speculator, you can use this opportunity to short it.
However, please be aware that the overall trend is still bullish, if you are shorting, be mindful that you have to act fast.
(2) Overall the price still has no direction and it will be ranging from $1,405 to $1,427
(3) I will be interested to sell if the price penetrated $1,384
I will update again in mid-week if there is a sudden change on the outlook.
SOY1! trade ideas

Sell Soybean futures (MAY 2021)Sell from 1433 and 1546, stop 1635.25, target 794
Transfer of sales from the previous contract (MARCH 2021)

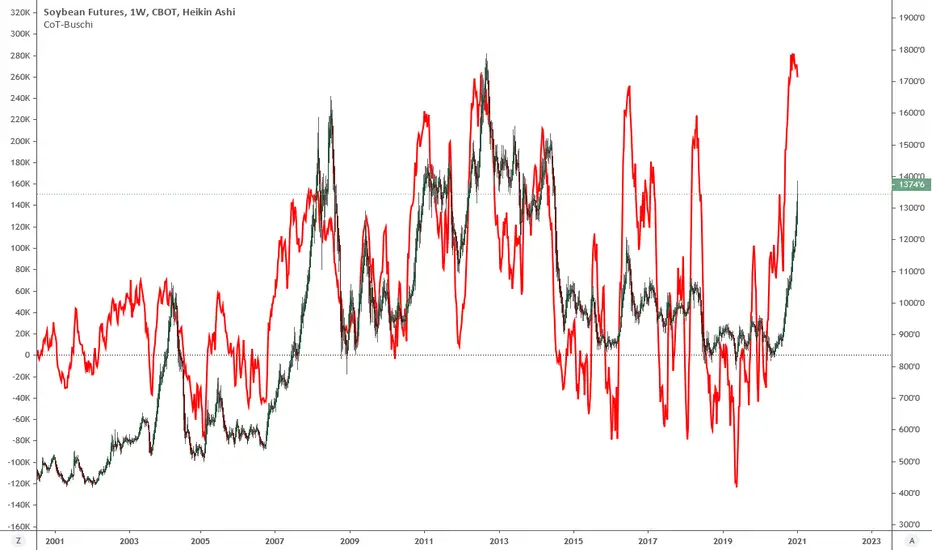
Everyone and their Dog should be Long SoybeansNov WASDE was the Gasoline to this fire, Soybean have been trending up for quite some times.
Managed Money Long is breaking record every week and we should not be surprised by this massive amount of fund buying the world, Global QE = Excess Money Flow.
Not much telling with technical unless you go back 10y.
Upside in the Mid Teen's if La Niña materialize in South America

Week 08: ZSH2021 Wait for a break to SellPatience is one of the key traits in trading.
Last week we did not see much action, the price is ranging in a tight movement 20.4 points for a whole week.
This week we are still waiting for a confirmation to short the market:
(1) Price level at $1,390 is being respected and currently creating a "fake out" line.
(2) My reversal zone remains at $1,400 (for now)
(3) The sign of going down will be confirmed when $1,370 is broken.
Overall, my view remain bearish with the following trade plan:
Sell Pending Order at $1,400
Stop Loss at $1,410
Take Profit at $1,322
RRR = 7.8R
I will monitor on daily basis too, shoot me a question if you need any clarifications or exchange ideas.

Week 7: ZSH2021 Let's wait to SELL againMy overall sentiment is still Bearish bias .
Today the opening price jumped 14 points and the bull kept running to the nearest Supply Zone.
In general view, the seller is still strong and therefore, we participate in selling too.
The nearest SELL area is between $1,395 and $1,400 (5 points zone), with a Stop Loss at $1,411.
Our first Take Profit level is at $1,375 (2.27R).
What if the price did not hit the Supply zone at $1,395 - $1,400 ?
Then we have to see the Price Action movement and market structure. Good Luck!


Week 6: ZSH2021 Price is in the sell areaFollowing up last week analysis, the price will be visiting Supply area prior going down.
My personal Sell Order will be at $1,417 (it depends on the price action in the next 2-3 H4 candles, I may short it early too).
The stop loss will be at $1,438 (New Higher High) and our Take Profit will be quite low (at least $1,275).
The simple sign will be at $1,417 area, if the body size of the candles are not prominently bullish; and there is a formation of Lower High (LH); I will go at whole-nine-yard to short the market. Just kidding, money management is still important, perhaps 10% to 20% equity to short this opportunity.


Soybeans (March21) have a decision to makeMarch Beans – Daily: Beans have been consolidating into a symmetrical triangle. You can see at the right there is a high amount of volume in the current price range. A break below would target 12.09. A break above, would first test the 13.95 area and then the 14.36 high. A move above 14.36 would then target the 16.60 area. Bull’s, re-read that. First need to take out 13.95 then the 14.36….
Watch for high volume on breakout moves and be careful on any fake outs.

Week 05: ZSH2021 Short Term BullishOn H4, the price has broken the down trend channel and making a Higher High.
From 27 January to date, the price movement is forming another flag on the higher band; also, to add some confluences, if we observed the Price Action on the candle stick, there were some rejection to go down.
Based on the above, I think the price will pick up some liquidity at $1,417 area prior going down.
Short term (1-2 days) will be bullish as we are still in bullish flag area.

Week 04: ZSH 2021 We are entering a ranging weekLet's keep it short, this week the price will be in ranging mode.
The range is between $1,338 to $1,280.
If you have shorted earlier, you can take profit some of your positions and keep some until it hits full TP at $1,280.
If you are a speculator, now it is a good time to Long (buy) the market, but you must exit at $1,338 area; then switch to Short the market.
In general, when the market is in ranging, we can scalp it Up and Down.
Trade wisely, Trend is your friend.

BeansI drew this one this way at about 8.50 in the spring and was slightly abused on twitter. no wilting flower, i went back to present it to my critics at about 10+ and now, my critic is off twitter. perhaps they were short. Its been a hellacious run and now? the length will move to the november, the spread will collapse or fluctuate wildly and weather will determine if we have the next big leg. Just a silly arcing bottom that appeared to me at a propitious time.

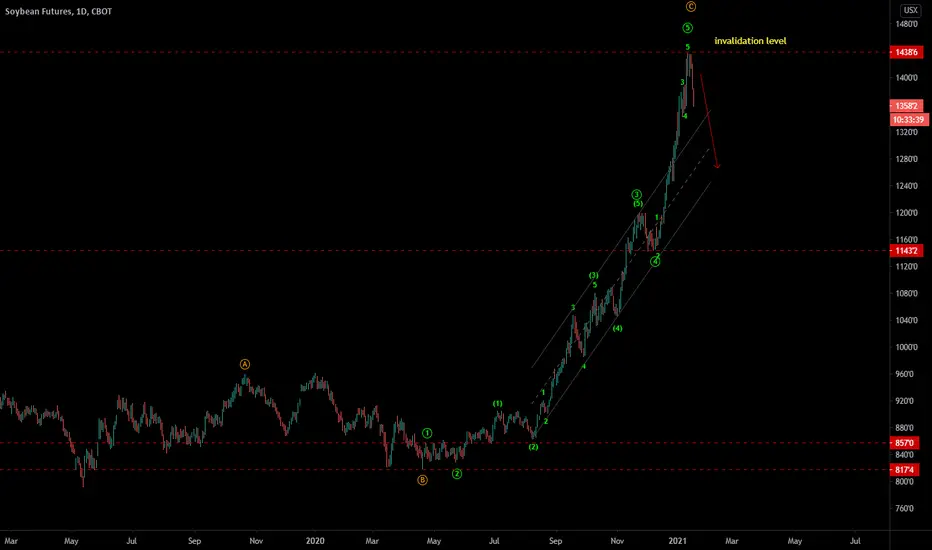
ZS - Soybean futures - EW analysis - correction down ZS - It seems like impulse cycle is finished with 5th wave extension. So expecting sharp reversal up to 1160 zone from the top of 1438.
Give thumbs up if you really like the trade idea.
US Presidents vs. Soybean PricesSimple soybeans vs US. Presidents chart to see if there are any trends worthy of paying attention to.

Week 03: ZSH 2021 The "Head" is forming, we are looking to shortWeek 03 analysis for ZSH 2021 .
The price is now ranging at the lower band of the trend channel, and on the structure wise, there is no Higher High forming.
It indicates the formation of the "head" and sellers are starting to jump in the market.
Our key level remain at $1,370 and once the price passed below that level, our probability to short is higher.
Stay tuned.


Week 02: ZSH 2021 Uptrend Channel, waiting for a breakApology for the late post.
Week 02 for ZSH 2021 is still bullish looking. Yesterday on H1, we can see the price movement candle by candle that there were no sign of weakness. In the last hour of market, it created a strong rejection and buyer jumped in with a significant momentum.
Let's see on the overall picture in H4, the movement is still within the Uptrend Channel, we only can short the market when we see a break at $1,370 level.
As at I wrote this, from H4 down to M5; there are still no sign of Seller coming to the market.
Buyer is still dominating the market, be cautious if you plan to long the market.
No trade call for this week.
-SatayFX


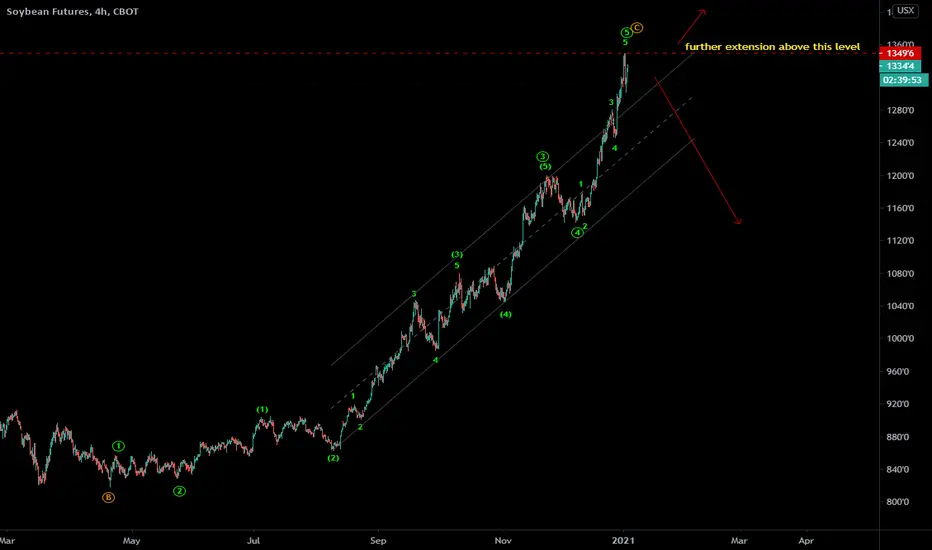
Soybean futures ZS - EW analysis - may be the correction time Soybean futures - ZS - It seems completed impulse up cycle of C wave up. But yet not confirmed the next correction or bearish cycle. if price crosses above last major high, then it may continue the further upside, but if price falls below 4th wave then it will start correcting down.
Give thumbs up if you really like the trade idea.
Week 01: ZSF 2021 Still Buyer's Market in the early 2021First day of trading in 2021, ZSF2021 is very bullish in the first 4 hours.
The market structure is clearly visible in H4, it keeps making a Higher High and we noticed the green candle momentum are relatively stronger on each pullback. Therefore we saw a series of uptrend last month.
The current Support level is at $1,320 and currently we have not seen any sellers (yet) in the market.
Will the price keeps going up? if there is no significant seller, yes. How high? we do not know yet.
What we know, the direction will change when the Seller is bringing down the price back to $1,320 area.
For now, no trade call for first week of 2021.
Next week I will start using ZSH2021.
Stay safe.

Soybeans -A Bullish ConceptSoybeans going up.
Concepts:
My friend and I, drew a straight line on a 1 minute chart, and we called it - "Support". In every time frame we scaled up to, -the line was valid as "support" but changing attributes to candlesticks.
Why? Because a straight line is by time, still a flat plane. Great. So what does that mean about chart time frames?
Answer that, and you will see many things.
I, the Son of Phalo (Pharaoh).
K.
At this profile page, the shared analysis, ideas and also, the strategy of a chart belong to Khiwe. The technical set-ups are speculative, they are not guaranteed for accuracy or in completeness in the form of any content; -it is not to advice on financial markets. Please apply your own analysis and confirm it with price action.
