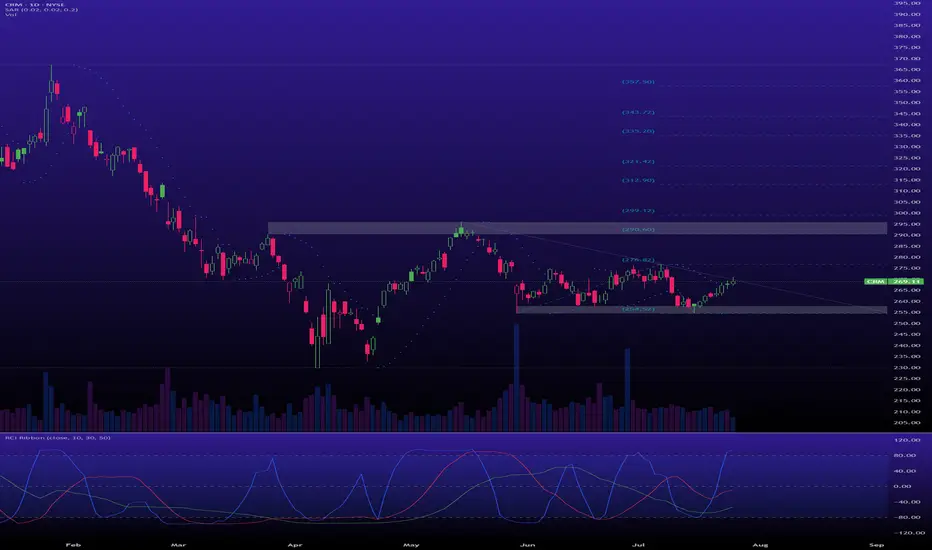
CRM is in an early accumulation phase of the Wyckoff methodWeekly Chart Analysis (The Secret Accumulation):
After a nasty markdown from the highs, CRM entered a wide trading range between roughly $230 and $290. This is classic Wyckoff Accumulation (Phase B) behavior.
Support & Resistance Levels
Next Week (July 28 - August 1, 2025):
Support: Immediate support lies around $265. The key pivot low to hold is $255.
Resistance: The first hurdle is the prior swing high around $275. The main target is the top of the accumulation range near $290.
Next Month (to end of August 2025):
Support: The entire structure is supported by the range low around $230.
Resistance: A breakout above $290 would confirm the start of a new markup phase (Phase D), with little resistance until well above $300.
SSFO34 trade ideas
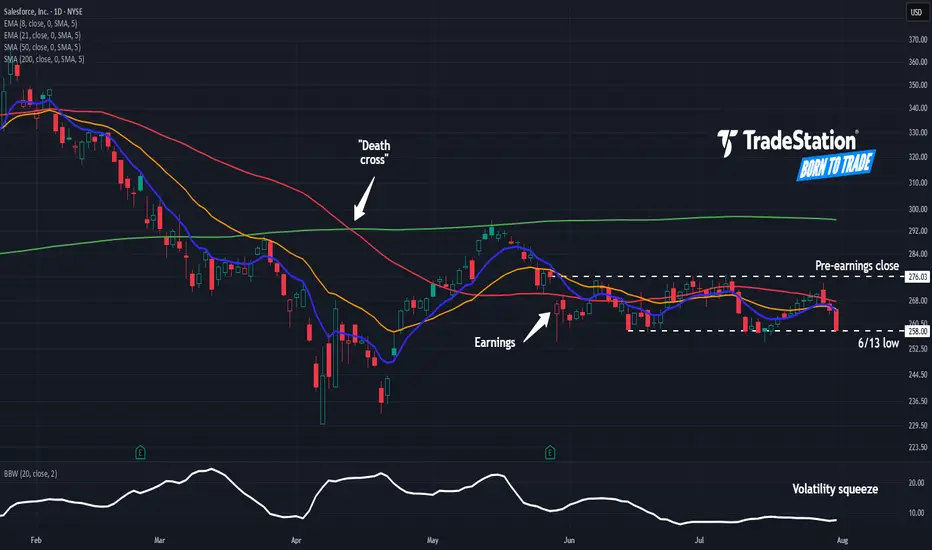
Salesforce May Face DistributionSalesforce has limped as other tech stocks hit new highs, and some traders may think it’s going into distribution.
The first pattern on today’s chart is the bearish price gap on May 29 despite better-than-expected quarterly results. That may reflect waning enthusiasm about the software company’s fundamentals.
Second is the pre-earnings closing price of $276.03. CRM has remained trapped below that level, which may suggest it’s become resistance.
Third is the June 13 low of $258. The stock bounced there in mid-July but may now be at risk of breaking it.
Next, Bollinger Bandwidth has narrowed as the stock formed a tight range between the two levels. Could price movement expand following that period of compression?
Last, the 50-day simple moving average (SMA) had a “death cross” below the 200-day SMA in April. The 8-day exponential moving average (EMA) is also below the 21-day EMA. Those patterns may be consistent with bearishness in the long and short terms.
TradeStation has, for decades, advanced the trading industry, providing access to stocks, options and futures. If you're born to trade, we could be for you. See our Overview for more.
Past performance, whether actual or indicated by historical tests of strategies, is no guarantee of future performance or success. There is a possibility that you may sustain a loss equal to or greater than your entire investment regardless of which asset class you trade (equities, options or futures); therefore, you should not invest or risk money that you cannot afford to lose. Online trading is not suitable for all investors. View the document titled Characteristics and Risks of Standardized Options at www.TradeStation.com . Before trading any asset class, customers must read the relevant risk disclosure statements on www.TradeStation.com . System access and trade placement and execution may be delayed or fail due to market volatility and volume, quote delays, system and software errors, Internet traffic, outages and other factors.
Securities and futures trading is offered to self-directed customers by TradeStation Securities, Inc., a broker-dealer registered with the Securities and Exchange Commission and a futures commission merchant licensed with the Commodity Futures Trading Commission). TradeStation Securities is a member of the Financial Industry Regulatory Authority, the National Futures Association, and a number of exchanges.
TradeStation Securities, Inc. and TradeStation Technologies, Inc. are each wholly owned subsidiaries of TradeStation Group, Inc., both operating, and providing products and services, under the TradeStation brand and trademark. When applying for, or purchasing, accounts, subscriptions, products and services, it is important that you know which company you will be dealing with. Visit www.TradeStation.com for further important information explaining what this means.
CRM Bullish Double bottom unfolding🚀 CRM Bullish Double bottom unfolding
Ticker : Salesforce, Inc. (CRM)
Timeframe : 1D (Daily Chart)
Setup Type : Potential Double Bottom / Range Breakout
Bias : Bullish Reversal
Technical Breakdown
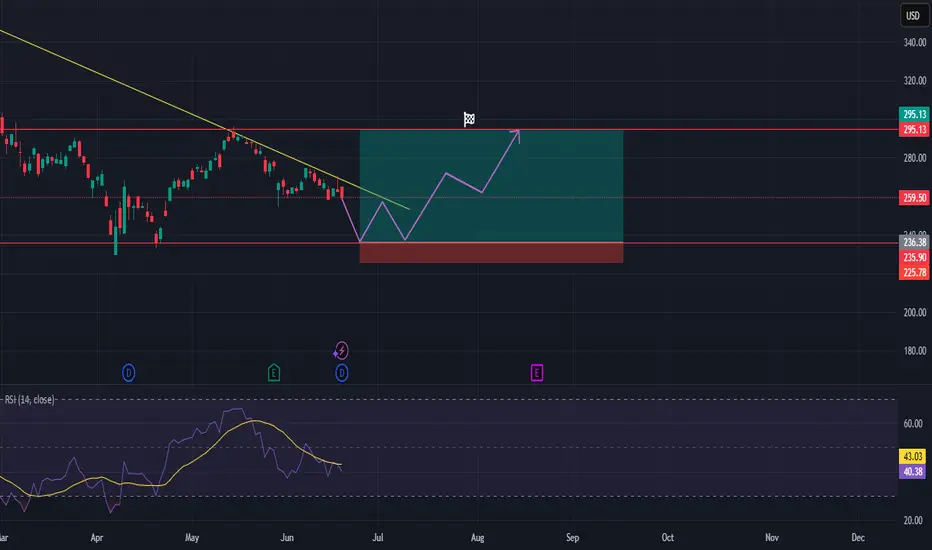
CRM is showing signs of forming a potential bottoming structure after a sharp decline and a period of sideways consolidation. We're currently sitting near the bottom of the range, and this could offer a favorable long setup with clearly defined risk and reward.
Look at the Blackstone's chart where a double bottom appeared in a very similar moment and offered a great opportunity to join the rally.
Here’s what’s happening:
Price has tested the same support level twice, around $259, hinting at a possible Double Bottom pattern.
If buyers step in from here and push price above the resistance zone near $275–278, we could see a strong continuation move.
The Volume Profile (VPVR) shows a big high-volume node above $275, meaning once that level is cleared, there’s room to run.
🎯 Educational Trade Plan
Entry idea : On confirmation of support around $259 or breakout above $278
Stop Loss : Below support, ~3% risk
Target 1 (Easy TP): 5.5% – retest of previous highs near $290
Target 2 (Full Move): 11% – around $310, aligned with the broader resistance and VPVR value area
💡 Why This Matters
This setup offers a tight stop and healthy reward , perfect for traders looking for calculated entries. It's also a great teaching moment:
-> When price consolidates near support with clear structure and nearby volume gaps, breakouts can be explosive once resistance gives way.
-> If CRM confirms the bounce, we could be at the early stages of a bullish swing back to value.
✅ Key Takeaways for Traders
Structure : Potential double bottom or range play
Location : Near strong support
Volume : Favorable above resistance
Risk Management : Clean stop just below lows with great risk/reward ratio.
💬 Does this setup align with your view on CRM?
🚀 Hit the rocket if this helped you spot the opportunity and follow for more clean, educational trade ideas!

CRM Bullish ThesisPOC @ $273.74
ATH was $369 back in December 2024.
ORCL had new ATH a few days ago, and other AI and Cloud names also.
Cloud Service is robust.
MACD on the 5Day Crossing and Curling
Fib 0.618 @ $271 turned into Support, (this Fibo retracement was taken from last move from May 2024 Low to ATH Dec 2024 $369)
First Target next Huge Resistance @ 0.5 Fib $289.98 Which coincides with AVWAP from ATH
Next Earnings 20 August, which might work as a Catalyst.
What Else? Volatility is High so Beware because as always: Anything can Happen.
My Plan: August 2025 290 Calls

$CRM Long Setup – Coiling at Support with Breakout PotentialSalesforce ( NYSE:CRM ) is consolidating just below the Ichimoku Cloud and building a base around the $265–$270 zone. The MACD is showing early bullish crossover signals with momentum starting to shift, and the price action suggests a coiled spring setup. After multiple tests of the $265 area and a failure to break lower, bulls may now have the upper hand.
The current setup offers a favorable 2.22 risk/reward ratio:
Entry: $269.90
Stop: $257.61 (below recent range lows)
Target: $297.23 (recent swing high + pivot zone)
A clean breakout above $275 could trigger a sharp move into the $290–$300 range. This is a measured, low-volatility breakout setup with a 2–3 week swing timeframe. Risk is tight, and the structure looks healthy if buyers step in above resistance.
Let me know if you’re long here or waiting for confirmation on volume.

$CRM Salesforce Trade IdeaStrong support at $260-265 with improving margins (net profit 15-17%). PE ratio down to 41 from 100+ in 2023. 16 analyst BUYs vs 3 SELLs.
Entry: $274-275 Target: $300-305 Stop: $258
Risk/reward ~1:2. Demand zone holding, volume confirms. #StockMarket #Trading

CRM · 4-Hour — Ascending-Triangle Breakout Idea Toward $288→$292Ascending triangle: Since mid-June price has carved higher-lows beneath a flat supply shelf at $276-278.
Coiled energy: Volatility keeps compressing; each dip is met with faster buying—classic “pressure-cooker” price action.
Measured–move math: Pattern height ≈ $18 ($258 → $276). Add that to the breakout level ($276) and you land at $294—smack in the middle of my $288-292 target box.
Volume-profile “air pocket”: The VPVR thins sharply between $280 and $295, hinting at limited stored supply until sellers regroup near the April reaction high (~$291).

CRM: Wave Structure Analysis. WaverVanir International LLC · CRM Weekly Outlook · Published June 28 2025
Ticker: CRM | Chart: Weekly
🔹 Catalyst
• Q2 FY26 earnings on August 27 2025 after market close (TipRanks, 2025)
• Dreamforce conference mid September 2025
🔹 Macro Environment
• Fed likely to hold rates at July 30 meeting (Binance News, 2025)
• Enterprise IT budgets remain resilient amid cost pressure
🔹 Technical Setup
• Weekly ORB demand zone at 239 supports price
• Wave 1 high at 296 and corrective wave 2 near 260–270 signals wave 3 start
• Resistance clusters at 336 (1.618 Fibonacci), 362 (2.0 Fibonacci), and extended target near 403
🔹 Trade Plan & Risk
1. Entry: Long near 274–276 on pullback
2. Stop: Below 265 to limit drawdown
3. Targets:
1. Scale out at 336
2. Add or trim at 362
3. Full exit near 403
4. Position size: Risk ≤ 1.5 percent of portfolio
5. Trail: Move stop to breakeven once 336 is taken, then trail beneath higher lows
🔹 Options Play
• Strategy: Sep 2025 bull call spread
– Buy 280 call
– Sell 320 call
• Defined risk equals net debit, breakeven ~ 283, max gain if CRM ≥ 320
#CRM #Salesforce #Stocks #TradingPlan #Options
References
Binance News. (2025, June 27). Federal Reserve’s July rate decision likely to remain unchanged. Retrieved June 28 2025 from www.binancenews.com
TipRanks. (2025). Salesforce CRM earnings dates, call summary & reports. Retrieved June 28 2025 from www.tipranks.com

CRM: Bullish Imbalance Fill in Progress | Targeting Equilibrium 🧠 Salesforce (CRM) shows a clean price reaction from the 61.8–66% retracement zone after bullish CHoCH and internal BOS confirmations. Our Smart Money model detects a re-accumulation beneath prior imbalance zones, with a potential run toward the equilibrium range at ~296–320.
📍 WaverVanir Trade Plan
Type: Swing Position
Entry Zone: 272–276 (current zone showing absorption)
SL: Below 256.79 (prior SMC demand/discount invalidation)
TP1: 285.39 (inefficiency gap fill)
TP2: 296.05 (equilibrium)
TP3 (Extended): 320.25 (liquidity sweep above SMC block)
Risk-Reward Estimate: ~1:2.5+
Holding Time: 5–15 trading sessions
🔥 Catalysts to Watch
📈 Q2 Earnings Preview (Est. August 2025): Market is pricing in AI efficiency gains and subscription retention
🤖 AI & Automation Momentum: Salesforce expanding Einstein GPT and vertical-specific AI tools
🤝 M&A Rumors: Speculation around strategic acquisitions in marketing automation
🛠️ Cost Optimization Plans: Continues to offload non-core operations; potential margin upside
🌍 Macro Tailwinds
🏛️ Fed Policy Easing Bias: Lower rates may support tech multiples in H2 2025
💼 Enterprise Spending Rotation: CIO budgets increasingly favor CRM, AI, and cloud spend
💵 Liquidity Reallocation: Risk-on flows post-NFP and CPI trends benefiting high-multiple software names
💬 Sentiment Score (Aggregated)
StockTwits/Options Flow/Buzz: +72/100
– Bullish bias forming, but room for late-stage participants to enter.
📌 Final Note from WaverVanir:
This setup reflects institutional structure alignment and volume pocket efficiency. We’re actively tracking CRM for a potential full move toward macro equilibrium under stable macro risk regimes.

A force to be reckon with.CRM
The attached image will be of the daily and the weekly timeframe.
On July 2024 of last year the monthly candle of July 2024 had a high of 264.52. Currently in line with closing price of 263.41 today 06/24/25. Will price react the same way a year prior when volume from buyers picked up. The current monthly candle for June is red. However, volume indicates strength from buyers as the volume remains green. Momentum is starting to pick up as indicated by the macd indicator. The price may stir memories of traders and investors from one year ago that price may react to this range again. The weekly rsi bounced sharply above 20 rsi on mon 07 April 2025 when price hit a low of 229.28, following this price hit a high of 295.58 during he week of May 12/25. 6 weeks later price has consolidated at a price action similar to that of Aug 2020, Sept 2021, Dec 2021, Jan 2024, May 2024, to Sept 2024.

CRM long positionHi traders,
Let's have a look at 1D Salesforce, Inc chart.
The stock is currently in a short-term downtrend, but it's approaching a previous support zone.
We expect 1 more dip to retest the lows from April 2025. With this dip , the RSI should revisit an oversold condition.
The target is the resistance zone near to 295, while stop-loss is set below the support to maintain a healthy risk/reward ratio.
Good luck
Quick View: $CRMDaily -> Bearish crossover with pullback on the ema 50
Hourly-> New bearish crossover
Watching for a #TopSwing Setup on the Daily Chart

CRM watch $262-265: Major Support that will call Bull or BearCRM gave us a nice long and exit in last idea below.
Now retreated to a major support $262.54-265.36
Bottom bound is a Golden Genesis, most important.
Above this zone is Bull, below is more Bear hell.
Look for a clean bounce or rejection for next leg.
.
Last Plot that gave perfect Entry/Exit:
Earlier Plot that gave PERFECT BOTTOM entry:
Hit the Follow and Boost to encourage more such PRECISE trade calls.
.

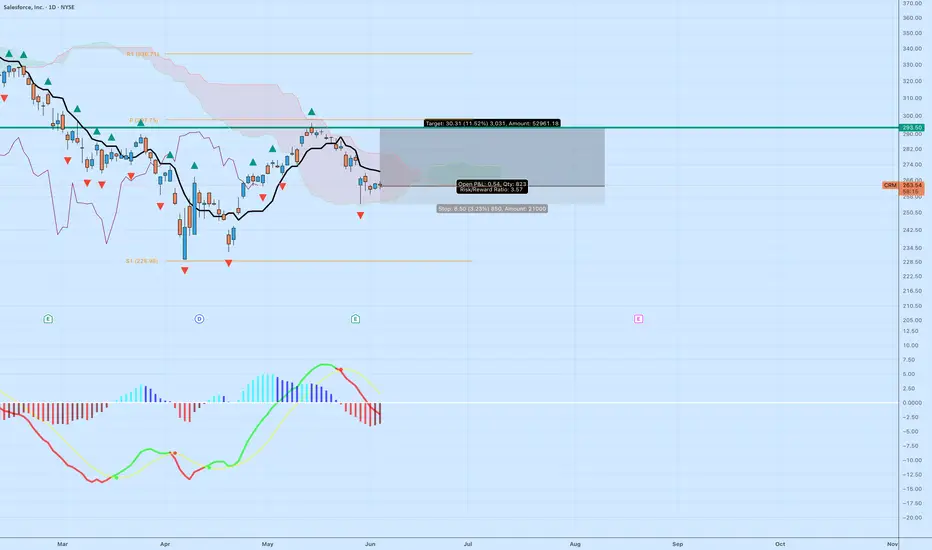
CRM Long Setup: High R:R Opportunity Off Support ZoneSalesforce (CRM) is setting up for a compelling long opportunity based on a combination of Ichimoku cloud structure, pivot level confluence, and a strong risk/reward ratio. After a recent pullback from the $290s, CRM has entered a consolidation range just above the Ichimoku cloud. With a defined stop and a clear breakout target, the long case offers an R/R of 3.57, which is notable in this current market environment.
🔍 Entry & Trade Details
Entry: $263.52
Stop Loss: $255.00 (approx. 3.23%)
Target: $293.50 (approx. 11.52%)
Risk/Reward Ratio: 3.57
Position Size: 100 shares (~$21,000 exposure)
This long position is targeting a return to the previous high around the $293.50 mark, which aligns closely with the key pivot resistance (R1 zone) and the upper boundary of the recent trading range. The tight stop loss just below the cloud and recent support ensures limited downside while leaving room for CRM to climb with momentum.
☁️ Ichimoku Structure Analysis
CRM is currently sitting inside the Ichimoku cloud, a zone of equilibrium where price tends to consolidate before a larger move. The key observation is that the conversion line (Tenkan-sen) is flat and the lagging span (Chikou) is attempting to cross above prior price action—both are early signals of bullish intent.
If CRM can decisively clear the upper cloud boundary, it opens the door for a move back to the psychological $290–$295 zone.
📊 MACD Momentum Shift
Below the chart, the MACD histogram has flipped negative recently, but that’s not unusual in a consolidation phase. More important is whether we see a re-acceleration in histogram bars along with a bullish MACD crossover, which would be a strong continuation signal.
With the histogram declining but price holding, we’re watching for a momentum divergence setup—bullish if confirmed by volume.
🔄 Volume & Previous Structure
CRM saw strong buying interest in mid-May, driving it above the pivot point ($277.75). Since then, price has retraced back toward support, shaking out weak hands and retesting the structure. Volume on the pullback has been controlled, suggesting this may be a healthy base before the next leg up.
📌 Trade Thesis
This is a technical long trade betting on:
A bounce off Ichimoku support
Bullish re-engagement of buyers near cloud edge
Clean target at former highs ($293.50)
Favorable risk/reward setup
The broader market conditions remain mixed, but CRM’s positioning in the enterprise software sector, combined with recent revenue growth and forward guidance, provide a solid fundamental backdrop.
📅 What to Watch
A daily close above the Ichimoku cloud
A green MACD histogram bar
Increased buy volume near $265–$270
💬 Final Thoughts
Salesforce is offering a high-probability, high-reward long setup here. Tight stop, clear target, and bullish structure make this worth watching. Be patient on confirmation—but once momentum returns, this could move fast.
CRM watch $236.70-239.08: Resistance flip to support for bottomCRM looking weak along with the tech sector.
Watching a key support zone at $236.70-239.08
Look for Break-n-Retest or consolidation above.
.
Previous Plots below:
Topping Call after Tariff Relief pump:
Bottom Call at $212:
Profit Taking levels after bottom pump
===========================================
.

Salesforce Goes Shopping: Acquires Informatica for $8 BillionSalesforce (NYSE: CRM) has taken a major step in its growth strategy by announcing the acquisition of Informatica (NYSE: INFA) for approximately $8 billion. Informatica closed yesterday at $24.29 per share. This deal, Salesforce’s largest since acquiring Slack in 2021, aims to strengthen its artificial intelligence ecosystem and solidify its position in the enterprise data management market, which now exceeds $150 billion. Salesforce will pay $25 per share, representing a 30% premium. The acquisition seeks to integrate Informatica’s data management capabilities with Salesforce’s Agentforce AI platform, enabling the company to offer more advanced cloud-based solutions to enterprise clients.
Financial Results
On the financial front, Salesforce reported strong results for the first quarter of its fiscal year 2026 (FY2026), which began on February 1 of this year. Revenue reached $9.83 billion, representing an 8% increase year-over-year. Adjusted earnings per share came in at $2.58, beating market expectations. In light of this performance, Salesforce has raised its full-year revenue guidance to a range between $41.0 and $41.3 billion. Strong demand for cloud solutions and the momentum of artificial intelligence are driving this growth.
Technical Analysis
Salesforce shares closed at $277.19 on May 28, trading within a daily range of $315.87 to $241.08. Over the past twelve months, the stock has experienced significant volatility, peaking at $368 during the year-end rally and bottoming at $229.64 in early April amid market tensions related to Trump’s tariff announcements. The current price sits around the mid-range control zone, suggesting a temporary balance between buyers and sellers. Moving averages are showing signs of indecision, with a sideways trend reinforced by a neutral RSI, indicating the potential for a technical rebound if no clear short-term direction emerges.
From a Fibonacci retracement perspective, the price reached the 50% level in mid-May and appears to be forming a bullish support zone. If the market reacts positively to the Informatica acquisition, the stock may move toward the 61.8% Fibonacci level, slightly below the previous consolidation range. This could pave the way for a more sustained recovery in the coming months.
Conclusion
The acquisition of Informatica marks a new strategic chapter for Salesforce, reinforcing its commitment to artificial intelligence and its dominance in the enterprise data market. Backed by strong financials and an optimistic outlook for the rest of the fiscal year, the deal could serve as a catalyst for a new growth phase. While technical indicators suggest some short-term caution, the fundamental context points to a solid foundation for renewed upward momentum. The market’s reaction in the coming sessions will be key to confirming this potential trend shift.
*******************************************************************************************
The information provided does not constitute investment research. The material has not been prepared in accordance with the legal requirements designed to promote the independence of investment research and such should be considered a marketing communication.
All information has been prepared by ActivTrades ("AT"). The information does not contain a record of AT's prices, or an offer of or solicitation for a transaction in any financial instrument. No representation or warranty is given as to the accuracy or completeness of this information.
Any material provided does not have regard to the specific investment objective and financial situation of any person who may receive it. Past performance is not reliable indicator of future performance. AT provides an execution-only service. Consequently, any person acting on the information provided does so at their own risk.

$CRMNYSE:CRM broke both last week's and yesterday’s lows in last Friday post-market.
📉 Expecting further downside as long as volume remains weak.
🎯 Key levels: targeting $270 first, then $255–$254.
🛑 Watching for support in the $242–$245 zone.
🔄 A strong bounce toward $300+ could follow in the coming weeks.
1-hour chart included for context.
#CRM #Salesforce #Stocks #Trading #TechnicalAnalysis

What Does Salesforce’s Chart Say Heading Into Earnings?Customer-relationship-management technology giant Salesforce NYSE:CRM will release fiscal Q1 results next Wednesday (May 28). What do CRM’s chart and fundamentals say heading into the report?
Salesforce’s Fundamental Analysis
Next week’s numbers could be key for shareholders, as readers might recall that back in February, the firm issued revenue guidance for the current fiscal year that disappointed Wall Street. That sent CRM shares down some 4% the next day.
For next week’s report, the Street is looking for $2.55 in adjusted earnings per share on roughly $9.75 billion of revenue.
That would compare somewhat well to the $2.44 in adjusted EPS on $9.13 billion of revenue during the same period a year ago -- representing some 6.7% of revenue growth.
Investors will also be watching next week’s report for metrics such as subscription-based revenue, as well as both current and total remaining performance obligation.
Free cash flow will also be in focus. For Salesforce’s fiscal Q4 ended Jan. 31, the firm generated $3.97 billion of operating cash flow.
Out of that number, the firm spent just $154 million on capital expenditures, leaving $3.816 billion in free cash flow for the quarter and $12.434 billion for the fiscal year as a whole. That last number was up 31% from the year prior.
Still, analysts have grown increasingly negative on Salesforce’s upcoming results as next week’s earnings date approached.
Of the 37 sell-side analysts I found that track the stock, 31 have revised their estimates for adjusted earnings lower since the current quarter began. Just six have revised their forecasts higher.
Salesforce’s Technical Analysis
Now let’s look at CRM’s chart going back to September:
Readers will first see that Salesforce has recently shown some minor weakness. The stock appears to be feeling its way around its 21-day Exponential Moving Average (or “EMA,” marked with a green line above) as CRM searches for support.
The chart above also shows a near-perfect “double-top” pattern of bearish reversal, marked with the black box at left above. That pattern stretched from October into late February, producing a significant sell-off.
But then the sell-off morphed into a near-perfect double-bottom pattern of bullish reversal.
A rally coming out of that pattern could potentially take the stock considerably higher, as the “pivot point” (the apex of the center spike above) stands at $268.
Salesforce closed Thursday at $283.42 -- about 6% above the pivot -- but in a tech/AI/growth stock like CRM, breakouts from a pivot have often gone for 15% or even more.
Case in point -- on the way down, Salesforce’s recent sell-off ran to 26.7% below the pivot point.
However, there’s one big difference between CRM’s sell-off and its subsequent rebound.
On the way down, Salesforce cut like a hot knife through butter across its 200-day Simple Moving Average (or “SMA,” marked with a red line). But on the way up, the stock hit its 200-day SMA on May 14 like a brick wall, going lower from there for several days.
Looking at other Salesforce’s other technical indicators, the stock’s Relative Strength Index (the gray line at the chart’s top) looks strong, as well as nowhere near being technically overbought. That's traditionally a positive sign.
That said, the stock’s daily Moving Average Convergence Divergence indicator (or “MACD,” marked with black and gold lines and blue bars at the chart’s bottom) is starting to look like it could be out of gas.
Within the MACD, the histogram of the 9-day Exponential Moving Average (or “EMA,” denoted by blue bars) has come in and now barely stands above zero.
As for the 12-day EMA (marked with a black line) and 26-day EMA (the gold line), they’re both above zero -- which is usually a positive.
However, the 12-day line appears to be on the precipice of crossing below the 26-day line. That could be seen as a bearish signal.
(Moomoo Technologies Inc. Markets Commentator Stephen “Sarge” Guilfoyle had no position in CRM at the time of writing this column.)
This article discusses technical analysis, other approaches, including fundamental analysis, may offer very different views. The examples provided are for illustrative purposes only and are not intended to be reflective of the results you can expect to achieve. Specific security charts used are for illustrative purposes only and are not a recommendation, offer to sell, or a solicitation of an offer to buy any security. Past investment performance does not indicate or guarantee future success. Returns will vary, and all investments carry risks, including loss of principal. This content is also not a research report and is not intended to serve as the basis for any investment decision. The information contained in this article does not purport to be a complete description of the securities, markets, or developments referred to in this material. Moomoo and its affiliates make no representation or warranty as to the article's adequacy, completeness, accuracy or timeliness for any particular purpose of the above content. Furthermore, there is no guarantee that any statements, estimates, price targets, opinions or forecasts provided herein will prove to be correct.
Moomoo is a financial information and trading app offered by Moomoo Technologies Inc. In the U.S., investment products and services on Moomoo are offered by Moomoo Financial Inc., Member FINRA/SIPC.
TradingView is an independent third party not affiliated with Moomoo Financial Inc., Moomoo Technologies Inc., or its affiliates. Moomoo Financial Inc. and its affiliates do not endorse, represent or warrant the completeness and accuracy of the data and information available on the TradingView platform and are not responsible for any services provided by the third-party platform.

Quick View: $CRMDaily -> Bullish crossovers of every EMA
Hourly - Consolidated bullish trend
Watching for a #TopSwing Setup on the Daily Chart
Area of $297 as key resistance.
Support → $268

CRM not looking EWVwap acted as support
good price by trend
everyone are still fearful
BECAUSE theres a hidden RSI bearish divergence i will only take this long IF it retraces to previous resistance trendline and it acts as support (market structure change and reversal)
if it sweeps 290 I will look for the retrace at a higher price.
like previous resistance.
The reason i dont want to long here specifically is because i want higher probabilities in my favor.

CRM to rise on back of bad economyAs business shut down around the world, jobs will get funneled into America's agents: Employees that never need to eat, rest or ask for bonuses.
America is geared towards a service economy. While the money in goods exports and imports dries up, CRM is the grand exception.

CRM eyes on $262-265: Golden Genesis + Covid fibs for next leg CRM got a Tariff Relief bounce into resistance.
Looking for a dip or break and retest to buy.
If you missed the lower support, look here.
$ 262.54-265.36 is the exact zone of interest.
$ 254.42 below is first support for dip entry.
=========================================

Learn how to identify Fundamental levels with Technical AnalysisYes, you can see fundamental levels using your technical analysis in your charts. Dark Pool Buy Side institutions buy a stock incrementally ahead of its earnings season often weeks ahead. The fundamentals are right in your charts and are easy to see and recognize once you understand the dynamics of the Dark Pool Buy Zones and how and why these form in most charts.
Being able to recognize fundamental levels is helpful for Platform Position Traders who hold a stock for several weeks. It is highly beneficial to swing traders who can prepare for the momentum speculation that comes after these patterns. It is also extremely valuable to selling short traders as you can avoid high risk sell short trades and be ready for momentum runs to the upside.
