SSFO34 trade ideas

Symmetrical TriangleEarnings estimated to be 11-30 AMC.
Announce Date
11/30/2022 (Post-Market)
EPS Normalized Estimate
$1.22
EPS GAAP Estimate
$0.10
Revenue Estimate
$7.83B
Analyst EPS Revisions (Last 90 Days)*
Up-4 Down-9
Symmetrical triangles are neutral until broken.
No recommendation

CRM // rectangle patternLet's look for closures where I indicated with X. Targets are determined according to Fibonacci.

Price is Beneath a RectanglePrice broke to the downside from a horizontal consolidation zone.
A lot of RED noted suggesting strong selling pressure. It would seem that even sellers can become exhausted and take a break?
Target 1 has been met. Targets 2 and 3 in smaller orange type.
Price is below the .618 of the trend up since the Covid low and above the .786.
There is a support level not far below price and if this stock is planning to turn up for any length of time, this would be a good place to do so.
Earnings are late November and it appears expectations are low.
Short interest is low at around 1.35%.
No recommendation.

QuickTrade n. 138 : CRMLong, looking for a continuation
Short, looking for a bearish cross test of the EMA 250


CRM daily bearish hammer at 38% Fibonacci retracement RSI divergCRM daily bearish hammer at 38% Fibonacci retracement RSI divergence wave 5 of downtrend take profit 50% Fib extension.

CRM daily bullish hammer super tight countertrendEntry 145.8
SL 137.35
CRM daily bullish hammer super tight countertrend quick within pinnacle.

CRM - BEARISH SCENARIOSalesforce, Inc. is a San Francisco, California-based software company with a $150.2 billion market capitalization. The company delivered a -40.86% return since the beginning of the year, while its 12-month returns are down by -44.84%.
Despite the announcement that the company will execute its first-ever share buyback program and the plans to lift the prices that it charges for the Slack team communications app that it acquired last year the stock remain under pressure.
The next stop is located at the $ 110 support level
Risk Disclosure: Trading Foreign Exchange (Forex) and Contracts of Difference (CFD's) carries a high level of risk. By registering and signing up, any client affirms their understanding of their own personal accountability for all transactions performed within their account and recognizes the risks associated with trading on such markets and on such sites. Furthermore, one understands that the company carries zero influence over transactions, markets, and trading signals, therefore, cannot be held liable nor guarantee any profits or losses.

CRM weekly bearish hammerOrder SELL 6 CRM NYSE Stop 142.46 LMT 142.46 will be automatically canceled at 20230401 01:00:00 EST
CRM weekly bearish hammer into wave 5 downtrend

Salesforce.com Could Be Trending LowerSoftware companies like Salesforce.com have struggled with rising interest rates and a strong U.S. dollar. Today we'll consider some potentially bearish patterns on the daily chart.
First is CRM's inability to reclaim the monthly lows of June and July last week. (Both were around $158.)
Second is the descending channel taking shape since the beginning of September.
Next, consider how the stock has remained below its 21-day exponential moving average (EMA) over the same period.
Finally, stochastics are retreating from an overbought condition.
TradeStation has, for decades, advanced the trading industry, providing access to stocks, options, futures and cryptocurrencies. See our Overview for more.
Important Information
TradeStation Securities, Inc., TradeStation Crypto, Inc., and TradeStation Technologies, Inc. are each wholly owned subsidiaries of TradeStation Group, Inc., all operating, and providing products and services, under the TradeStation brand and trademark. You Can Trade, Inc. is also a wholly owned subsidiary of TradeStation Group, Inc., operating under its own brand and trademarks. TradeStation Crypto, Inc. offers to self-directed investors and traders cryptocurrency brokerage services. It is neither licensed with the SEC or the CFTC nor is it a Member of NFA. When applying for, or purchasing, accounts, subscriptions, products, and services, it is important that you know which company you will be dealing with. Please click here for further important information explaining what this means.
This content is for informational and educational purposes only. This is not a recommendation regarding any investment or investment strategy. Any opinions expressed herein are those of the author and do not represent the views or opinions of TradeStation or any of its affiliates.
Investing involves risks. Past performance, whether actual or indicated by historical tests of strategies, is no guarantee of future performance or success. There is a possibility that you may sustain a loss equal to or greater than your entire investment regardless of which asset class you trade (equities, options, futures, or digital assets); therefore, you should not invest or risk money that you cannot afford to lose. Before trading any asset class, first read the relevant risk disclosure statements on the Important Documents page, found here: www.tradestation.com .

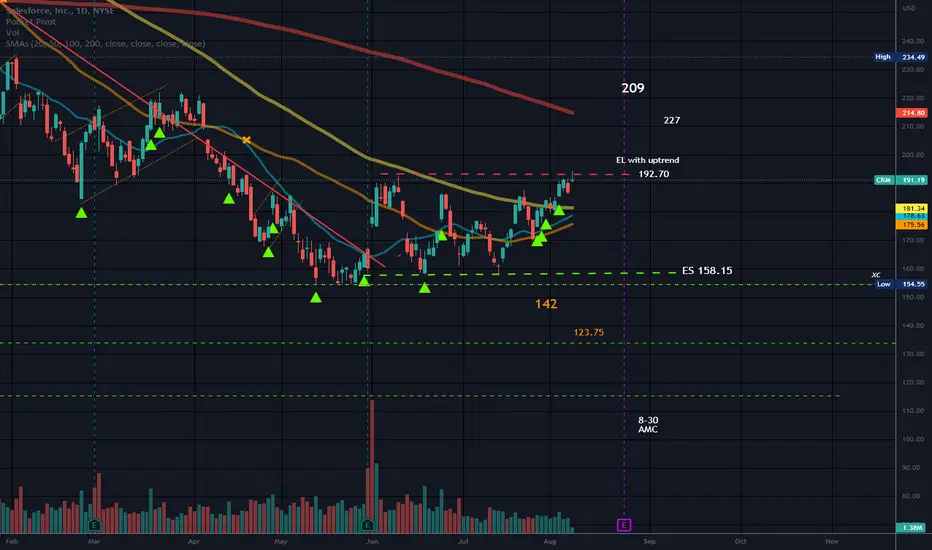
Up and up with Salesforce.End of flat, Exit C pre confirmed. Ready to bet on a rise.
We are not in the business of getting every prediction right, no one ever does and that is not the aim of the game. The Fibonacci targets are highlighted in purple with invalidation in red. Confirmation level, where relevant, is a pink dotted, finite line. Fibonacci goals, it is prudent to suggest, are nothing more than mere fractally evident and therefore statistically likely levels that the market will go to. Having said that, the market will always do what it wants and always has a mind of its own. Therefore, none of this is financial advice, so do your own research and rely only on your own analysis. Trading is a true one man sport. Good luck out there and stay safe.


QuickTrade 73 : CRMLong : Looking for a bullish cross and to close the small gap left open.
Short : Continuation of this downtrend to new Lows

QuickTrade : CRMLooking for the 21h to complete the cross on the 50h and test the 250h.
The short side sees a sharp rejection of the 21h on the 50h

$CRM with a Bullish outlook following its earnings #Stocks The PEAD projected a Bullish outlook for $CRM after a Negative over reaction following its earnings release placing the stock in drift C with an expected accuracy of 25%.

SALESFORCE - BEARISHS CENARIOSalesforce's second-quarter results topped Wall Street expectations, but the downtrend is more likely to continue due to the worsening of the business outlook.
inflation and slowing U.S. growth are some of the main reasons for the company cut its revenue forecast
The next price target is located at the $ 150 support level.
Risk Disclosure: Trading Foreign Exchange (Forex) and Contracts of Difference (CFD's) carries a high level of risk. By registering and signing up, any client affirms their understanding of their own personal accountability for all transactions performed within their account and recognizes the risks associated with trading on such markets and on such sites. Furthermore, one understands that the company carries zero influence over transactions, markets, and trading signals, therefore, cannot be held liable nor guarantee any profits or losses.
CRM Salesforce Options Ahead Of EarningsLooking at the CRM Salesforce options chain, i would buy the $175 strike price Puts with
2022-8-26 expiration date for about
$5.25 premium.
Looking forward to read your opinion about it.


Salesforce – Is it to Fall Even Further?Fundamental Indicators:
Sector – Technology
US Business Cycle Stage – late cycle, when this sector is not favourable
Revenue – consistent growth for the past 10 years, 26% annual growth 5-year average
Profits – significant drop from 2021
Net margin – quite low with 3.59% for tech company
P/E – extremely high at 188 compared to S&P500 with 21 and Technology sector 27
Liabilities - debt ratio is at 0.37 which is within normal limits, Net Debt/ EBITDA is negative – no problems with debt
Conclusion – great financial performance for the past 10 years but given the extremely high PE ratio and the current global economic situation it is grossly overpriced, so it is very likely to continue correcting
Technical Analysis (Elliott Waves):
Main scenario of this idea suggests that we are still observing development of the global growth cycle which is currently at the stage of completing the first leg of corrective wave 4 (see higher timeframe graph)
Since the correction of March 2020, the stock price considerably updated historic highs but slightly choppy with a challenging EW count, in this case an Ending Diagonal has been chosen as wave 5 (see guidelines for Ending Diagonals below)
From the high of October 2021 there has been a sharp fall in a clear impulsive move of wave A, followed by a sideway correction in wave B
The next move in wave C is expected to reach $115-$122 and this will finalise the first leg of the global corrective wave 4
This is a higher timeframe to reflect the full history of Salesforce and to provide full wave count:
This is the link to the guidelines for Ending Diagonals
What do you think about Salesforce and its short term prospects?
Also let me know if you would like to see other stocks, indices, Forex or Crypto analysed using Elliott Waves.
Thanks

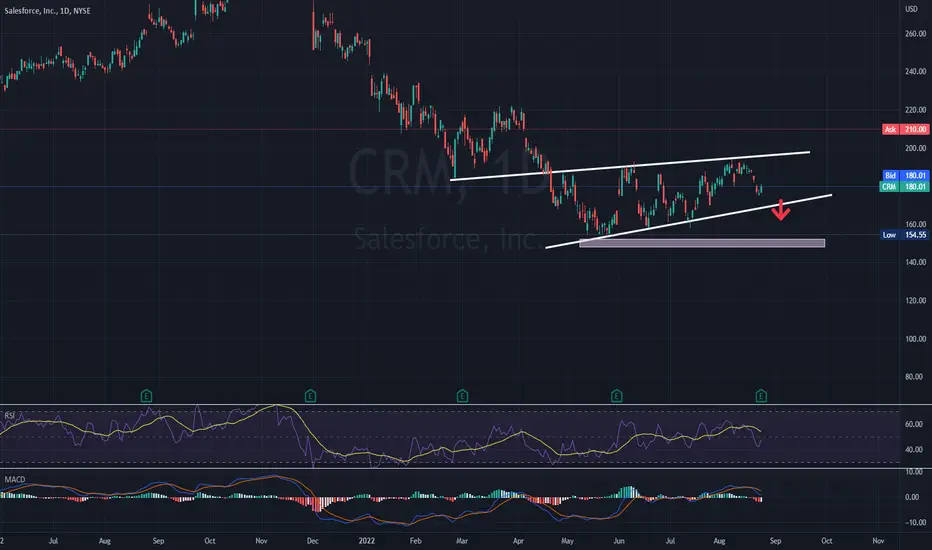
RectangleEntry long is a break of top trendline with an uptrend and vice versa.
Target 1 in larger type. Target 2 in smaller type if T1 is passed.
No recommendation
Salesforce at resistance?Salesforce
Short Term
We look to Sell at 190.76 (stop at 198.93)
The medium term bias remains bearish. Bespoke resistance is located at 191.00. Trading within a Bearish Channel formation. We look for losses to be extended today.
Our profit targets will be 169.86 and 158.00
Resistance: 191.00 / 224.00 / 260.00
Support: 168.00 / 140.00 / 115.00
Disclaimer – Saxo Bank Group. Please be reminded – you alone are responsible for your trading – both gains and losses. There is a very high degree of risk involved in trading. The technical analysis, like any and all indicators, strategies, columns, articles and other features accessible on/though this site (including those from Signal Centre) are for informational purposes only and should not be construed as investment advice by you. Such technical analysis are believed to be obtained from sources believed to be reliable, but not warrant their respective completeness or accuracy, or warrant any results from the use of the information. Your use of the technical analysis, as would also your use of any and all mentioned indicators, strategies, columns, articles and all other features, is entirely at your own risk and it is your sole responsibility to evaluate the accuracy, completeness and usefulness (including suitability) of the information. You should assess the risk of any trade with your financial adviser and make your own independent decision(s) regarding any tradable products which may be the subject matter of the technical analysis or any of the said indicators, strategies, columns, articles and all other features.
Please also be reminded that if despite the above, any of the said technical analysis (or any of the said indicators, strategies, columns, articles and other features accessible on/through this site) is found to be advisory or a recommendation; and not merely informational in nature, the same is in any event provided with the intention of being for general circulation and availability only. As such it is not intended to and does not form part of any offer or recommendation directed at you specifically, or have any regard to the investment objectives, financial situation or needs of yourself or any other specific person. Before committing to a trade or investment therefore, please seek advice from a financial or other professional adviser regarding the suitability of the product for you and (where available) read the relevant product offer/description documents, including the risk disclosures. If you do not wish to seek such financial advice, please still exercise your mind and consider carefully whether the product is suitable for you because you alone remain responsible for your trading – both gains and losses.

Falling Wedge- Bullish- Keeping a close eye on CRM here as its finally starting to break out of this falling wedge it's been holding for quite some time now. Big increase in buyer volume relative to seller volume as shown on the RSI with some slight bullish divergence on the daily timeframe, and some more bullish divergence on the weekly timeframe (See Attached Chart Below).
- CRM closed out the week reclaiming its 20-Day SMA while also testing the upper trend line on the falling wedge it's been holding. On top of all that, CRM's EMAs are starting to curl upwards, with multiple gaps to fill on the upside heading into earnings, all signs pointing towards a breakout.
- Bullish and will be looking for a breakout from this wedge (Broader Market Conditions Permitting)- Just some support and resistance levels to watch along with some RSI-based supply and demand zones to keep an eye on in the meantime
--Weekly chart & Price Targets Attached Below--
PT1- $192.54
PT2- $196.23
PT3- $202.72
PT4- $205.18 +
--Weekly Timeframe--
