Tesla 2-21🔥 Market Overview:
Trend: Bearish; recent bounce but still below major resistance.
Key Levels:
Resistance: $362.00, $366.00.
Support: $353.00, $347.00.
Indicators:
MACD: Weak bearish momentum, potential for a reversal if strength builds.
RSI: 48.31, neutral with slight bullish divergence.
Supertrend: Bearish, but a base is forming.
🔥 Scalping Strategy:
🩸 1. Momentum Scalping
Buy near: $353.50, targeting $358.00 (+1.3%).
Sell near: $362.00, targeting $355.00 (-1.9%).
Stop-loss: Below $351.00.
🩸 2. EMA Pullback Scalping
Buy near: $353.00 (EMA 9), targeting $360.00 (+2.0%).
Sell near: $362.00, targeting $354.00 (-2.2%).
Stop-loss: Below $350.00.
🩸 3. Breakout Scalping
If $362.00 breaks, enter long toward $366.00 (+1.1%).
If $353.00 fails, short toward $347.00 (-1.7%).
🔥 Mid-Term Trend Forecast (1-3 Weeks):
If price reclaims $362.00, expect continuation toward $370+.
If it fails to hold $353.00, a drop toward $347.00 is likely.
The stock remains weak until a confirmed breakout.
🔥 News & Market Context:
Tesla reported 2% revenue growth, missing expectations.
Stock is still under pressure but showing resilience.
Broader EV sector sentiment remains mixed.
🔥 Decision:
🩸 Short-term: Scalping within the $353–$362 range is optimal.
🩸 Mid-term: Tesla remains bearish until a breakout is confirmed.
🩸 Ideal Play: Range-bound trading until a decisive move occurs.
👑 Final Verdict:
Weak stocks bounce before they break. Don’t chase—position with strategy.
🔥 LucanInvestor:
"Discipline in execution separates traders from gamblers. Know the difference."
TSLA34 trade ideas

Stop being losers, wait for the dips.Guys... i never understood why you buy 300+ and not 100/140... Can you stop the bullshit for once? Look in the mirror and say "I will not be a loser".
Fractals telling how it is.

Long term great short term spicyExpanding fractal shows us we could see 190. A great buy for all that didnt buy the first 100 or 140.

Fractals are the past present and futureTSLA long term is great. Short term we are due for a choppy setup.

Options Trading with TradeStation: TradingView ShowIn this video, we're diving into options trading with David Russell, Head of Global Market Strategy at TradeStation, for a live stream exploring the latest updates to the platform, especially the enhanced integration with TradeStation for options trading. This update enables TradingView users to access equity options trading for the first time with a US brokerage, making it easier to trade directly from the TradingView platform.
Learn how to read an options chain, create an options order, and combine options trading with charts, research, and more. The new integration, combined with TradingView’s suite of educational tools like the strategy builder, chain sheet, and volatility analysis, helps traders see the options market in a new way, with crystal clear visualizations and data.
This live stream will highlight how users can link their TradeStation accounts to TradingView for seamless options trading and explore the opportunities that come with these updates.
This educational session is a great chance to learn about the latest tools and strategies that can elevate your trading success.
Got questions or eager to dive deeper? Drop them in the comments below—we’re here to help!
Thanks for tuning in, and get ready as we have many more groundbreaking tools for you. Stay tuned for what's next!

TSLA to circa $500 Given the logical progression of infrastructure development, I anticipate an announcement from the current administration regarding the initiation of this project in the near future.
The project's appeal lies in its incremental nature and relative ease of implementation. It can be initiated on a limited scale and expanded gradually, making it both cost-effective and manageable compared to other large-scale infrastructure endeavors.
My analysis suggests that this infrastructure initiative has the potential to be the most GDP-generative project currently conceivable. Its economic impact, combined with Tesla's strong position in the EV and autonomous driving sectors, could serve as a powerful catalyst for the company's stock performance, potentially pushing it beyond the projected $499-$500 range.
While stock predictions should always be approached with caution, the convergence of these factors - the observed double bottom pattern, the potential infrastructure project, and Tesla's market position - presents a compelling case for potential upward movement in Tesla's stock price.
This assessment is based on current market conditions and available information, and is subject to change as new data emerges.
Tesla Stock Analysis and Infrastructure Prediction Upon careful analysis of Tesla's stock performance, I have formulated a hypothesis regarding its future trajectory. Technical analysis indicates the formation of a double bottom pattern, with the bottoms observed at $387 and the peak between the two bottoms at $439. This pattern traditionally signals a potential price movement that could reach $499 to $500 or higher, representing a significant upward trend for Tesla's stock.
A key catalyst I've identified that could substantially impact Tesla's valuation is the prospective implementation of Full Self-Driving (FSD) Lanes for logistics EV transports. While this is based on my own analysis rather than insider information, calculations suggest this infrastructure project could be the most economically viable and impactful initiative in the near term.
The projected benefits of this infrastructure project include:Significant reduction in transport costs
Mitigation of inflationary pressures
Creation of substantial employment opportunities
Generation of considerable tax revenue.

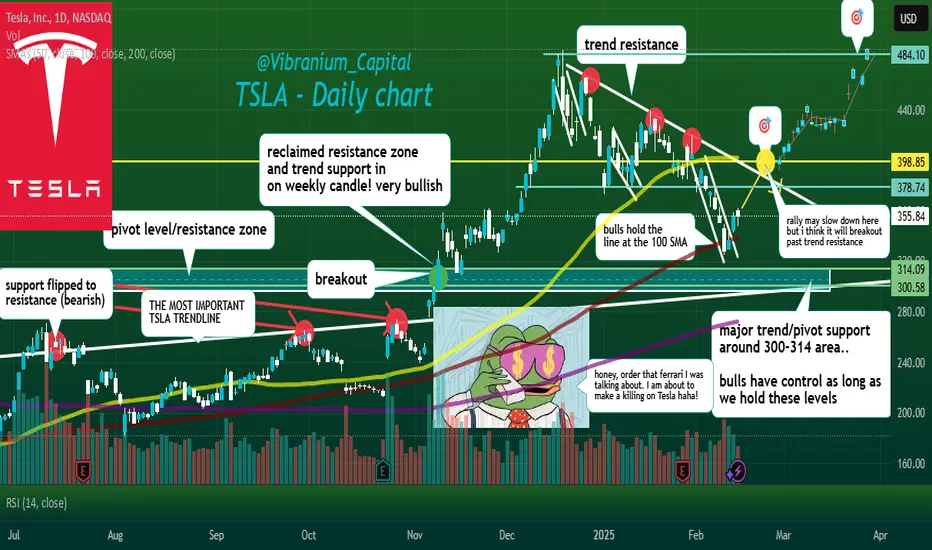
TSLA is setting up for an explosive rally boost and follow for more❤️🔥 Tesla bulls continue to hold control as long as 300-314 levels hold, we recently saw a local downtrend breakout while holding onto its 100 Simple moving average which is very bullish.
The rally may slow down as we approach 378-398 🎯 but do not worry once that trend resistance finally breaks I think we see 484-500+ within weeks! Tesla is not a stock I would short anytime soon. 💯
side note: I hope you all enjoy your Sunday and remember the Stock market is closed Monday for Presidents day. I may still log into TV to post a new chart, we will see... have a good one guys ❤️🔥
TSLA shortsRejection from Weekly FVG. The run up earlier was to trade into the weekly fvg. With confirmation on H4 and 15m entry the TP was hit today.

TSLA IS GOING UP $$$This is the price action of TSLA at its very best & exclusively for viewers on trading view.

Tesla short on earningthe chart says it needs to reach $320-$300 zone. risky but less risky for short

Shorting Teslathis is what my roadmap looks like. 5 more % green this week. sell order close to Sl (the lines)
2 scenarios as you see. I will update you later in the comments

TSLA at a Pivotal Zone! Key Trade Setups for Tomorrow Feb. 20Technical Analysis (TA) Overview
TSLA is currently consolidating near 360-363, following a strong breakout from a descending wedge pattern. The price is now testing a key volume profile resistance zone, indicating that the next move will depend on whether buyers can maintain strength or if sellers step in.
📌 Key Support & Resistance Levels:
* Resistance: 363.81 (Volume Profile High), 367-370 (major resistance and call wall)
* Support: 360, 352.50, 350 (major put support)
📌 Indicators:
* MACD: Momentum is slightly bullish, but histogram shows signs of weakness.
* Stoch RSI: Near mid-levels, indicating room for both upside and downside—not overbought yet.
* Volume Profile: High trading activity around 360-363, suggesting price could stall or reject here before another move.
Gamma Exposure (GEX) & Options Sentiment
🔹 Call Walls (Resistance):
* 370: First major resistance level.
* 380: Strong call resistance, likely a tough breakout without significant volume.
🔹 Put Walls (Support):
* 350: Heavy put support—this level is crucial for maintaining bullish momentum.
* 340-330: If 350 breaks, bears could push lower toward these levels.
🔹 Options Sentiment:
* IVR: 35.3 (moderate volatility—could see larger moves).
* Call Open Interest: 47.7% – Mixed sentiment, but slightly leaning bearish.
Trade Scenarios for Tomorrow
✅ Bullish Setup:
* If TSLA breaks above 364 and holds, we could see a move toward 367-370.
* Ideal entry: Above 364, stop-loss below 360.
* Profit targets: 367, 370, 380 (extension if momentum continues).
❌ Bearish Setup:
* If TSLA fails to hold 360, sellers could push it down toward 352.50-350.
* Ideal entry: Below 360, stop-loss above 363.
* Profit targets: 355, 352.50, 350 (major support level).
Probability Estimate for TSLA’s Next Move: Bullish Move Above 364 (Targets 367-370)
Scenario Probability (%): 50%
Reasoning: TSLA broke out of a descending wedge, signaling bullish intent.
• Needs sustained volume to clear 363-364 resistance zone.
* If buyers push above 364, expect a move toward 367-370. | | Choppy/Sideways (Range 360-364) | 30% | - Volume profile shows heavy activity in this zone, meaning TSLA could stall here.
* MACD is showing weak momentum, suggesting consolidation could occur. | | Bearish Breakdown Below 360 (Targets 355-350) | 20% | - If TSLA loses 360, sellers could quickly test 355-352.50.
* 350 is a strong put wall, so bears need significant momentum to push lower. |
Final Thoughts
* TSLA needs to break 364-365 for further upside. If it does, 370 is the key breakout target.
* Failure to hold 360 could bring selling pressure, targeting 355-350.
* Overall, I lean slightly bullish (50%) but expect some consolidation unless a strong catalyst appears.
🔹 Best Trading Plan:
* Bullish Play: Watch for a breakout above 364 → target 367-370.
* Bearish Play: Look for rejection near 363-364 or a break below 360 → target 355-350.
🚨 TSLA is at a critical resistance zone, so expect either a strong breakout or a rejection back to support.
*
Would you like a more detailed intraday game plan for trade execution? ✅🚀


Tesla scalping + forecast 2-19🔥 Market Overview (Tesla - TSLA)
Trend: Recovery phase after a strong downtrend; facing key resistance.
Key Levels:
Resistance: $368-$370 (200 EMA, key rejection zone)
Support: $353-$355 (Supertrend and recent demand zone)
Indicators:
EMA 9: $361.37 (Price slightly above, indicating short-term bullish bias)
EMA 200: $368.39 (Critical resistance; price needs a breakout for further upside)
Supertrend: $353.84 (Support level for continuation)
MACD: Weak bullish crossover, but limited momentum.
RSI: 62.26 – Approaching overbought zone, suggesting a potential pullback.
🔥 Scalping Strategy
🩸 Range Scalping (Preferred Strategy)
Buy near: $353-$355, targeting $365.
Sell near: $365-$368, targeting $355.
Stop-loss: Below $350.
🩸 Breakout Scalping (If $370 Breaks)
Buy above: $370, targeting $380-$385.
Stop-loss: Below $365.
🩸 Momentum Scalping (For Quick Trades)
Short near: $368-$370, targeting $355.
Buy near: $353-$355, targeting $365.
🔥 Mid-Term Trend Forecast (1-3 Weeks)
Tesla needs a strong close above $368 to confirm bullish continuation.
If $370 breaks, expect a move to $385.
If rejected from $368-$370, a retest of $353-$355 is likely.
🔥 News & Market Context
Tesla has been under pressure due to EV market slowdown and earnings concerns.
Investors watching for catalysts to drive sustained upside.
Market-wide sentiment remains cautious, which could affect Tesla’s next move.
🔥 Decision:
🩸 Short-term: Scalp buy at $355, targeting $365.
🩸 Mid-term: Watch price action at $368-$370.
🩸 Ideal Play: Short $368-$370 if rejected; buy above $370 if confirmed breakout.
👑 Final Verdict:
Tesla faces a critical resistance zone at $368-$370. Breakout could fuel further upside, but failure may lead to another pullback.
🔥 LucanInvestor's Quote:
"The market rewards patience, but punishes hesitation." 👑

TSLA TradingI get the point why TSLA became bullish in the past few days. RSI reset and people's expectation on AI and FSD technology. However, Tesla also needs to convince investors with growing revenue and earnings.
With its sales tanking globally and its brand name becoming trashy due to Elon's strong far-right political position, I really don't see any upside for this stock in the next few months. I believe its uptrend is temporary, which was mainly caused by the need of RSI reset. Its long term potential is too far to see. I strongly doubt Robotaxi will be successful at this time, when FSD technology is far from being safe and reliable. Many Tesla car crashes have been reported that were caused by FSD.
Check out the four lower highs it has made since December. And two lower lows that formed on January 2 and February 12. I think these LHs and LLs have confirmed the midterm trend of this stock. I highly doubt the current uptrend will make a HH. In other words, I doubt it will go above 420. I believe it will make another LL in March, around 275, before its next disappointing earnings report. With the current uptrend, 390 is at an area of confluence and a good LH to 420.
Thanks for reading and I would love to hear your feedback.
2

TSLA: Continuity of the uptrendTSLA, high probability of a continuation of the upward trend with this break of the resistance line by buyers as you can see on the graph....
