Bearish Trend for Uber6 week accumulation and a large range expansion last week, 23.98% drop anticipated based on the range withing the accumulation. I bought $31 strike puts, apr 8 expiration.
U1BE34 trade ideas

$UBER - How do you see it playing out?Uber has been in a down trend channel and currently trading at the lower trend line of the channel. The question is will it bounce from here or will it break below the lower trend line?
Per fib extension, $31.72 area could be a support. However, a better support would be $28.58 (the yellow line). If the price breaks down to $28.58, it would mean the price has broken below the channel. It's extremely bearish.
But if we look at the history, the area has acted as support multiple times in the past.
A bull might bet that the price will bounce from 31.72 area and head towards $37.67 with a tight stop loss at $31.
A safer entry would be around $28.58 again with a tight stop loss at $26.
It's hard to trade in the current headline driven environment.
How would you play?
———————————————————
How to read my charts?
- Matching color trend lines shows the pattern. Sometimes a chart can have multiple patterns. Each pattern will have matching color trend lines.
- The yellow horizontal lines show support and resistance areas.
- Fib lines also show support and resistance areas.
- The dotted white lines show the price projection for breakout or breakdown target.
Disclaimer: Not investment advice.
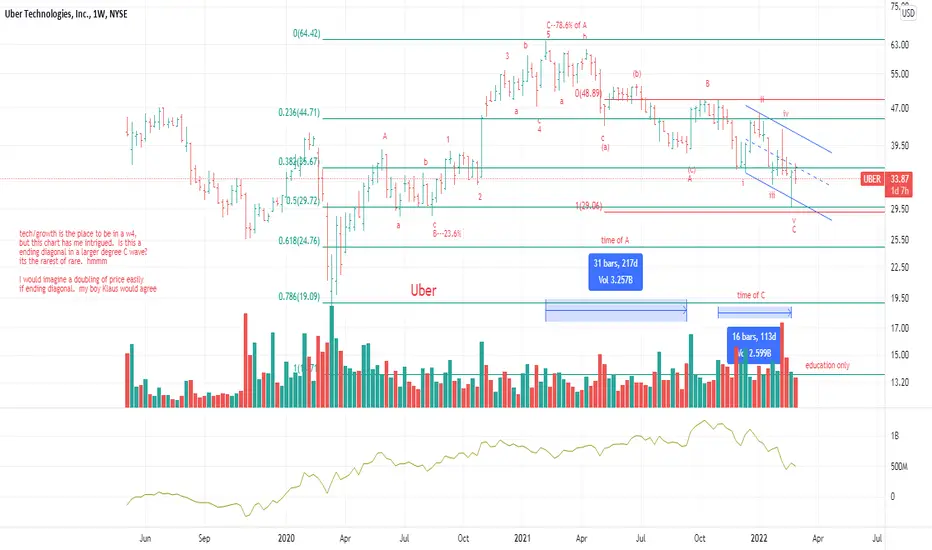
Uber ---Weekly framethe description is in the chart itself....thank you Trading View for letting the audience get a detailed description
UBER - Active pattern is still pushing price down
Downward push from the key supply levels is relentless. despite good ER, rejected VWMA and down to the recent low.
I H&S pattern is emerging on the daily, if it loses 34 again, 29 is next.
short is still the path of least resistance, but I'd be vigilant if I was too deep. 34 holds and it bases above for a bit, test of VWMA around 40 and the breakout is on the cards.
neat falling wedge makes this a very attractive pattern.

UBER - $30If you've followed our previous charts on Uber they've been spot on. We're looking to buy back in at the $30 levels using dollar cost average method.
Cheers!
Disclaimer:
I do not provide personal investment advice and I am not a qualified licensed investment advisor. I am an amateur investor.
All information found here, including any ideas, opinions, views, predictions, forecasts, commentaries, suggestions, or stock picks, expressed or implied herein, are for informational, entertainment or educational purposes only and should not be construed as personal investment advice. While the information provided is believed to be accurate, it may include errors or inaccuracies. I will not and cannot be held liable for any actions you take as a result of anything you read here.
Conduct your own due diligence, or consult a licensed financial advisor or broker before making any and all investment decisions. Any investments, trades, speculations, or decisions made on the basis of any information found on here, expressed or implied herein, are committed at your own risk, financial or otherwise.
Feel free to give us a follow and shoot us a like for more analysis updates.


Uber Long Uber is looking like it could double up over the next year back to its ath. The previous cup had finished and burst out without forming any immediate handle, now we’ve had the slight market correction, it’s retraced back to the typical handle fib levels suggesting a breakout of this downwards channel ( handle) is soon.

Uber Technologies: downtrend on the wayAlthough it's true investors are buying around these levels, the price keeps falling around the downtrend channel. Good buying opportunities are found on the lower part of the channel. It's a good opportunity for a buy-and-hold strategy, but the incoming FED intervention on interest rates hikes could pose a tremendous risk on the short term in all stocks, so care with volume. In terms of fundamentals, Uber has improved a lot and reduced losses considerably, financial and operational results were positive this last Q, way better than those of 2020. The best strategy is to buy the dip. So analyze the financial results of 2021, compare it to 2019 and 2020 and place your bets! I'm pretty sure this one is gonna perform really well in the coming years, but it's all about timing. If indices fall, we will find a great opportunity on this one!

Uber projection (amateur)Well , firstly i believe Uber is highly undervalued and believe it has high potential upside post q4 eanings and after CFO stated Uber is looking at $5 billion in. profits by 2024 .
furthermore , Uber settled a lawsuit over some google secrets which were being traded in regards to self driving car , this is me putting my 2 cents and ignoring tehcnical analysis but i remember uber raised the cost of delivery and rides because they were offering at a loss because they couldn't afford to pay all their drivers , what would make most sense is a fleet of driverless rideshare and delivery and i wouldnt doubt the lengths uber would go to get its hands on some intel on autonomous vehicle engineering as this would push ubers potential and opportunities for expansion limitless and be able to retin up to 40A% more profits
back to brains , uber and lyft both show high booking reports going into 2022 displaying a high demand for mobility and as pandemic fears and mask mandates are being pushed aside , travel and need for mobility and travel will rise offering higher profitability for both rideshare companies this coming year but more towards uber as it offers food delivery .

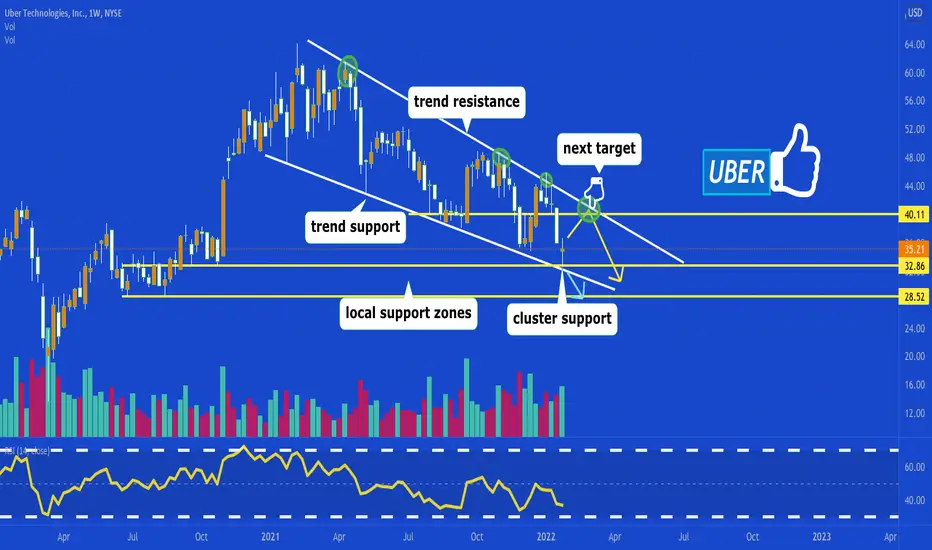
perfect rejection off resistance this week!🦉uber reached the top trendline resistance target i mentioned in my last analysis, congrats to longs that secured gains!
my next target is 32.86 now, lets see if it hits :D
💘 like and follow for more!

Missed the UBER IPO? You can buy it for less nowUBER Q4 report:
earnings of 44 cents per share VS expected -33 cents
$5.78 billion VS $5.39 billion expected.
Q4 Gross Bookings outpaced expectations
Delivery and Trips came up a tad short estimates.
Freight $1.08 billion VS $807.8 million expected.
My price target for this quarter is the IPO price, $45.
Looking forward to read your opinion about it.

Congrats to those that took the UBER play..Told you 42s would be seen... (post below) Scared money makes no money. Know what you are looking at .. if you dont know how to do that, dont be in things. What I would be looking for is for that rejection candle showing up shortly and going short......... If you did the 37c for this Friday and the 42P for a few weeks out.. you are sitting pretty! Before someone says something.. nope, I am not showing you the chart... but I am telling you the play. I am not here to be your teacher (unless you are paying me well) , although I do drop plenty of tips on how to do things.

Long | UBERNYSE:UBER
Possible Scenario: Long
Evidence: Price Action,
Call options 18th Feb, Strike 40$
*This is my idea and could be wrong 100%.

UBER Targeting The $23 Equality ObjectiveIn this update we review the price action in UBER and identify the next high probability trading opportunity nd price objective to target.

Uber is looking to MOVEEEEEE this week..I think Uber wants to make a decent move this week on earnings. What do you guys think? Buckle up.... it's going to get a little crazy this week in Uberland. I would be all for profit taking after that earnings move! Uber is maybe itching for the 42s... just maybe.

UBER longUber chart looking good going into ER. Will look to add UBER calls before or after earnings depending on how market looks monday

UBER - Continues to show weakness
forming a nice wedge on longer timeframe. Price is coiling, but still below short term MA.
Support at 33 and resistance at 43.
Hard to expect strong ER next week on this chart. 33 is more likely than 43 in the short term.

Long UBER .. Targeting $47Long UBER .. Targeting $47
SL @ 27.20
Weekly RSI Divergence
Stochastics pointing upwards

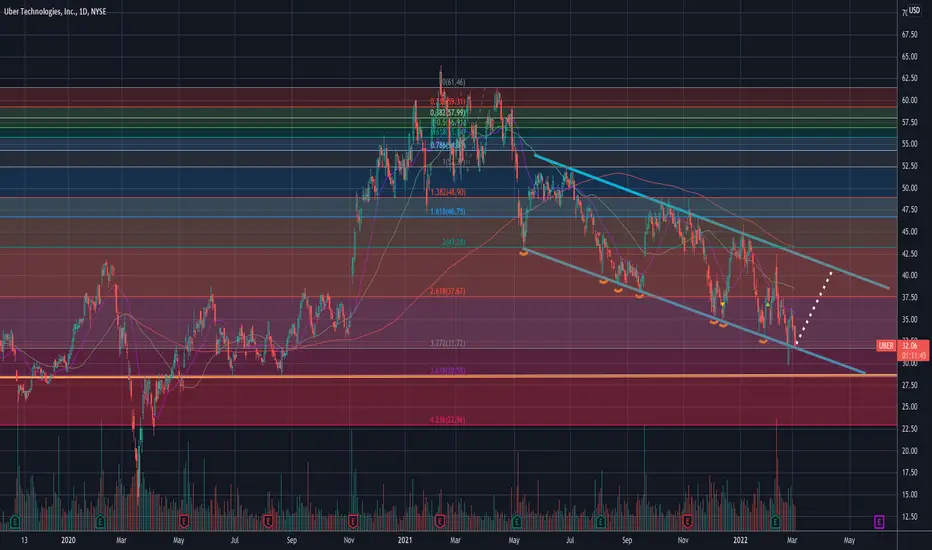
$UBER - descending channel playUber has been in descending channel and recently bounced off of the lower trend line and heading towards the upper trend line.
To reach to the upper trend line it will have to break through 39.20, 42.39 and $45 fib resistance areas.
Break above $45 is considered pattern breakout and could propel the stock to $55 area.
Target 1 - $47.50
Target 2 - $50
Target 3 - $55
Risk - unable to break above $39.20 and revisiting $34 area.
Stop loss should be below $34.
Worst case is $25.68.
———————————————————
How to read my charts?
- Matching color trend lines shows the pattern. Sometimes a chart can have multiple patterns. Each pattern will have matching color trend lines.
- The yellow horizontal lines shows support and resistance areas.
- Fib lines also shows support and resistance areas.
- The dotted white lines shows price projection for breakout or breakdown target.
Disclaimer: Do your own DD. Not an investment advice.

Uber - ShortI will be watching UBER for a short entry somewhere in the 41s-43s range.. not fine tuned yet on this one. if it makes it there this week, certainly am shorting heavily. Just keep in mind, earnings is coming up. While things tend to stay to the chart, with earnings you never know. Earnings , sometimes, is the time to let stupidity play out meaning they could pop it up just for liquidity, etc. It's coming down though...... down, down, down, down. LYFT I will be a buyer at the bottom as well for an investment. A ways off for that though.

UBER Channel TradeUber is at the bottom of a channel its been in for a year and a half. Could be a beautiful trade to the top of the channel. This is a relatively long swing compared to my usual taste so we'll see what happens.
Don't make any trade at all until you have done your own analysis. I am a stranger on the internet and it probably isn't smart to copy random people on the internet. With that being said, If you agree with the idea give me a little like, and maybe a follow. I usually only trade forex and futures, but am going to start getting back into stocks mainly because this correction made everything much cheaper. Most of my stock plays will be swings as opposed to day trades or long term trading.
So anyway, I hope everybody has a happy last friday of the month. Hopefully, February is much brighter, but for now, Have a great weekend and be safe.

Uber Analysis 30.01.2022Hello Traders,
welcome to this free and educational analysis.
I am going to explain where I think this asset is going to go over the next few days and weeks and where I would look for trading opportunities.
If you have any questions or suggestions which asset I should analyse tomorrow, please leave a comment below.
I will personally reply to every single comment!
If you enjoyed this analysis, I would definitely appreciate it, if you smash that like button and maybe consider following my channel.
Thank you for watching and I will see you tomorrow!

setting up for a nice bounce, on my watchlist next week 🦉uber sitting right above trend/local support zones, if we hold and bounce here the next target is 40.11, if keep dumping and move below trend support look for a test of 28.52 !
like and follow for more 💘