UBS suffers a major setbackUBS suffers a major setback: regulatory pressure hits its share price and dims buyback expectations
By Ion Jauregui –ActivTrades Analyst
UBS Group AG (Ticker SWX: UBSG.CH), Switzerland’s largest bank, faces a fresh blow. The Swiss government has proposed demanding an additional $26 billion in top-tier regulatory capital following the historic takeover of Credit Suisse. The market reaction was swift, triggering a particularly volatile session yesterday: after a brief spike, UBS shares dropped more than 7%, marking their worst day in two months—just as the bank had announced plans to distribute dividends in the coming year. Despite strong earnings and a $3 billion dividend payout plan for 2025, the market is now pricing in a potential negative impact on share buybacks in 2026 and 2027. Global banks are watching closely.
A new scenario of "Swiss regulatory slap"
The so-called “Swiss regulatory slap” aims to strengthen the national financial system, raising the CET1 ratio to 17% and requiring all foreign subsidiaries to be fully capitalized. UBS has labeled the proposal “extreme and unnecessary,” though it acknowledges that implementation would not begin before 2028. Even so, the market fears that the regulatory cost may directly affect shareholder returns.
Fundamental analysis: strong results under pressure
The Swiss bank closed the first quarter of 2025 with a net profit of $1.7 billion, thanks largely to a strong performance in its wealth management division, which brought in $32 billion in new assets—pushing total assets under management past $6.2 trillion. Return on CET1 capital reached 11.3%, though the officially reported figure stands at 9.6%, a target criticized by the regulator. UBS forecasts EPS growth of more than 25% annually over the next five years.
However, pressure to boost capital threatens to slow share buybacks and dilute mid-term profitability—especially if economic conditions tighten further. This apparent strength could be constrained if UBS is forced to prioritize capital retention over shareholder distributions, as many in the market now anticipate.
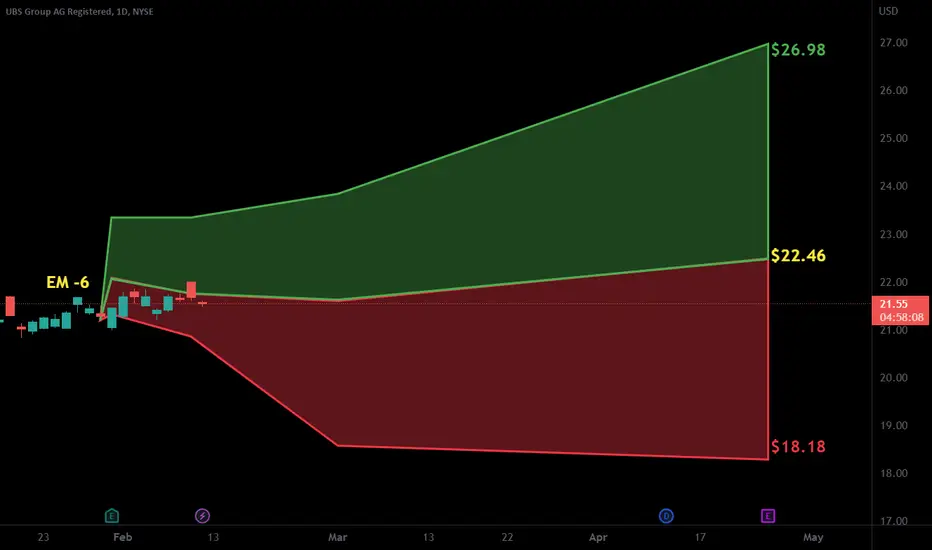
Technical analysis: chart signals warning signs
Following the announcement of new requirements, UBS’s chart is showing signs of weakness. After reaching yearly highs, the stock lost momentum and broke through key support levels. Volatility has increased significantly, and although the long-term ascending channel remains intact, the coming days will be crucial in determining whether this is a technical pullback or the beginning of a bearish trend.
From a technical standpoint, this week’s drop has placed UBS at a critical juncture. Key support lies at the 20.01 CHF lows, while the 26.41–28.79 CHF range appears to offer some short-term stability. Below that, 23.40 and 21.87 CHF serve as additional buffers against further downside. A sustained close above current levels is needed to restore the bullish outlook, which currently appears to have stalled. RSI remains in neutral territory, with no clear oversold signals, while MACD has lost its bullish crossover. The previously bullish moving average crossover that began in mid-May is now fading, showing signs of trend exhaustion. On the bright side, price profile analysis reveals a potential point of control above the current range, near 29.30 CHF. If the price manages a weak upward continuation toward that area, a rebound from the current 26.49 CHF level could unfold.
Conclusion
UBS faces a delicate moment: Switzerland’s regulatory push sends a clear message about systemic prudence but also raises doubts about the bank’s short- and mid-term appeal to shareholders. Despite its strong fundamentals and global leadership, the market remains cautious. Technically, the stock is at a crossroads: a rebound from key support could reignite optimism, but a break below 25 CHF would open the door to a gloomier scenario.
*******************************************************************************************
The information provided does not constitute investment research. The material has not been prepared in accordance with the legal requirements designed to promote the independence of investment research and such should be considered a marketing communication.
All information has been prepared by ActivTrades ("AT"). The information does not contain a record of AT's prices, or an offer of or solicitation for a transaction in any financial instrument. No representation or warranty is given as to the accuracy or completeness of this information.
Any material provided does not have regard to the specific investment objective and financial situation of any person who may receive it. Past performance is not reliable indicator of future performance. AT provides an execution-only service. Consequently, any person acting on the information provided does so at their own risk.
UBSG34 trade ideas

UBS EXTREMELY OVERSOLD! BUY BUY BUY+ This is a unique opportunity to buy one of the largest asset managers in the world at a very low price. With AI, they can reduce headcount in the coming years, while shilling their products to naive customers who still have high trust in this institution.
+ The stock is clearly oversold due to Retail Investors running for the exit
+ Volume is very low, this is not even a real capitulation

UBS - congress likes itJust watching for any large buys or sells among our corruption leaders and saw UBS flitter in today. The daily volume speaks volumes... or does it

UBS offers a great trading opportunity (+10% returns)🟢 UBS offers a great trading opportunity (+10% returns)
UBS is offering today a 10% returns or more opportunity risking just 2% in the deal.
Furthermore, UBS has multiple patterns supporting this.
As a bonus point, I will explain how to do this trade RISK-FREE.
✅ What pattern is unfolding in UBS?
UBS formed few weeks ago a triangle as a continuation pattern.
After the break of the pattern UBS returned a 6% in 1 month .
Now we are in a pullback to the previous resistance level of the pattern, which is now a support.
Here, we have the chance to buy, use a tight stop loss under the support line of the previous triangle (green) and under the previous minimum done few days ago.
💰 How to trade this chart pattern?
Buy near the support green line with a tight stop loss, probably around 2%. You can potentially earn more than 10% if the pullback to the pattern works.
If the trade falls under the blue line, we will enter an important bear market in UBS, but if that happen you would have done a SL of 2% and you will be ready to trade a SHORT with a massive and fast return.
🛡️ The risk management strategy
As we have done in so many previous ideas, remember you can split the position in 2.
- 50% of the position in a take profits as large as your stop loss (adapt SL and this 1st TP to local supports/resistance levels). In this case, a 2% (see the chart)
- 50% of the position to a price as large as the previous pattern, which would mean a profit of 15 to 20%. Anyway, to increase our chances to arrive to the second TP, we recommend using a 10% take profits.
The second TP is less likely to happen, but as soon as the first one has been reached (extremely high probability), this becomes a RISK-FREE TRADE.
✴️ ENJOY AND FOLLOW for more 😊

UBS Group Downtrend Line Breakout At $29.41 14.08.2024Apply risk management
Risk Warning: Trading in CFDs is highly speculative and carries a high level of risk. It is possible to lose all of your invested capital. These products may not be suitable for everyone, and you should ensure that you fully understand the risks taking into consideration your investment objectives, level of experience, personal circumstances as well as personal resources. Speculate only with funds that you can afford to lose. Seek independent advice if necessary. Please refer to our Risk Disclosure.
BDSwiss is a trading name of BDS Markets and BDS Ltd.
BDS Markets is a company incorporated under the laws of the Republic of Mauritius and is authorized and regulated by the Financial Services Commission of Mauritius ( FSC ) under license number C116016172, address: 6th Floor, Tower 1, Nexteracom Building 72201 Ebene.
BDS Ltd is authorized and regulated by the Financial Services Authority Seychelles (FSA) under license number SD047, address: Suite 3, Global Village, Jivan’s Complex, Mont Fleuri, Mahe, Seychelles. Payment transactions are managed by BDS Markets (Registration number: 143350)
Disclaimer

UBS (UBSG): Too Big to Fail?Remember this analysis from over four months ago? We didn't place a limit order at that time (which is why it's greyed out), but if you followed our setup during the livestream back then, congratulations! The chart reacted beautifully at the desired level, just as we anticipated.
In my opinion, this is a great-looking chart, showing a strong reaction at a key level. I'm now looking for some long plays on UBS to gain some exposure to the Swiss market. UBS is a relatively safe stock, which is a good thing to have during phases of uncertainty.
The worst-case scenario would be a banking crash, but we believe UBS is still too big to fail. As long as it maintains this status, we like it. I'll send out a limit order once I find a good setup. For now, I wouldn't recommend any FOMO into this stock, as it could be a dead cat bounce, but we'll closely monitor it for you.

UBS Group (UBSG): A Golden Opportunity for Investors?UBS Group (UBSG): SIX:UBSG
Considering that Switzerland is one of the first European countries potentially associated with interest rate cuts, sectors across the board, including the banking sector and specifically UBS Group, become quite intriguing. We've had to adjust and modify our analysis due to a breakout to the upside, suggesting a further upward trend before concluding the overarching trend. Please pay close attention if you're following along. We posit that Wave 2 concluded at 13.87 CHF, placing us in Wave 3.
We anticipate the reemergence of subordinate Wave ((iv)), which, in this case, should find support between the 23.6% and 38.2% levels. Given that all previous Wave 4s in UBS Group's pattern have been short and swift, we expect a repetition of this pattern, suggesting no further significant drops. Should we indeed pivot at the 38.6% extension level of 28.55 CHF and begin to develop Wave ((v)), we will issue a limit order once we observe tangible weakness in the price action. If there's an additional climb, our zone will be accordingly adjusted upwards.

UBS GROUP (UBSG): From Accumulation to ActionUBS GROUP (UBSG): SIX:UBSG
The banking sector has experienced significant turbulence over the past years, which has not spared UBS Group from Switzerland. Please note, this analysis is presented in Swiss Francs, not dollars, as we're examining it from the Swiss stock exchange perspective. Unusually, we're delving into the monthly chart here, where it's evident that we've been in an accumulation phase since 2008, lasting about 15 years with no significant progress. This is the second time we've broken out, but the first time we're sustaining levels above this zone for an extended period.
Our analysis starts at the all-time low of 7 CHF (Swiss Francs), also coinciding with the COVID-19 low, from which we've seen a completed 5-wave cycle. If our foresight holds, we believe the peak at 26.55 CHF marks the top. Following this, we anticipate forming a Wave A, an overshooting Wave B, and then a Wave C that drops below Wave A for a Wave (2) correction. This correction is expected to retrace between 50% and 61.8%, aligning with the notion that Wave 2 often reaches the level of the subordinate Wave 4, situated right at or slightly below the 61.8% mark.
With the stop-loss set below these two potential outcomes and within the outlined blue support zone, we foresee a significant rise for Wave (3). This wave is typically the longest or at least not the shortest of the three impulse waves, leading us to anticipate a climb to at least 48 CHF. Our course of action is to wait, assess how the scenario unfolds, and potentially scale into positions earlier. This remains to be seen, and we'll continue monitoring and keep you updated on developments.

UBSGUBS Group AG is a multinational investment bank and financial services company founded and based in Switzerland. Headquartered in Zürich, it maintains a presence in all major financial centres as the largest Swiss banking institution and the largest private bank in the world.
Screener buy/long candidate.

UBS base breakoutHo Ho Ho
what do we have here...
UBS monthly chart... with a breakout after massive 15 years base building process through a V=shaped spike, a double bottom and an inversed head & shoulder... next target CHF 35 ?

"This Strategy Is Representing 3 Steps"What Did you learn from watching this video?
In this video we look at the rocket booster strategy
This strategy is representing 3 steps:
#1 - 50 EMA
#2- 200 EMA
#3- EMA Crossover
To learn more watch this video again
Disclaimer:This is not financial advice do your own research before you buy or sell anything in trading.

UBS Group AG - “UBS Group agrees $3.25bn rescue deal for rival Credit Suisse” reads the headlines. Time for Switzerland to bring out the bunting? Or was this one deal UBS should really have said no, not interested.
There are 10 days for the stock market to undo the largest bearish engulfing candle the monthly UBS Group chart has ever printed.
Notwithstanding the candle the highest recorded negative divergence with price action has printed. A record 9 oscillators have printed negative divergence with price action since records began.
Where is price action going? On the above monthly chart there is a projected 50% correction for share price following the rising wedge breakout and resistance confirmation.
On the 3-month chart below a Gravestone DOJI candle is printing. This really is the mother of all Gravestone DOJI candles. Why? For one it is printing under a continuation pattern following the 2007/8 banking crisis. The 2nd is the size of the candle itself, there is a huge amount of selling pressure under resistance. IF this candle confirms by the end of April, IF, then the UBS Group fails as an entity. Price action will fall to 1.90, Credit Suisse levels.
Ww
3-month chart
Sources:
www.ft.com

More Upside in UBS?Swiss financial giant UBS rallied to a 15-year high over the summer. Now it’s pulled back, and traders may look for more upside.
The first pattern on today’s chart is the bullish gap on August 11 after management voluntarily ended a government guarantee covering potential losses from its acquisition of Credit Suisse.
UBS rallied for the next month and hit its highest level since 2008 on August 31. It then stalled and worked its way lower through late October.
The pullback resulted in a falling trendline, but UBS broke that resistance in early November and has remained above it since.
The stock is now trying to fight back above its 50-day simple moving average. The 8-day exponential moving average (EMA) has also crossed above the 21-day EMA, a potentially bullish short-term signal.
MACD is also starting to turn higher.
Finally, lower inflation in the U.S. is boosting the Euro . Further weakness in the greenback could favor a global blue chip like UBS.
TradeStation has, for decades, advanced the trading industry, providing access to stocks, options, futures and cryptocurrencies. See our Overview for more.
Important Information
TradeStation Securities, Inc., TradeStation Crypto, Inc., and TradeStation Technologies, Inc. are each wholly owned subsidiaries of TradeStation Group, Inc., all operating, and providing products and services, under the TradeStation brand and trademark. TradeStation Crypto, Inc. offers to self-directed investors and traders cryptocurrency brokerage services. It is neither licensed with the SEC or the CFTC nor is it a Member of NFA. When applying for, or purchasing, accounts, subscriptions, products, and services, it is important that you know which company you will be dealing with. Please click here for further important information explaining what this means.
This content is for informational and educational purposes only. This is not a recommendation regarding any investment or investment strategy. Any opinions expressed herein are those of the author and do not represent the views or opinions of TradeStation or any of its affiliates.
Investing involves risks. Past performance, whether actual or indicated by historical tests of strategies, is no guarantee of future performance or success. There is a possibility that you may sustain a loss equal to or greater than your entire investment regardless of which asset class you trade (equities, options, futures, or digital assets); therefore, you should not invest or risk money that you cannot afford to lose. Before trading any asset class, first read the relevant risk disclosure statements on the Important Documents page, found here: www.tradestation.com .

UBS: WOLFE Wave & Butterfly patternUBS: WOLFE Wave & Butterfly pattern
to monitor :
EMA.200
Fibonacci Levels
ICHIMOKU Levels

UBS to da moon? We just broke out of a 15-year base!We just broke out of a 15-year base!
The collapse of Credit Suisse made UBS even stronger than before...if we can stay above the base we might go to the moon

UBSEntry Price:22.44 (Stop Buy)
SL:21.17
TP:25.63
Bullish Signal:
Financial Sector is strong
Low ATR
MACD crossing up
Price above all MA and trending up

Trading Idea - #UBSMy trading idea for UBS following the announcement that the shares bought back last year will be used to finance the takeover of Credit Suisse. SHORT/SELL
Apart from that, the price is battling at a significant resistance level. A breakthrough is unlikely in consideration of the current banking crisis.
Entry: 21.00 USD
Target: 15.50 USD (Profit 26%)

$UBS inverted head and shoulders on the monthlyI'm seeing an inverted head and shoulders setting up on UBS bank.

short position on UBSGMy strategy is based on price action with the reading of certain indicators that I like while respecting all the values that define the stock maket

UBS - Range What more volatile than banking! Trading heaven. Trade range what I can see, within the few minutes I've paid attention. The obvious Gap, 0.618 failing the mid range and retest.

Volume Spread Analysis Explained - Buying From Panicked SellersWas UBS a great buy last week, watch this and understand what really moves price, and its not the news, its the "Smart Money"!

$UBS with a bullish outlook following its earnings #Stocks The PEAD projected a bullish outlook for $UBS after a positive under reaction following its earnings release placing the stock in drift A with an expected accuracy of 50%.
UBS and other companies announced $5 billion share buyback.Up
Up
Up
UBS and other companies begin a $5 billion share buyback.
