X - United States Steel CorporationComing down to test 30.21 for the first time. Long term uptrend line is still holding. Confident that it'll hit 34.33 as first target. RSI showing a little oversold situation right now. LONG WITH ME BOYS
obv steel trade tariffs are still a concern but I think it should be already priced in. So there is a risk to this trade.
USSX34 trade ideas

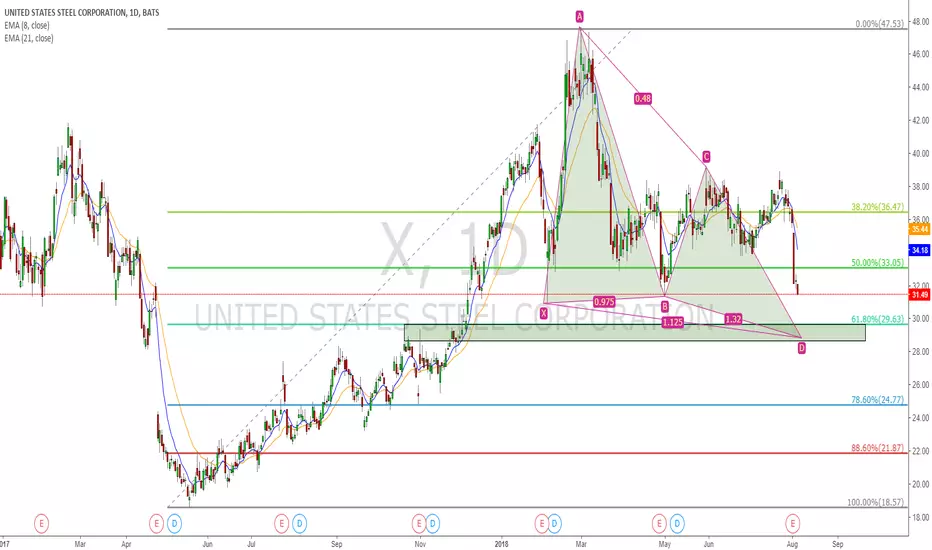
X 0.618 retracement and bullish butterfly long .X is my best name of trading, having much good time with it these years.
While I've been flat on it for quite a while that this is surprisingly the same trade as what I posted 3 months ago.
Actually nothing really changed for the past 3 months, but it's finally about to break the B point,
which means this trade is about to be on your mark yo!
29.50 is the spot to start looking for reversal sign
Let's see how it goes!
X - Upward channel break down short to $26.13X seems broken down from an upward channel. Money flow dropping really sharply deep into the negative side. We think it has good change to decline down to 26 level.
To play this we would consider $32 October puts which last traded for $2.36


X - (Short Premium) Selling naked puts for premium $$$Selling premium into large selloff using naked puts. Sold the 30 strike put for .96, 33 delta, 50 DTE. This stock is 30% off from its high and pretty beat up. Hoping for a price pop from major support.

Steel yourselves!I think we are going to see a pretty solid pop higher in US Steel. Wonder what the media will attribute to the cause.

THE WEEK AHEAD: TSLA, AAPL, BIDU, X EARNINGSAn interesting earnings announcement docket ahead this week:
BIDU (rank 57/implied 39) announces Tuesday after market close; AAPL (rank 54/implied 26), Tuesday after market; TSLA (rank 87/implied 70), Wednesday after market; and X (rank 61/implied 53), Wednesday after market.
Out of these, TSLA has the kind of volatility metrics I'm looking for in an earnings related volatility contraction play, but due to size of the underlying, it'll have to be defined risk, if anything. Because it can be a mover and its weekly expiry liquidity isn't great, my tendency would be to go out to the monthly since it's not all that far away in time and is likely to yield a fairer price fill. Preliminarily, the Aug 17th, 20 delta 250/260/337.5/347.5 is paying 3.07 at the mid, but I'd only want to play if I could get at least 1/3rd the width of the 10-wide or 3.33.
For similar reasons, I'd use the August monthly with BIDU (weekly expiry liquidity): the Aug 17th 20-delta 225/235/277.5/287.5 is paying 3.03; go in a little tighter to the 23 delta, and you get paid 2.89 for the 7 1/2 wide 230/237.5/275/282.5. I'm frankly loathe to tighten these puppies up because as we've had a couple greater than one standard deviation movers this season (FB, TWTR), and no one (generally) likes to get whipped.
In all likelihood, however, if I play anything, it'll be X, since I feel comfortable going naked on that underlying due to size and just generally prefer managing a broken naked over a broken defined: the Aug 17th 37 short straddle is paying 3.83 at the mid with a 25% take profit target of .96 and the Aug 17th 33.5/41.5 paying 1.17 with a 50% take profit of .59; that >1.00 for a twenty-ish delta short strangle is decent for a $37 underlying.
AAPL just doesn't have the juice, with below 30% background implied ... .
On the exchange traded front, it's more of the same ... . Volatility can be found in EWZ and XOP, but even then, it isn't as great as it was a few weeks ago: EWZ is 30.6%; XOP at 26.2%. Nevertheless, I'm maintaining positions in those as core premium selling positions for the time being, since XOP has had comparatively decent premium in it over time, and EWZ is going on a several week binge of greater than 30% implied.
Major Food Group Trades: TLT has come off of 122.50 I've temporarily marked as the place to short from, so I'm waiting for a revisitation before re-upping. Gold has been absolutely hammered, but I'm unable to get into anything satisfactory in GLD; the upward call diagonal metrics always require me to pay more than 75% of the spread width, which makes a play unappealing. I'll look again this week, but have been repeatedly rebuffed. And, in spite of the little sell-off we had on Friday, broad market doesn't look all that sexy: SPY implied is at 12.2%, QQQ at 19%, IWM at 16.5% and EFA at 4.7% -- all well in the lower half of their 52-week ranges.


Long X via callsFairly good R:R here.
Bought 3 Jul20 $35 calls for $2.03 each.
Stop at $34.28, upside target is the breakout of the ~$38 level.

Closing in on SupportOversold indicators, price nearing support. Watching for a turn in the 34.38 or 33.44 area. Upon pivoting, must stay above support on the close to turn this into a buy.


X bullish butterfly pattern long opportunityIt's hard to believe that it's the 1st idea that I post for this X, as it's my best name of all time in terms of trading.
It still has great volatility, but it didn't really have many daily chart trades that are in line with my demonstrating system on TradingView.
Finally after it's earning report, it got a potential bullish butterfly pattern, around 29.30, and nice reversal signs are crucial for this trade.
If it can reach 29.30, the important 30.00 fig breakdown had already happened.
Let's see how it goes!

$X US Steel - Head & Shoulders$X US Steel - Confirmed head & shoulders . Downside to mid-20s in the near term.

Good Long potential for X short term tradeIn the past , it has tested the trend line multiple time.
It's a good long entry these few days.
Stochastic 15 and 30 mins have shown buying signal. Still waiting for hourly and maybe 4hours buy signal.
SL 29.27
Target : I think easily $38 and above.
Let me know what you guys thought.


