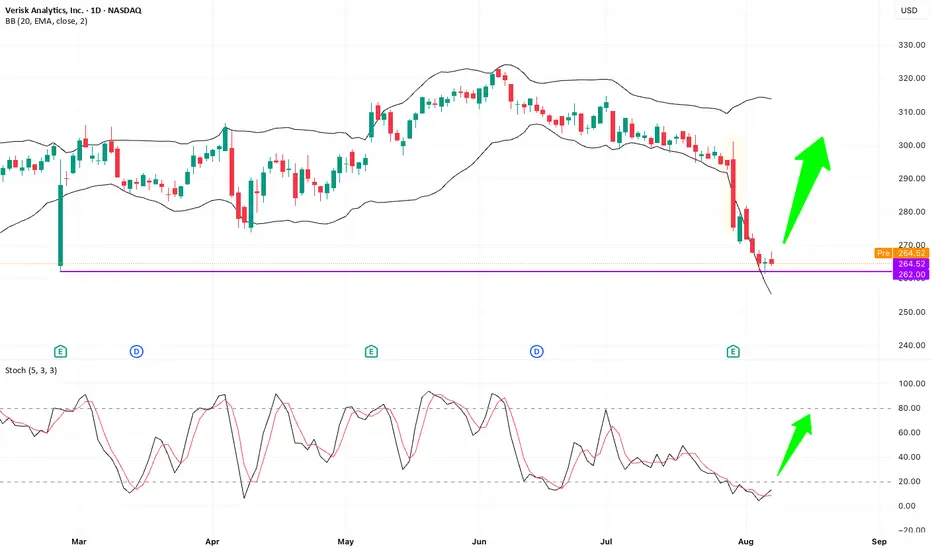
VRSK – Bullish Pin Bar at Key Support after Earnings Flush?NASDAQ: VRSK delivered good quarterly results, yet price action showed a sharp flush-down bar breaking below the lower Bollinger Band. Recently, price retested the key previous low level at $262, triggered some small stop-losses, and closed back at $262 with a bullish small pin bar. Double bottom se
43,860.00
0.00 BRL
5.17 B BRL
15.54 B BRL
About Verisk Analytics, Inc.
Sector
Industry
CEO
Lee M. Shavel
Website
Headquarters
Jersey City
Founded
1971
ISIN
BRV1RSBDR004
FIGI
BBG00RHFLB73
Verisk Analytics, Inc. engages in the provision of data, analytics, and technology services. The firm also offers predictive analytics and decision support solutions to clients in rating, underwriting, claims, catastrophe, and weather risk fields. It operates through the Insurance segment. The Insurance segment offers fraud-detection solutions including review of data on claim histories, analysis of claims to find emerging patterns of fraud, and identification of suspicious claims in the insurance sector and offers solutions and services primarily through annual subscriptions or long-term agreements. The company was founded in 1971 and is headquartered in Jersey City, NJ.
Related stocks
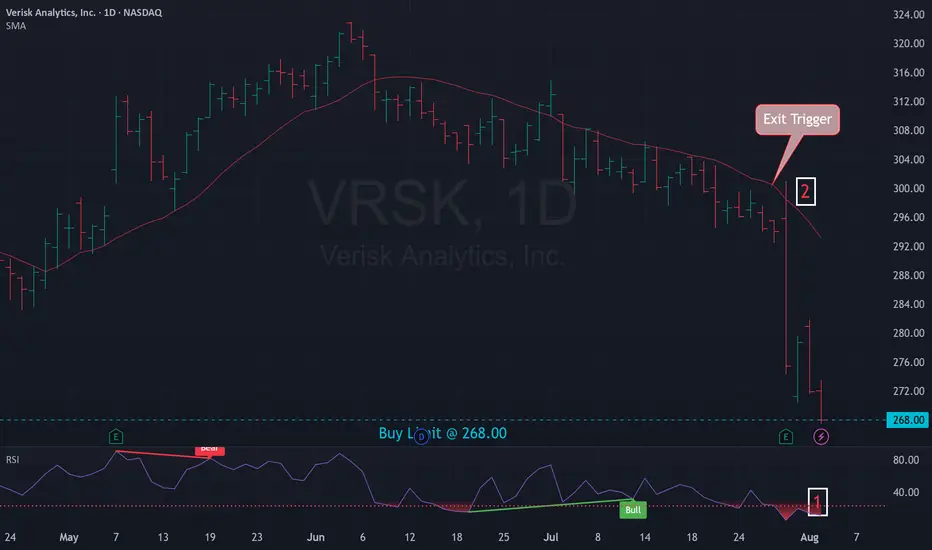
Mean Reversion Trade: VRSK1. RSI in oversold region
2. Price likely to rebound back the the mean
Trade Rules:
Entry Trigger - RSI has cross below oversold region, enter limit buy at close price
Exit Trigger - Close at market when close price cross above exit trigger (Red line)
VRSK - 5 months HEAD & SHOULDERS══════════════════════════════
Since 2014, my markets approach is to spot
trading opportunities based solely on the
development of
CLASSICAL CHART PATTERNS
🤝Let’s learn and grow together 🤝
══════════════════════════════
Hello Traders ✌
After a careful consideration I came to the conclusion that:
-

long $VRSK ideacontinuation pattern breakout
bullish staging on higher time frames
blue sky breakout attempt
high probability of follow through
entry $273
stop $261.5
buy 8 shares
max risk $92
sell at fib nodes
+$28 (sell 2 shares at pattern high, set stop break even)
+$96 (sell 3 shares at 1.61 fib)
+$305 (s

VRSKVerisk Analytics, Inc. is an American multinational data analytics and risk assessment firm based in Jersey City, New Jersey, with customers in insurance, natural resources, financial services, government, and risk management sectors.
Emerging from a short term consolidation zone.

VRSK Entry, Volume, Target, Stop, ResistanceWhen price clears: 222.93
With daily volume greater than: 1.14M
Target: 249.50 area
Stop: Depending on your risk tolerance; 214.08 gets you 3/1 Risk/Reward.
Resistance: 231.50 area
This swing trade idea is not trade advice and is strictly based on my ideas and technical analysis. No due diligence o

VRSK repulsion from bottom of side trendIdea:
Born of local growing trend
Buy - current price
SL < 169.49
Fundamentals:
- Pro: Growing Gross Margin
- Pro: High RoE
- Con: Debt to Equity > 1
Technicals:
- Pro: Clean buy plan
- Con: Reporting is close

$VRSK with a Neutral outlook following its earnings #Stocks The PEAD projected a Neutral outlook for $VRSK after a Negative Under reaction following its earnings release placing the stock in drift D with an expected accuracy of 83.33%.

bullish reclaim of 200WMA for this data companythe fed has quietly halted bottom line reductions of the balance sheet, markets should rally leading into the holiday season and then tank once again. Data is the new currency. Expect Data companies to out perform.

$VRSK with a Bullish outlook following its earnings #Stocks The PEAD projected a Bullish outlook for $VRSK after a Positive Under over reaction following its earnings release placing the stock in drift A with an expected accuracy of 100%.

See all ideas
Summarizing what the indicators are suggesting.
Oscillators
Neutral
SellBuy
Strong sellStrong buy
Strong sellSellNeutralBuyStrong buy
Oscillators
Neutral
SellBuy
Strong sellStrong buy
Strong sellSellNeutralBuyStrong buy
Summary
Neutral
SellBuy
Strong sellStrong buy
Strong sellSellNeutralBuyStrong buy
Summary
Neutral
SellBuy
Strong sellStrong buy
Strong sellSellNeutralBuyStrong buy
Summary
Neutral
SellBuy
Strong sellStrong buy
Strong sellSellNeutralBuyStrong buy
Moving Averages
Neutral
SellBuy
Strong sellStrong buy
Strong sellSellNeutralBuyStrong buy
Moving Averages
Neutral
SellBuy
Strong sellStrong buy
Strong sellSellNeutralBuyStrong buy
Displays a symbol's price movements over previous years to identify recurring trends.