WSP1! trade ideas
Adding Demand Zone below, Since we broke the zone, highlighting the next demand zone, have in mind no advice being given here, but if you look at supply/demand, you should be aware of the other moves within the market, also the red line
#tradewhatyousee

ESM2025, go lower to go higher?What do you track? fundamentals? technicals?
Investor sentiment, is confusing at times,
#tradewhatyousee

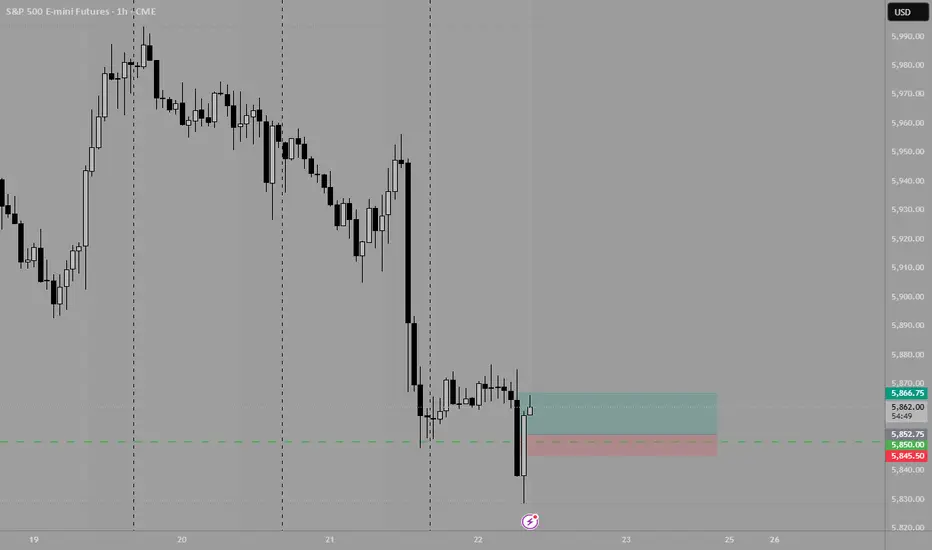
Overnight consolidation? into demand area?Maybe, maybe we are in a demand area, and consolidating, the reaction or change of character needs to show strength in order to go higher, otherwise, run the stops below in order to go higher, lots of action to take

SPY to pullback AFTER bullish Thursday Friday Gap Fill TargetI was initially skeptical of the bearish case because we were able to stand strong against the Moody's downgrade, but I guess all good things come to an end, at least temporarily, especially with the bond yields spiking higher today.
I drew a channel off the downtrend and I think it is pretty wide, so I would expect us to follow it at least for the next week, obviously if we break to the upside then you can probably put the bearish concerns to rest, but until then with the lower low I think we are decidedly bearish for now, especially if we make a lower high to end the week (pretty likely)
I wouldn't pile into puts just yet, as that is what the greedy retail trader is doing, and we all know how that works, also seasonally the Thursday Friday leading into memorial day are usually bullish, combined with Bitcoin making new highs, I think we will actually have relatively neutral to bullish price action to close the week.
The Tuesday-Thursday after memorial day are seasonally a bit more bearish, so I think that is where we will see a surprise sell-off and possible fill of that huge bar around the 5720 area.
There is a lot of price action between 5600 and 5700 so I think the support there will be strong, this is only a pullback and I am still bullish long term.
Good Luck and Happy Trading.
ES Possible Long setupES is returning back to a Strong Demand zone on the 15 minute timeframe, I've refined the entry to a 5 min timeframe demand zone within the 15 minute zone, automatic target 2r, can target higher if wanted

S&P ES Long setup target 5963.50 / Calls SPY target 596Fibonacci technical analysis : S&P 500 E-mini Futures CME_MINI:ES1! has already found support at the Fib level 78.6% (5623.50) of my Down Fib. Last Daily candle (May 2) has closed above retracement Fib level 78.6%. My Down Fib guides me to look for CME_MINI:ES1! to eventually go up to hit first target at Fib level 127.2% (5963.50).
CME_MINI:ES1! – Target 1 at 127.2% (5963.50), Target 2 at 161.8% (6205.50) and Target 3 at 178.6 (6322.75)
Stop loss slightly below the 61.8% retracement Fib level (5506.25).
Option Traders : My AMEX:SPY chart Down Fib shows price to go up to Target 1 at 127.2% (595.82), Target 2 at 161.8% (620.50) and Target 3 at 178.6 (632.50)
Stop loss slightly below the 61.8% retracement Fib level (549).
Enjoy the trading process and take time to smell the roses🌹

Rest dayWith the dramatic move in the S&P daily chart based on concerns, I do not look for another dramatic move lower but rather Thursday trading inside of Wednesday's range. What could change this is fundamental information that increases the markets nervousness and continues the break to lower prices.

MES Short🔴 High Risk Short
Bearish Market Structure Shift caused by price meeting origin of Daily MSS from Mar04. Trade mapped on the hourly timeframe; focusing on impulsive swing high at $5956.25 that created MSS.
Entry on measured 61.8% fib retracement @ $5914.75.
TP1: $5873.25 (1R)
TP2: $5822.25 (2.25R)
Second take profit level lines up with both 200SMA + bullish 4H channel support , adding confluence to trade idea. It stands to reason price will retest the support of a longstanding bullish channel.
Notes:
•Stops moved to BE once TP1 hit
•Trade is high-risk due to SL having no significant higher timeframe importance.
The reason I’m focusing on this leg of price action rather than the 4H high at $5993.25, is because this hourly high specifically created the higher timeframe MSS. It suggests there’s an unusually high amount of sellers at that level.

Equity Prices FallingEquity indices selling pressure is continuing from yesterday, with Russell leading the way to the downside being down over 2.5% on the session while the S&P and Nasdaq both were about 1.5% lower. Looking at relative strength on a daily basis for the S&P, the market was trading at the highest level since July of 2024 after having 6 consecutive days of trading higher. Gold and Silver also traded higher on the session over 1% and have marked a higher high each of the last 3 trading sessions.
Crypto futures also traded higher on the session with Bitcoin and Solana leading the way, with Bitcoin hitting a new all time high price of $110,175. Relative strength is also relevant for Bitcoin on a daily basis as the level has not been this high since December of 2024. Tomorrow, more economic data will be released looking at PMI and Initial Jobless Claims. Initial jobless claims for 2025 have been directly in line or better than expected 14 out of the last 20 reports, and this report has 3rd highest forecasted number of the 2025.
If you have futures in your trading portfolio, you can check out on CME Group data plans available that suit your trading needs tradingview.com/cme/
*CME Group futures are not suitable for all investors and involve the risk of loss. Copyright © 2023 CME Group Inc.
**All examples in this report are hypothetical interpretations of situations and are used for explanation purposes only. The views in this report reflect solely those of the author and not necessarily those of CME Group or its affiliated institutions. This report and the information herein should not be considered investment advice or the results of actual market experience.

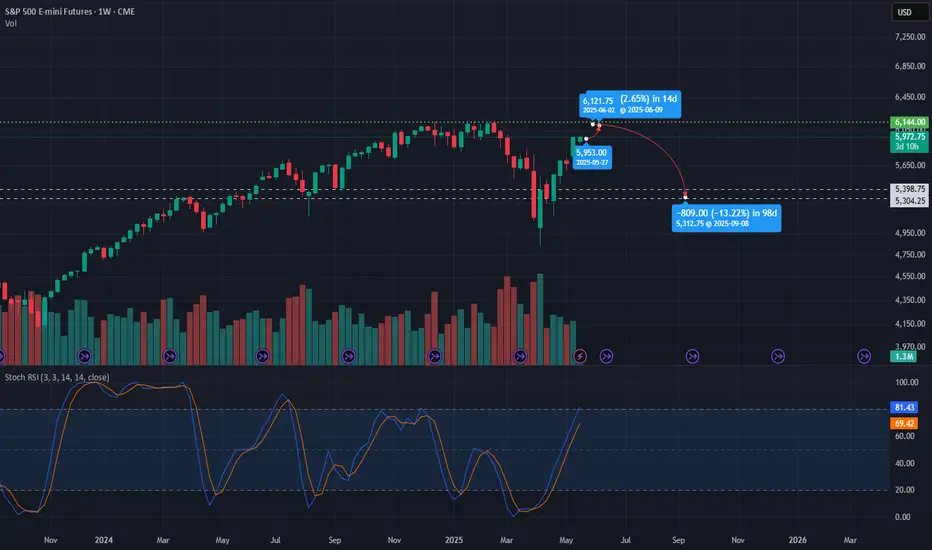
Bullish Weekly Bias IndexesBullish Indexes Target on Weekly perspective.
Expecting Nasdaq to breach trough the W IFVG and reach 22,5588.00 within the next few weeks.
Expecting S&P500 to use the W IFVG as "Support" and reach 6,235.00

Looking to buy ESES is sustaining bullish structure on 1H and 4H. Currently in discount zone. ES swept liquidity below daily lows, filled 4H FVG and starting to reverse. 1:3 RR long trade potential.

Sideways market environmentThe lack of follow-through to the upside on Tuesday in the S&P 500 daily chart implies a market waiting for new information and a sideways market environment which is the expectation for Wednesday's movement.

The bottom wick of the April candleThe acceleration of the uptrend following the March 2020 pandemic crash and .... the bottom wick of the April monthly candle is larger than the entire range of every other monthly candle, except for March 2020....that pandemic crash...
SPX seems to be overbought, and may seen soon a doble top configDouble top config seems to be a very probable configuration.
The 10Y bond yields are high 4.4%
The volumes are in decline and the stochastic RSI enters the overbuy zone.
Where is the Stock Market going tomorrow? Trade Journal 05/19/25EOD accountability report: +500
Sleep: 3.5 hours , Overall health: tired
What was my initial plan?
Short if market went under 5920, long with X7 buy signals, and short at 5968 area, and long if we retrace to 5925s
overall market went accordingly to Bullish structure and x7 buy signal. that's the whole reason of the system, to let you know what the market is and all you need to do is follow accordingly instead of fighting it.
Daily Trade recap based on VX Algo System
— 7:00 AM Market Structure flipped bullish on VX Algo X3!
— 9:36 AM VXAlgo X7 Buy Signal, ticker = NQ1!, price = 21281.25
— 2:00 PM VXAlgo ES X3 Sell Signal
— 2:35 PM Market Structure flipped bearish on VX Algo X3!
Next day plan--> Above 5920/5900 = Bullish, if we lose 48min support at 5928 --> 5875 next
Video Recaps -->https://www.tradingview.com/u/WallSt007/#published-charts

S&P 500 | Blue Box as Margin of SafetyWhen the index returns to the blue box, it reaches a zone forged by genuine buying interest and technical alignment. In a disciplined, data‑driven approach, this area serves as our first line of defense.
Why It Matters
• Past reactions show price pauses and reversals here, revealing real demand.
• It coincides with key footprint volume clusters where buyers have stepped in.
Entry Criteria
Higher‑Time‑Frame Stability
Confirm price holds within or above the blue box before considering a position.
Lower‑Time‑Frame Confirmation
Wait for clear breakouts or higher‑lows on short‑term charts backed by rising footprint volume.
Strict Risk Control
If price breaks through without retest or volume support, stand aside and seek a clearer setup.
By treating the blue box as our margin of safety and relying on actual volume footprint data, we trade with prudence and let the market’s real signals guide our decisions.
📌I keep my charts clean and simple because I believe clarity leads to better decisions.
📌My approach is built on years of experience and a solid track record. I don’t claim to know it all but I’m confident in my ability to spot high-probability setups.
📌If you would like to learn how to use the heatmap, cumulative volume delta and volume footprint techniques that I use below to determine very accurate demand regions, you can send me a private message. I help anyone who wants it completely free of charge.
🔑I have a long list of my proven technique below:
🎯 ZENUSDT.P: Patience & Profitability | %230 Reaction from the Sniper Entry
🐶 DOGEUSDT.P: Next Move
🎨 RENDERUSDT.P: Opportunity of the Month
💎 ETHUSDT.P: Where to Retrace
🟢 BNBUSDT.P: Potential Surge
📊 BTC Dominance: Reaction Zone
🌊 WAVESUSDT.P: Demand Zone Potential
🟣 UNIUSDT.P: Long-Term Trade
🔵 XRPUSDT.P: Entry Zones
🔗 LINKUSDT.P: Follow The River
📈 BTCUSDT.P: Two Key Demand Zones
🟩 POLUSDT: Bullish Momentum
🌟 PENDLEUSDT.P: Where Opportunity Meets Precision
🔥 BTCUSDT.P: Liquidation of Highly Leveraged Longs
🌊 SOLUSDT.P: SOL's Dip - Your Opportunity
🐸 1000PEPEUSDT.P: Prime Bounce Zone Unlocked
🚀 ETHUSDT.P: Set to Explode - Don't Miss This Game Changer
🤖 IQUSDT: Smart Plan
⚡️ PONDUSDT: A Trade Not Taken Is Better Than a Losing One
💼 STMXUSDT: 2 Buying Areas
🐢 TURBOUSDT: Buy Zones and Buyer Presence
🌍 ICPUSDT.P: Massive Upside Potential | Check the Trade Update For Seeing Results
🟠 IDEXUSDT: Spot Buy Area | %26 Profit if You Trade with MSB
📌 USUALUSDT: Buyers Are Active + %70 Profit in Total
🌟 FORTHUSDT: Sniper Entry +%26 Reaction
🐳 QKCUSDT: Sniper Entry +%57 Reaction
📊 BTC.D: Retest of Key Area Highly Likely
📊 XNOUSDT %80 Reaction with a Simple Blue Box!
📊 BELUSDT Amazing %120 Reaction!
📊 Simple Red Box, Extraordinary Results
I stopped adding to the list because it's kinda tiring to add 5-10 charts in every move but you can check my profile and see that it goes on..

How to Manage Slippage on TradingViewThis tutorial explains what slippage is and how it relates to market and limit orders as well as times when you might expect higher than normal slippage.
Disclaimer:
There is a substantial risk of loss in futures trading. Past performance is not indicative of future results. Please trade only with risk capital. We are not responsible for any third-party links, comments, or content shared on TradingView. Any opinions, links, or messages posted by users on TradingView do not represent our views or recommendations. Please exercise your own judgment and due diligence when engaging with any external content or user commentary.
Stop-loss orders are submitted as market orders and may be executed at prices significantly different from the intended stop level, particularly during periods of high volatility or limited liquidity. Stop-limit orders carry the risk of not being executed at all if the market does not reach the limit price. It is important to understand that neither type of order guarantees execution at a specific price. Market conditions can change rapidly due to scheduled or unexpected news events, and even quiet markets may experience sudden disruptions. These factors can affect trade execution in ways that may not be predictable or controllable.

#MES INTRADAY ANALYSISThis chart outlines my percieved support and resistance levels based on price action and volume observation,I also use VWAP and AVWAP to identify potential value areas.The 65 MA on 30 min chart approximates the 5 day MA (Shout out to Brian Shannon of Alphatrends for alerting me to this) I also pay attention to daily settlement prices and of course Initial Balance highs and lows.

Yearly Open in Play — Is This the Real Bull or Just a Bounce?CME_MINI:ES1!
Macro Recap
Late Friday, Moody’s lowered the US’s sovereign rating from AAA to Aa1. This reflects a unanimous downgrade of the US, joining S&P and Fitch in stripping the US of its AAA status.
Would this result in a sell-off?
In our analysis, and consensus from the Street, is that it will be contained since the downgrade puts Moody’s in the same camp as S&P and Fitch.
There are talks of renegotiating UK–EU trade deals, which has boosted cable.
On the geopolitical side, not much has changed. Ceasefire talks are ongoing but stuck in neutral. No new catalysts—yet.
The spotlight, however, is firmly on the Fed. Over the weekend, President Trump called on Chair Powell to cut rates “before it’s too late,” echoing a post from April 17th where he labeled Powell’s speech “a complete mess” and added, “Powell’s termination cannot come fast enough.”
With a packed schedule of Fed speakers this week, the real question is whether they’ll double down on the Fed’s independence—or bend toward political gravity, especially with Trump reportedly eyeing the top job.
Economic data is light. That puts full attention on the Fed and headline risk. Traders should stay nimble and alert. Momentum could shift fast.
Markets are now pricing in two cuts of 25 bps each for September and December 2025.
This is very different from market pricing one month ago, when reciprocal tariffs were announced.
Monitoring rate cut expectations is another key theme this week, with multiple Fed speakers scheduled.
ES Futures
ES Futures have been one-time framing up — i.e., creating higher lows — on the weekly timeframe.
ES Futures have also created higher highs.
Key Levels:
• March 2025 High: 6052.50
• 2025 Yearly Open: 6001.25
• Previous Week High: 5977.50
• Previous Week Mid: 5856
Bull Market—or Just a Bear Bounce?
That’s the question traders are asking.
From our perspective, this looks like a recovery from a trade policy shock. The market took the hit, recalibrated, and bounced back.
But let’s not get ahead of ourselves. After a move this strong, some pause is natural. We’re watching for potential consolidation or profit-taking, especially with price action still holding below the yearly open.
Caution is warranted here—momentum’s in play, but the structure hasn’t fully confirmed the shift.
Scenario 1: Another Up Week, Capped by Yearly Open
In this scenario, the rally will be contained as the yearly open remains a strong pivot and resistance zone.
The LIS (Line in the Sand) for short trade opportunities is the yearly open pivot.
Scenario 2: Range-Bound Week
In this scenario, we expect markets to consolidate, remaining above last week’s low and finding support at the prior week’s mid-range.
We will look to initiate longs from the previous week’s mid-range, looking for level-to-level scalping opportunities in a range-bound market.

Where is the Stock Market going tomorrow? & Trade Journal 05/16EOD accountability report: +1106
Sleep: 6 hours , Overall health: Good
We keep chugging up for no reason, breaking past all resistance points on fume but friday after hours shows that we are starting to lose cruical supports and they were just squeezing the bears.
Daily Trade recap based on VX Algo System
— 5/16/2025 9:00 AM Market Structure flipped bearish on VX Algo X3!
— 5/16/2025 9:50 AM VXAlgo YM X1 Buy Signal
— 5/16/2025 12:03 PM Market Structure flipped bullish on VX Algo X3!
— 5/16/2025 1:40 PM VXAlgo ES X1 Sell Signal(double sell) C+ set up
— 5/16/2025 3:30 PM VXAlgo NQ X1 Sell Signal (Triple sell) B+ set up
Next day plan--> Above 5920/5900 = Bullish, if we lose 5920 --> 48min support at 5900, if 5900 is lost then we can go to 5800.
Video Recaps -->https://www.tradingview.com/u/WallSt007/#published-charts

ES1! (S&P500 Mini Futures) - Support Trendline Price Test -DailyES1! (S&P500 Mini Futures) price is currently testing a support trendline around $5900.
If several daily Price candles close below $5865 this month, a pullback in the price can occur (rising wedge pattern).
Volume has been decreasing in May 2025, compared to March and April.
Finance and Technology corporate earnings season has passed. The U.S. government 90-day tariff pause is set to expire in early July (pending trade deal negotiations with other countries).
Tariff and trade deal news, breaking news, corporate earnings, government law changes, consumer sentiment, inflation data, the FOMC, and presidential announcements can all affect the prices of stocks and ETFs.

phantom buyers = phantom sup es up +150 pts higher than last print on di+ for the month of may.
appreciate the risk.
___
n200 @ 5818
interim r1 on 1d @ 5994 s1 @ 5921
bearish below 5994
macro r1 on 1w @ 6040 r2 @ 6049
bearish below 6049
macro s1 on 1d @ 5586 s2 @ 5451
bullish above 5451
