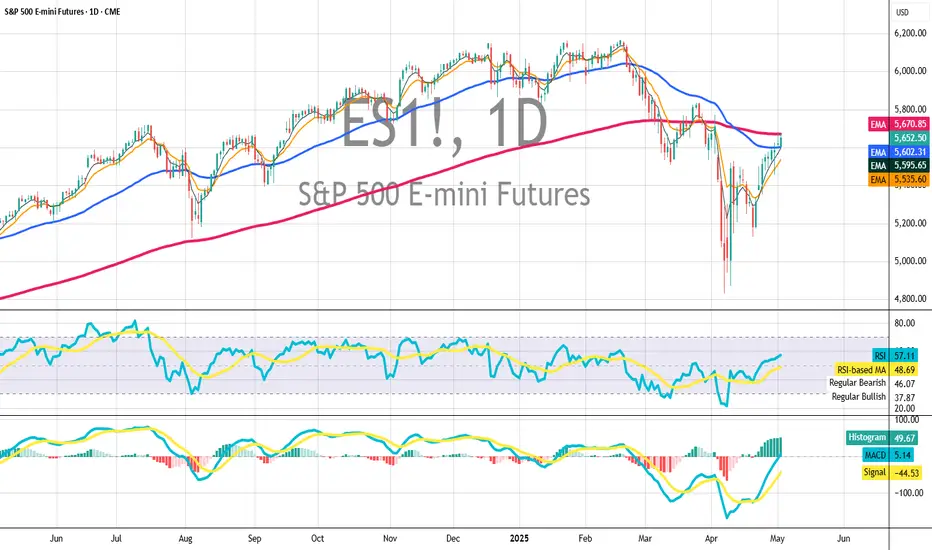
ES DAILY CHARTBig Resistance up here, but if we can close above EMA200, I think we can resume higher and maybe to a new all time high...let'see
WSP1! trade ideas
May 1st Trade Journal & Stock Market Analysis**May 1st Trade Journal & Stock Market Analysis**
EOD accountability report: +441
Sleep: 7 hour, Overall health: :thumbsup:
Signals were pretty solid today, but there's heavy MM manipulation in the market so be careful trading funded accounts.
Walk away if you get tilted.
**Daily Trade recap based on VX Algo System**
9:51 AM Market Structure flipped bullish on VX Algo X3!
10:30 AM Market Structure flipped bullish on VX Algo X3!
11:31 AM VXAlgo YM X1 Sell Signal
12:08 PM Market Structure flipped bearish on VX Algo X3!
1:47 PM Market Structure flipped bullish on VX Algo X3!
Next day plan--> Over 5600 = Bullish, Under 5600 = Bearish
Video Recaps -->https://www.tradingview.com/u/WallSt007/#published-charts


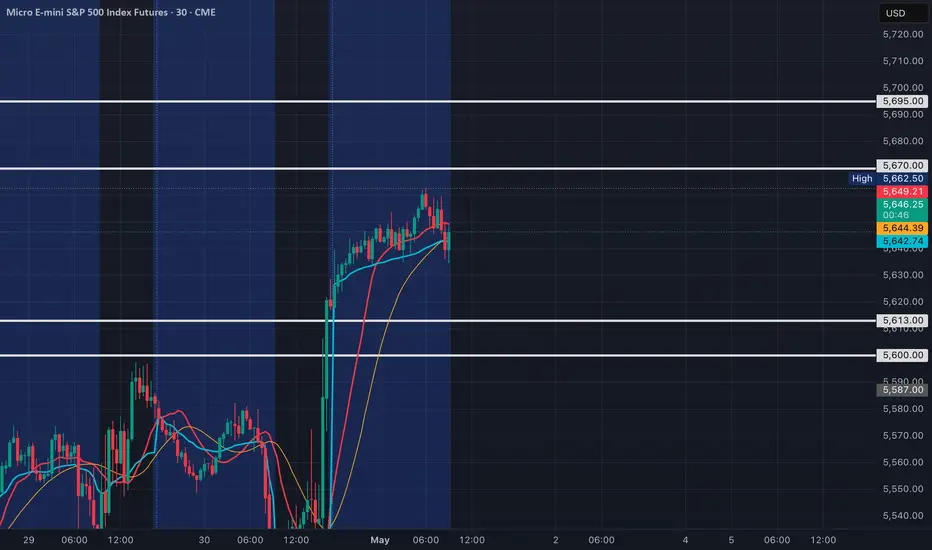
MES1!/ES1! Day Trade Plan for 05/01/2025MES1!/ES1! Day Trade Plan for 05/01/2025
📈 5670 5695
📉 5613 5600
Thanks to all my followers! Truly appreciate the support!
Please like and share for more ES/NQ levels Tues & Thurs 🤓📈📉🎯💰
*These levels are derived from comprehensive backtesting and research and a quantitative system demonstrating high accuracy. This statistical foundation suggests that price movements are likely to exceed initial estimates.*
MES!/ES1! Day Trade Plan for 04/29/2025MES!/ES1! Day Trade Plan for 04/29/2025
📈 5555 5580
📉 5500 5475
Thanks to all my followers! Truly appreciate the support!
Please like and share for more ES/NQ levels Tues & Thurs 🤓📈📉🎯💰
*These levels are derived from comprehensive backtesting and research and a quantitative system demonstrating high accuracy. This statistical foundation suggests that price movements are likely to exceed initial estimates.*

$IZM = China Semiconductor Name. $NVDA $AMD $SMCI $SMH $SOXLNASDAQ:IZM = China Semiconductor Name.
This Thing Can Move Like It Did 1 Year Ago.
With All of The Trouble NASDAQ:NVDA NASDAQ:AMD NASDAQ:SMCI NASDAQ:SMH Are Dealing with Tariffs.
This Is A Work Around.
ICZOOM Group, Inc. is an offshore holding company, which engages in conducting operations in China through its subsidiaries and engages in the sales of electronic component. It mainly does business through e-commerce trading platforms and sells two categories of electronic component products-semiconductor products and electronic equipment, tools and other products. The company semiconductor products primarily include various integrated circuit, discrete, passive components, optoelectronics, and equipment, tools and other electronic component products primarily include various electromechanical, maintenance, repair & operations (“MRO”), and various design tool. Its products are widely used by SMEs in the consumer electronic industry, Internet of Things (“IoT”), automotive electronics and industry control segment. The company also provides services to customers such as temporary warehousing, logistic and shipping, and customs clearance. The company was founded by Lei Xia and Duan Rong Liu on June 23, 2015 and is headquartered in Shenzhen, China.

How to Place Different Types of Futures Orders on TradingViewThis tutorial video walks you through how to place basic futures orders on tradingview including market, limit, and stop orders.
We also discuss bracket orders, modifying orders, and cancelling orders, as well time of order effect.
There is a substantial risk of loss in futures trading. Past performance is not indicative of future results. Please trade only with risk capital.

Retest the 5584.50 coming next in the coming days.Retest 5584.50 coming next in the coming days. Went up too far to fast. EZ money.

Why I Hesitate on Long Wick Candles (and How I Trade Through It)In today’s live trading review, I highlight one of the key challenges I face when trading the ES:
I don’t always feel confident executing during long wick days.
So how do I deal with that? Simple: reduce risk and stick to the framework.
Watch as I walk you through this session, break down the setup, and share how you can identify and study your own trading weaknesses — so you can grow stronger, one trade at a time.
#OneCandlestickAtATime #LiveTrading #ESFutures #TradingPsychology


A buying boost?In the S&P 500 daily chart the structure implies buying has returned to this market in Asia is a bit stronger. So, is this price action that were seen a buying boost? If it is, the expectation is a positive close above 5670.

AMP Futures - % (LTP) Calculation for Renko, Kagi, and PnF chartIn this idea we will demonstrate how to apply LTP calculation for Renko, Kagi, and Point & Figure chart types.

April 30 Trade Journal & Stock Market Analysis
EOD accountability report: -1310 on a Eval. + 125 on Funded
Sleep: 8 hour, Overall health: :thumbsup:
I used a trailing stoploss ATM order by mistake, and got rid of the stoploss, because market zig zagging it up. BAD BAD Idea
Market humbled me by showing me why i should always have stoploss on.
Back to doing manual stoploss and getting rid of trailing stops because they are horrible during chops
**Daily Trade recap based on VX Algo System**
10:48 AM VXAlgo NQ X3 Buy Signal
11:00 AM Market Structure flipped bullish on VX Algo X3!
— 12:10 PM VXAlgo NQ X1 Sell Signal,
— 2:29 PM VXAlgo ES X1 Sell Signal, (triple sell)
3:30 PM Market Structure flipped bearish on VX Algo X3 (False signal, got cancelled right away)
Next day plan-->
Video Recap -->https://www.tradingview.com/u/WallSt007/#published-charts

MAY 1ST - BULLISH IDEA - MES - SP500The market seems to fill the 4 hours gap, and took al liquidity acumulated, now it's has all the path free to visit the daily bearish order block.

S&P 500 - Low Resistance Liquidity Run To $5,600?Over 10 days has been spent trading inside of Wednesday 9th April 2025 daily candle with Friday 25th being the day that we witnessed expansion through buyside liquidity.
I would like to see a continuation further inside of the weekly SIBI of $5,649.75 - $5,532 C.E.
Low hanging fruits going into next week guys!

ES Premarket UpdateBad numbers across the board, ES got the gap fill yesterday, now MFI is overbought. Expect it to go down until RSI hits oversold, maybe (maybe) bounce, then go for the gap fill below.

Tariffs, and Tumult: Wall Street Waits on Super WednesdayHello everyone, it’s April 30, 2025. The TVC:DJI just closed its sixth consecutive green session, with markets clinging to hope as rumors swirl of a first tariff deal—possibly with India—though nothing is confirmed. That tiny breadcrumb of optimism was enough to boost sentiment late in yesterday’s session, even if volatility is dipping below 25% and investor enthusiasm seems to be fading in lockstep.
U.S. macro data continues to paint a picture of “not great, but not terrible.” Consumer confidence and job openings (JOLTS) came in below expectations but not disastrously so, prompting markets to collectively shrug and declare everything “less worse than feared.” It’s a strategy now: ignore bad data as long as it isn’t apocalyptic.
As earnings roll in, companies are split between those who pretend the tariff storm is “manageable” (hello, NASDAQ:COKE ) and those flying blind through economic fog ( NYSE:UPS , Snap, and Super Micro—who might be losing a major client named Nvidia). The overall takeaway? Visibility is garbage, and most companies are bracing rather than building.
All eyes are now on today’s so-called Super Wednesday, packed with economic data (U.S. GDP, PCE, ADP jobs, Chicago PMI) and mega-earnings from NASDAQ:MSFT and NASDAQ:META . But as usual, expectations may outpace reality. Markets often dream of clarity and wake up to more noise.
Meanwhile, China flashed its first big red light: a manufacturing PMI of 49, signaling contraction—the lowest in two years. No shock, considering their ongoing trade war with the U.S., which seems to be giving the global economy the flu.
On the political front, Trump celebrated his 100 days in office with a campaign-style detour to Detroit, throwing shade at Fed Chair Jerome Powell while declaring the economy in perfect health (despite the worst market performance since Nixon’s early days). He promised tax cuts, again, while doubling down on trade threats. Powell, of course, is just trying to survive the week.
Oil briefly dipped under $60 as markets considered the broader implications of economic warfare, gold sits at $3,311, and Bitcoin hovers around $95,000—looking resilient despite the madness.
As for corporate earnings, Starbucks missed on sales due to weak U.S. demand, Pfizer beat on EPS but saw revenue fall, and Visa continues to rake in profits as Americans keep spending like inflation isn’t real. Novartis crushed it but got no love from the market because apparently, +22% net income just isn’t sexy enough.
In short: chaos remains king. Markets seem oddly calm on the surface, but under the hood, it’s still all about tariffs, Trump tweets, and the fantasy that maybe—just maybe—some clarity will come today. Don’t hold your breath.
Enjoy the ride, and see you tomorrow for more market mayhem.


Equity market, another monthly technical close! Debriefing.1) Lessons from the monthly technical close for the medium/long term
It's Wednesday April 30, the end of the stock market month with another monthly technical close this evening. April has been a highly volatile month, with a bearish shock at the start of the month on the back of the trade war, followed by a bullish recovery when the time for trade diplomacy between the United States and its main trading partners arrived.
In technical analysis, it's the monthly timeframe that enables us to project the underlying trend, i.e. the market's medium/long-term trend.
We will therefore be taking a decision on the monthly chart, which will be fixed for good at the close of the trading session on Wednesday April 30. Two markets will be studied: the S&P 500 index and APPLE, the world's largest market capitalization.
2) Equity markets: the (long-term) supports of the monthly time horizon are preserved
The S&P500 fell by 21% between its all-time high in February and the low point of the bearish shock at the beginning of April. We now have the technical close for the month of April, represented on the chart below by Japanese candlesticks in monthly data, complemented by the RSI and LMACD technical indicators.
In terms of price action, the essentials have been preserved: the uptrend line which joins all lows since the health crisis has been defended, and still acts as support for the market's underlying uptrend.
In terms of the ichimoku system, the Kijun-sen has also been preserved, as has the former record of 2021, the horizontal support at 4808 points. As long as the S&P 500 remains above the combination of these three supports, the long-term momentum remains bullish.
On the other hand, there are warnings of trend exhaustion in terms of market momentum, represented below by the RSI and LMACD technical indicators. Volatility should therefore remain at a relatively high level, even if the VIX peak is probably behind us.
3) APPLE, the technical message from the stock with the world's largest market capitalization
Technical analysis applied to stock market indices is the first job to be done in order to form an opinion on the underlying trend. But let's not forget that a stock market index only exists because there are stocks in it. The S&P 500 is considered the benchmark index for US finance, and in its calculation, the weight of shares from the “magnificent 7” is dominant. This is particularly true of Apple shares, the world's largest market capitalization on the international equity market. Its market capitalization exceeds 3,000 billion US dollars, second only to that of gold at 22,000 billion US dollars.
It is therefore interesting to note that APPLE's new monthly technical close highlights the preservation of a long-term chartist bullish channel.
DISCLAIMER:
This content is intended for individuals who are familiar with financial markets and instruments and is for information purposes only. The presented idea (including market commentary, market data and observations) is not a work product of any research department of Swissquote or its affiliates. This material is intended to highlight market action and does not constitute investment, legal or tax advice. If you are a retail investor or lack experience in trading complex financial products, it is advisable to seek professional advice from licensed advisor before making any financial decisions.
This content is not intended to manipulate the market or encourage any specific financial behavior.
Swissquote makes no representation or warranty as to the quality, completeness, accuracy, comprehensiveness or non-infringement of such content. The views expressed are those of the consultant and are provided for educational purposes only. Any information provided relating to a product or market should not be construed as recommending an investment strategy or transaction. Past performance is not a guarantee of future results.
Swissquote and its employees and representatives shall in no event be held liable for any damages or losses arising directly or indirectly from decisions made on the basis of this content.
The use of any third-party brands or trademarks is for information only and does not imply endorsement by Swissquote, or that the trademark owner has authorised Swissquote to promote its products or services.
Swissquote is the marketing brand for the activities of Swissquote Bank Ltd (Switzerland) regulated by FINMA, Swissquote Capital Markets Limited regulated by CySEC (Cyprus), Swissquote Bank Europe SA (Luxembourg) regulated by the CSSF, Swissquote Ltd (UK) regulated by the FCA, Swissquote Financial Services (Malta) Ltd regulated by the Malta Financial Services Authority, Swissquote MEA Ltd. (UAE) regulated by the Dubai Financial Services Authority, Swissquote Pte Ltd (Singapore) regulated by the Monetary Authority of Singapore, Swissquote Asia Limited (Hong Kong) licensed by the Hong Kong Securities and Futures Commission (SFC) and Swissquote South Africa (Pty) Ltd supervised by the FSCA.
Products and services of Swissquote are only intended for those permitted to receive them under local law.
All investments carry a degree of risk. The risk of loss in trading or holding financial instruments can be substantial. The value of financial instruments, including but not limited to stocks, bonds, cryptocurrencies, and other assets, can fluctuate both upwards and downwards. There is a significant risk of financial loss when buying, selling, holding, staking, or investing in these instruments. SQBE makes no recommendations regarding any specific investment, transaction, or the use of any particular investment strategy.
CFDs are complex instruments and come with a high risk of losing money rapidly due to leverage. The vast majority of retail client accounts suffer capital losses when trading in CFDs. You should consider whether you understand how CFDs work and whether you can afford to take the high risk of losing your money.
Digital Assets are unregulated in most countries and consumer protection rules may not apply. As highly volatile speculative investments, Digital Assets are not suitable for investors without a high-risk tolerance. Make sure you understand each Digital Asset before you trade.
Cryptocurrencies are not considered legal tender in some jurisdictions and are subject to regulatory uncertainties.
The use of Internet-based systems can involve high risks, including, but not limited to, fraud, cyber-attacks, network and communication failures, as well as identity theft and phishing attacks related to crypto-assets.

ES UpdateIndicators aren't showing much but gap did fill.
My SPY chart is wrong because the gap happened during the one hour break, and futures dropped before the break.

Earnings this week pushes Spy upSpy will see more upside this week with Meta earnings tomorrow after market close. Google was already a good tone setter of this week.

Are We Close Making Third Lower High ?Staying long XLF SPY UVXY Short MAGS IWM
Have my hedges on be ready a drop can happen anytime 565 target can we get their
Will know by Friday Big Earnings This Week.
