New World Order?Blue line would thrust us into a new paradigm as we are supposed to be in a ''bull cycle'' part of the big cycle established since 1945. According to my analysis, we shouldn't break 4300 for this recurring 5 years bull and 2 years bear cycles that have been happening for decades.
So red line is the most expected outcome if things are to keep happening as usual.
Either way, the FED put will save us all, so bid 4.5k or 2.7k you'll be fine in a 20-year time horizon.
WSP1! trade ideas

S&P 500 Futures Plunge: Bearish Dominance Unabated in MarketBearish/Bullish Trend Analysis
Trend Condition:
Bullish Trend Condition: 0
Bearish Trend Condition: 14
Analysis: The market remains strongly bearish as indicated by all 14 trend lines being red. There are no bullish trends present, suggesting persistent downward pressure.
Price Action and Momentum Zones
Closing Price and Change:
The S&P 500 E-mini Futures closed at 4,902.50, down by 194.25 points (-3.81%).
Daily Market Behavior:
Today's sharp decline is consistent with the ongoing bearish trend, with no signs of a reversal or slowdown in the selling momentum.
Momentum Zones:
The market is trending downwards sharply, breaking past previous support levels, which may now act as resistance on any potential rebounds.
Fibonacci Retracement Levels
Current Position Relative to Levels:
The index has fallen below the 50.00% Fibonacci retracement level and is approaching the 61.8% level.
Key Fibonacci Levels:
23.6% → 5,584.26
38.2% → 5,385.65
50.0% → 5,144.15
61.8% → 4,903.11
Interpretation:
The significant drop below the 50% level shows a robust continuation of the bearish trend, with the 61.80% level being the next critical marker to watch for potential support or further decline.
Overall Market Interpretation
The market's continued movement in a downward trajectory with all indicators pointing to a sustained bearish outlook suggests that investors remain cautious and are likely divesting, leading to the observed price declines.
Summary
Today’s significant downturn in the S&P 500 E-mini Futures highlights the ongoing bearish dominance in the market. With the index quickly approaching the 61.80% Fibonacci retracement level, it's crucial to watch for either a stabilization and potential buying opportunity or further declines if this level fails to hold. The lack of any bullish signals currently suggests that caution is warranted, and traders should prepare for possibly extended bearish conditions.

S&P - Will we follow 2020/2021?The S&P has been trading in a rising pattern for over 700 days, similar to the rising pattern observed in 2020 and 2021. In that instance, the price of the S&P broke below the support trendline and lost all SMA support, while also making a lower low. This has not occurred since the start of the current pattern. Could a deeper correction follow?
Blue line = 50-day MA
Red line = 100-day MA
Yellow line = 200-day MA
Analysis of the 2020/2021 Price Action
We can conclude the following five points:
1. The rising wedge lasted for nearly 700 days.
2. The price consistently made higher highs and higher lows.
3. The S&P found support on the SMAs and never broke below the 200-day MA.
4. After approximately 700 days, the S&P broke below the rising wedge, lost all key SMA support, and made a lower low.
5. During the retest of the rising wedge and key SMAs (which had turned into resistance), a bearish cross (50-day SMA below the 100-day SMA) occurred, leading to a downtrend.
How Does the 2020/2021 Price Action Correlate to 2023/2024?
We can conclude the following five points:
1. The rising wedge lasted for approximately 750 days.
2. The price continued making higher highs and higher lows.
3. The S&P found support on the SMAs and never broke below the 200-day SMA.
4. After around 750 days, the S&P broke below the rising wedge, lost all key SMA support, and made a lower low.
5. A bearish cross between the 50-day SMA and the 100-day SMA is currently forming.
When we overlay the bar pattern of the 2021 bearish price action onto the current chart, it suggests that a revisit to 4,750 is possible. This level is both a technical support and the point where the S&P started its downtrend in 2021.
Conclusion
Will the S&P follow the 2021 price action, resulting in a sustained downtrend, or will it reclaim all lost SMA levels and continue its uptrend? The price action suggests that there is a real possibility of weakness in the coming months.

Class A/B RSI Bearish Divergence on SPY Futures?Really posting here to see if anyone would validate this for me but I was looking on the chart and this idea came about. On the weekly chart for ES1!, there seems to be class A or B Bearish Divergence developing on the Weekly timeframe.
Listen, of course we all know SPY trends upwards over time but is this an indicator of a larger sell the market needs to go higher every once in a blue moon? This is guarenteed a macro trend and I probably will have to wait a year for this analysis to play out but hey, at least we're here. (***ponders on how I charted Gamestop at $10 but never traded because of lack of knowledge***) Anyways, this is something I will of course monitor but let me highlight instances in history this has happened. Please feel free to give your input on this analysis!
Jan 1998 thru Apr 2001 (News Driver: Dot-Com Bubble)
Price makes higher highs from Jan 98' thru Mar 00'
From Mar 98' thru Mar 00', the 3 peaks formed on the RSI leading to price establishing a lower high (SMT) on Sep 00'. Fails to make new all-time high
From Sep 00' to Apr 01' price moves down as much as 30% over the next 224d
Jan 2013 thru Feb 2016
Price makes higher highs from Jan 13' thru May 15'
From May 13' thru Jun 14', the 3 peaks formed on the RSI leading to price establishing a lower high (SMT) Jul 15' and a following lower high on Nov 15'
From Jul 15' to Aug 15' (42d) (News Driver: Lagging China Market) price moves down as much as 14% and as much as 14% on the Nov '15 lower high to Jan 16' (78d) (News Driver: Oil Prices)
Current: Jan 24' thru Nov 24'
Price has been making higher highs all year
From Mar 24' thru , the RSI has been making lower highs while price is making higher highs
We are now at a point where price is pushing to go higher but what I would want to see based off of historical data is for price to consolidate or some type of Bearish Turtle Soup forming. If this happens and the RSI returns to Fair Value, we could be in for a sizeable sell of for at least a couple of weeks in the near future.
I will come back to this in the next few months. Happy Trading!

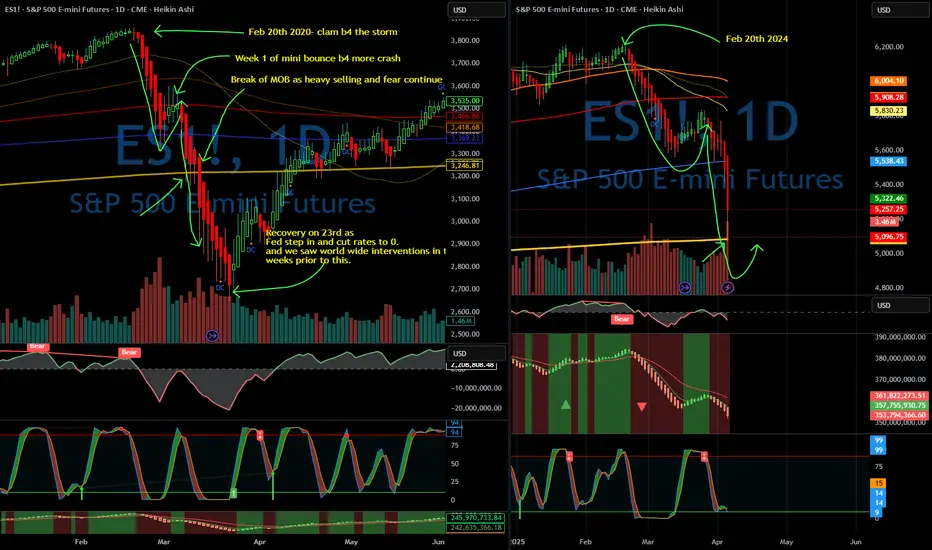
Are We Witnessing a Black Swan Event?I’ve spent most of the day digging through charts and studying past crashes — because what we’re living through right now might be a once-in-a-decade opportunity.
This current market crash feels eerily close to a black swan event.
No one really expected Trump to push tariffs this far, and the consequences are already rippling through global markets. If this escalates into true economic isolation, the effects could be both tremendous and long-lasting.
That said, there’s another possibility:
This might just be a blip in history — a bold negotiating tactic that works out, shocks the system temporarily, and fades away.
There’s even speculation this could mirror the 1989 crash, with some analysts warning of a potential 20% drop by Monday.
If that happens, I’d rather not be frozen by fear. I want to act with intention. I want my plan in place and my orders ready.
Before I share stock ideas I believe can outperform in the long run…
Let’s first walk through what I believe might be playing out — at least for now. (Keep in mind, these theses can change fast.)
Before the crash, it looked like a replay of 2022:
Markets were clearly overvalued and due for a correction — back then, it was driven by regional bank failures, and the Fed quickly stepped in to stabilize things.
But now, selling pressure is accelerating.
This looks less like 2022 and more like 2020 — where markets broke down in response to a larger, fast-moving, global crisis.
Even though we’re seeing similarities, things can shift very quickly.
We still haven’t seen key reversal signs — like a Doji candle — and more importantly, there’s been no intervention yet from the government or global forces.
Until that happens, panic may continue to snowball.
And as we know from history, panic doesn’t operate on logic.
Source:
📚 2020 Stock Market Crash en.wikipedia.org
Favoring a bounce Monday off this Weekly SupportFavoring a bounce Monday followed by a steady selloff. If we break 5000, we should see another leg down to 4700.

Combined US Indexes - Lower High Lower Low checked; What next...As previously expected, a lower low has been achieved.
What was not expected was the speed, magnitude and extent of the fallout.
Next up, since it is about 3.5 Standard Deviations out, we can start looking for a consolidation, although there might be slightly more downside and we need a higher low in the expected range within box. Having said that, it is possible to see it overextend downwards briefly.
There is a long term support, Fibonacci downside target zone just below.
So expecting a short term bounce between Monday to Wednesday at the earliest, and following that a consolidation area formation.

US500 to 4346!!!!!!! WARNINGGG!!!!!!Based on my algos, US500 is heading to 4346! Be warned!!! Collapse is actually coming!

S&P moving lower for me We on our way towards 5300/5400 area on this move. The top maybe in for now be vigilant

ES and the Trade War, We are still short here.Current Market Context:
Downtrend Continuation: The ongoing trade tensions between the U.S. and China have led to significant sell-offs, pushing the ES further down. The recent sharp decline in major indices, including the S&P 500, highlights the market's instability and investor anxiety.
Bearish Sentiment: The market's bearish sentiment is evident, with the Nasdaq entering a bear market and the S&P 500 experiencing its largest weekly decline since 2020.
Criteria for Reversal:
Trend Line Break: A break above the current downtrend line on a higher time frame, such as the 15-minute chart, would be a strong indicator of a potential reversal.
Mitigation of Bearish Fair Value Gap: Observing a mitigation of the bearish fair value gap would suggest that sellers are losing control, paving the way for buyers to step in.
Formation of Bullish Fair Value Gap: The emergence of a bullish fair value gap would indicate a shift in market sentiment, signaling the potential for an uptrend.
Projections for ES Price:
Short-Term Outlook: If the above criteria are met, we could see a reversal in the ES price, with potential targets at key resistance levels. Look for a break above the recent highs on the 15-minute chart to confirm the uptrend.
Medium-Term Outlook: Should the reversal gain momentum, the ES could aim for higher resistance levels, potentially retracing some of the recent losses. Key levels to watch include previous support turned resistance zones.
Long-Term Outlook: In the event of sustained bullish momentum, driven by positive economic indicators or easing trade tensions, the ES could recover further, targeting higher time frame resistance levels.
Strategic Considerations:
Cautious Approach: Given the current volatility, it's crucial to remain cautious and wait for clear confirmation of a trend reversal before entering long positions.
Sector Opportunities: Consider focusing on sectors like utilities, consumer staples, and healthcare, which may offer more stability during this downturn.

ES is waiting for a consolidation.Suppressed by the downward trend line, it has declined. There is still a certain distance to the lower support level. We are waiting for a consolidation range.
It is still a bull market.

ES 3hr Update1) I told everyone not to go long until congress decides to rescind all of the tariffs
2) I said the futures gap might not fill for an extended period of time, but all gaps will fill. This one will not happen until the tariffs are rescinded by congress or the next president, lol.
3) I said like COVID, this drop will probably break a lot of rules. So far it's broken the gap rule, 3hr indicator, double index gap (SPX daily index doesn't usually throw gaps 2 days in a row, and if it does it fills them them within days).
4) I assume it will break daily and weekly indicators as well, so I'm not even gonna post plots.
5) The algos are on, but broken. You can see that the market zig zagged multiple times today as the algos tried to pump the market, but there were way too many retail investors that sold. EOD (end of day) selling indicates people going cash in their 401k. Extremely rare for the market to drop EOD on Fridays like that. Usually there's at least some bounce.
Anyways, you can see 3hr indicators flatlined at the bottom, the same can happen with daily and weekly indicators. We were close to circuit breaker level today. We may hit it next week if congress doesn't do something. That's the unknown factor that kept me from shorting the market over the weekend. If not, we may see yet another futures gap Sunday night and the circuit breaker. Remember we hit it multiple times during COVID bottom.

How do you plan?The challenge in the current S&P 500 futures market is how do you plan in this current post global tariff environment? It is this uncertainty that continues to destabilize the stock market. The smoke is in the air and until this clears sellers are in control.

ES Monthly chart for some of you youngstersIf you think the market can't go any lower, you're mistaken. It's been a while since it's happened (housing bubble crash), but monthly indicators can go oversold. We're not there yet.
If congress doesn't step in and rescind the tariffs, the stock market will get cut in half like it did back then. It's gonna be nearly impossible for corporations to match even preCOVID level profits with such huge tariffs.
I do not recommend going long on anything until congress steps in. That may happen as early as this weekend, or they can wait until the market tanks 50%, lol..... who knows.

A multi-year Head & Shoulders in the S&P 500?Just showing a potential multi-year Head & Shoulders pattern forming in the S&P 500 (the chart is SP500 Futures).
The neck line is a horizonal support line around 3,600, converging with a multi-year diagonal support line.

SPX scenarios in weekly chartHello
These 2 scenarios for S&P is more probable ones and as you elliotticians know there is a doubt in wave (4). In scenario 1 wave (4) is acceptable due to Alternation and in scenario 2 it made a Running Flat. In both scenarios there is one strategy for today market which is another correction starting from here.
In smaller time frames you need to find a bearish impulse wave to get in this correction.

S&P 500 - Elliott Wave Bearish BreakdownThis S&P 500 E-mini Futures (ES) daily chart highlights a potential bearish Elliott Wave structure following rejection from a key resistance zone.
- The market encountered strong resistance near the 5,600 level, leading to a sharp decline.
- A five-wave impulsive bearish structure appears to be forming, with Waves (1) and (2) already completed.
- If this pattern continues, Waves (3), (4), and (5) could drive prices lower, targeting key support levels in the coming weeks.
Traders should watch for confirmation of Wave (3) acceleration, as it is typically the strongest wave in an impulse. A break below recent lows could confirm further downside, while a strong bounce from lower levels may indicate a correction or trend reversal.
Risk management remains crucial, as volatility can increase during corrective and impulsive waves. Keep an eye on macroeconomic factors and technical confluences for additional confirmation.

Combined US Indexes - Lower High checked; Lower Low next...As expected from previous analysis, there is a lower high likely as the TD Sell Setup is Perfected. This just missed the target but has the TD Bear Trend intact
Following, a Bearish Engulfing pattern plus a Gap Down occurred yesterday.
Breaking back into Extension Zone box... and likely to protrude out the other side.
MACD is turning down in the bearish zone too.
So, looking for a lower low now...

AMP Futures - Table drawing toolIn this idea we will demonstrate how to use the NEW Table drawing tool.

New news is neededNew news is needed for the S&P 500 daily chart to have a dramatic move down on Friday like was witnessed on Thursday. Without new news to create that volatility, a dramatic move lower is not expected for Friday.

April 3rd Daily Trade Recap EOD accountability report: +$161.25
Sleep: 6 hour, Overall health: not good at all.
**Daily Trade Recap based on VX Algo System **
9:42 AM Market Structure flipped bullish on VX Algo X3!
10:30 AM Market Structure flipped bearish on VX Algo X3!
11:11 AM VXAlgo ES 10M Buy signal (double signal)
12:04 pm Market Structure flipped bullish on VX Algo X3!
1:31pm Market Structure flipped bearish on VX Algo X3!
1:40 PMVXAlgo NQ 10M Buy Signal double signal
Another wild day, market went extremely bearish and has been rejecting the 5 min resistance and playing out as expected.

ID: 2025 - 0073.18.2025
Trade #7 of 2025 executed. So simple, yet far from easy...
Trade entry at 30 DTE (days to expiration).
This trade has a little more hot sauce and fire built into it.
Unbalanced butterfly, close to expiration, will adjust the wing widths as the market adjusts either up or down. Goal is to be out of this trade in under two weeks before GAMMA really begins kicking in.
The reason I like going in closer to expiration after big market moves, is the volatility is better, and fills are quicker, and spreads are tighter. The downside of playing super long DTE strategies is that when the market gets spooked or turbulent, the bid/ask spreads become a mile wide.
Happy Trading!
-kevin

be careful from this market makers playIts a very straight forward approach.
make it look like we have a double bottom and rugpull:
fomo pump to vwap
clean the funky high
then nuke toplongers on trump news
I hope this wont get many views, i know you're watching market maker.
dont worry im not going viral so you keep doing you.
green rectangle is a gap thats why its my target.
i wont short this without oscilators data
