Understanding MACD In TradingThe Moving Average Convergence Divergence (MACD) is a trend-following momentum indicator that measures the relationship between two moving averages of an asset’s price. Developed by Gerald Appel in the late 1970s, MACD is designed to provide insights into both trend strength and momentum.
Unlike simple moving averages, which merely smooth price data over a specific period, MACD goes a step further by identifying when short-term momentum is shifting in relation to the long-term trend. This makes it a valuable tool for traders looking to enter or exit positions at optimal points.
1. Why is MACD important in trading?
Trend Confirmation: Identifies whether an asset is in an uptrend or downtrend.
Momentum Strength: Measures how strong a price movement is.
Reversal Signals: Detects potential changes in trend direction.
Entry and Exit Points: Helps traders determine when to buy and sell.
2. MACD Components
The MACD Line: Identifies whether an asset is in an uptrend or downtrend.
This line is derived by subtracting the 26-period Exponential Moving Average (EMA) from the 12-period EMA.
When the MACD Line is positive, it indicates bullish momentum; when negative, it suggests bearish momentum.
The Signal Line: Measures how strong a price movement is.
A 9-period EMA of the MACD Line.
It smooths out MACD fluctuations, making it easier to identify crossovers.
The Histogram: Detects potential changes in trend direction.
The difference between the MACD Line and the Signal Line.
A positive histogram suggests increasing bullish momentum, while a negative histogram suggests growing bearish momentum.
3. MACD Formula
The Moving Average Convergence Divergence (MACD) is one of the most widely used technical indicators in trading. It helps traders identify trends, momentum shifts, and potential buy or sell opportunities by analyzing the relationship between two moving averages.
By calculating the difference between a short-term and long-term exponential moving average (EMA), MACD provides insight into market direction and strength.
//@version=6
indicator("MACD Indicator", overlay=false)
// MACD parameters
shortLength = 12
longLength = 26
signalLength = 9
// Calculate MACD
macdLine = ta.ema(close, shortLength) - ta.ema(close, longLength)
signalLine = ta.ema(macdLine, signalLength)
histogram = macdLine - signalLine
// Plot MACD components
plot(macdLine, color=color.blue, title="MACD Line")
plot(signalLine, color=color.red, title="Signal Line")
plot(histogram, color=color.green, style=plot.style_columns, title="Histogram")
Explanation:
Short EMA (12-period) and Long EMA (26-period) are calculated.
The MACD Line is the difference between these EMAs.
A Signal Line (9-period EMA of MACD Line) is calculated.
The Histogram represents the difference between the MACD Line and the Signal Line.
4. Interpreting MACD signals
MACD Crossovers
A crossover occurs when the MACD Line and Signal Line intersect:
Bullish Crossover: When the MACD Line crosses above the Signal Line, it signals a potential uptrend and a buying opportunity.
Bearish Crossover: When the MACD Line crosses below the Signal Line, it suggests a potential downtrend and a selling opportunity.
MACD Divergences
Divergences occur when MACD moves in the opposite direction of the price, signaling a potential reversal:
Bullish Divergence: If price makes lower lows, but MACD makes higher lows, it suggests weakening downward momentum and a possible bullish reversal.
Bearish Divergence: If price makes higher highs, but MACD makes lower highs, it signals weakening upward momentum and a potential bearish reversal.
Histogram Interpretation
The MACD histogram visually represents momentum shifts:
When bars are increasing in height, momentum is strengthening.
When bars shrink, it suggests momentum is weakening.
Zero Line Crossings
The MACD crossing the zero line indicates momentum shifts:
MACD crossing above zero → Bullish trend initiation.
MACD crossing below zero → Bearish trend initiation.
5. Trend & Momentum Analysis
Traders use MACD to confirm trends and analyze market momentum:
If MACD Line is above the Signal Line, an uptrend is in place.
If MACD Line is below the Signal Line, a downtrend is dominant.
A widening histogram confirms strong momentum in the trend’s direction.
A narrowing histogram warns of potential trend weakening.
MACD works best in trending markets and should be used cautiously in sideways markets.
6. MACD Based Trading Strategies
Entry Strategies
Buy when MACD Line crosses above the Signal Line in an uptrend.
Sell when MACD Line crosses below the Signal Line in a downtrend.
Exit Strategies
Exit long trades when a bearish crossover occurs.
Close short positions when a bullish crossover occurs.
Position Management
If the histogram is expanding, traders can hold positions.
If the histogram is contracting, it may signal weakening momentum.
7. Limitations of MACD
While MACD is a powerful tool, traders must consider:
It lags behind price movements (since it is based on moving averages).
It can generate false signals in choppy markets.
Customization is required to suit different trading styles.
8. Optimization
Optimizing MACD for Different Market Conditions
Day Traders & Scalpers: Use faster settings like (5, 13, 6) for quick signals.
Swing Traders: Stick with the default (12, 26, 9) setting for balanced signals.
Long-Term Investors: Use slower settings like (24, 52, 18) for a broader market perspective.
9. Key Takeaways
MACD is a momentum and trend-following indicator that helps traders identify market direction, strength, and potential reversals.
Since MACD is a lagging indicator, it may generate false signals, especially in sideways markets.
Combining MACD with RSI, moving averages, and volume indicators improves accuracy and reduces risk.
MACD should be used alongside risk management strategies and other confirmation tools for best results.
MACD remains one of the most effective technical indicators, widely used across different markets. It helps traders identify trends, confirm momentum, and optimize trade entries and exits. However, it should always be used with additional tools to minimize false signals.
Stay sharp, stay ahead, and let’s make those moves. Until next time, happy trading!
WSP1! trade ideas

Daily Trade Recap based on VX Algo System EOD accountability report: +$2,337.50
Sleep: 5 hour, Overall health: not gud
**
Daily Trade Recap based on VX Algo System **
9:36 AM VXAlgo NQ 48M Buy Signal,
9:44 AM Market Structure flipped bullish on VX Algo X3!
11:13 AM VXAlgo ES 10M Sell Signal (lost $525 on this play)
1:21 PM VXAlgo ES 10M Sell Signal
2:05 PM VXAlgo NQ 48M Sell Signal
2:40 PM VXAlgo ES 10M Buy signal (triple signal)
Overall a pretty wild day, I'm extremely glad that we have a system that works and reads the MM very well.
The only thing we need to do is be extremely disciplined and pull the trigger without hesitation.

Liberation or Liquidation Day? I am long on the 618Was this a liquidity grab today?
I am long here willing to risk 100k I will alert yall step by step just drop a like!

ES Open Gap AlerrtKinda expected that there will be an open gap after the break. Algos are trying desperately to bring futures back up, and much like I told you the other day, they're selling gold futures to do it. So much gold future that it's not tracking spot price, lol. I don't think I've ever seen that aside from when oil futures went negative during COVID.
Probably gonna just stick with gold, RSI is not oversold yet, so it may drop further before rebounding to fill teh gap.

A response created by uncertaintyThe uncertain economic reality of the fundamental tariffs announced today is reflected in the S&P 500 daily chart. The market's response to this uncertainty on Thursday will provide some insights into longer-term reaction.


Up and Away with a Cup and HandleThis pattern forecasts 5750 for the Jun e-mini's. We might even hit that today! Considering how ugly the opening call was, this day has been a miracle. You might recall I forecasted this 2 days ago, but even a blind pig can roll across an acorn every once in a while.

Q1 Recap and What’s AheadThe first quarter of 2025 saw significant price movements in many different asset classes. Traders saw equity indices broadly selling off with the ES contract falling near 10% from the highs while Gold continued to push higher to all time high levels. There are many factors contributing to the price movement, including a shift in the administration in the U.S., geopolitical tensions globally, and critical tariff announcements looming. There are also questions about the Fed environment and the strategy that will be implemented this year to begin cutting interest rates. Looking at the CME Fed Watch Tool today, it seems the market is pricing another rate pause for the May meeting and a near 60% chance of rate cuts coming in June.
There is a large slate of economic date coming out for the rest of the week that could add great volatility to this uncertain market, including:
Tariff Announcement
Initial Jobless Claims
Nonfarm Payroll
Unemployment Rate
Average Hourly Earnings
This morning, traders saw the ADP Nonfarm Employment Change come in higher than expected and the markets are having a mixed reaction. President Trump will be speaking at 3:00 P.M. Central Time to introduce the tariff plan and how it will be rolled out, adding a level of clarity for the market moving forward into Q2.
If you have futures in your trading portfolio, you can check out on CME Group data plans available that suit your trading needs tradingview.com/cme/
*CME Group futures are not suitable for all investors and involve the risk of loss. Copyright © 2023 CME Group Inc.
**All examples in this report are hypothetical interpretations of situations and are used for explanation purposes only. The views in this report reflect solely those of the author and not necessarily those of CME Group or its affiliated institutions. This report and the information herein should not be considered investment advice or the results of actual market experience.

S&P500: Persistent SupportThe S&P 500 continued its recovery following its reaction to the support at 5509 points. However, in our primary scenario, we expect the index to fall below this mark to ultimately complete wave in green within our color-matched Target Zone (coordinates: 4988 points – 4763 points). Within this range, there are entry opportunities for long positions, which could be hedged with a stop 1% below the Zone’s lower boundary. Once the corrective movement has reached its low, the final upward movement of the green wave structure should commence. In the process, the index should gain significantly and reach the high of wave above the resistance at 6166 points. If this mark is surpassed prematurely, our alternative scenario with a 30% probability will come into play.

ES shorts with statistical projectionsWeekly manipulation targets were hit on Monday, leaving way for bearish price action for the rest of the week. I have been bearish since Tuesday, with the bullish daily manipulation targets being hit as well. I am looking for lower prices into the bearish targets for the week.

A market in limboThe S&P 500 daily chart implies a market in limbo as it goes into the tariff announcements on Wednesday. The price action is going to be 50-50. The last two days found buying coming into the market but will that buying behavior continue on Wednesday.

Daily Trade Recap based on VX Algo SystemEOD accountability report: +$446.25
Sleep: 10 hour, Overall health: Meh
**Daily Trade Recap based on VX Algo System **
9:30 AMVXAlgo ES 10M Sell Signal
2:57 PM VXAlgo NQ 10M Buy Signal

ES UpdateLooks like they turned the algos on so here's the 3hr chart update.
Just because they turned the algos on doesn't mean good news for the bulls, ES MFI is almost overbought, I expect it to get there at market open. 7am right now.
So basically I'm expecting the market to fill the down gap then drop again.
Don;t expect any more updates today, I'm going to work now.

ES1 2025-03-31 SPOOZ 15minOBHello everyone, I hope you won, stayed out, or learned something form the market today 😂.
Today was a easy grab.
Drawdown: 17. Tics
TP: 111. Tics Grabbed (out of 438)
Spooz Open Manipulation,
Broke near high,
Retraced to 15min Order Block,
TP Hit at 3 equal Highs (volume).
If you found this inciteful, join our group discussion! (link in bio)

A tense market environmentAlthough the S&P 500 daily chart indicates a market that got low enough to find buyers, it is a tense market environment as the market waits for the tariff announcements on Wednesday.

S&P 500 Above it, I’m maintaining a bullish perspective until the next BSL, then turning bearish again in line with the overall market trend.
Below , im keeping my bearish perspective.

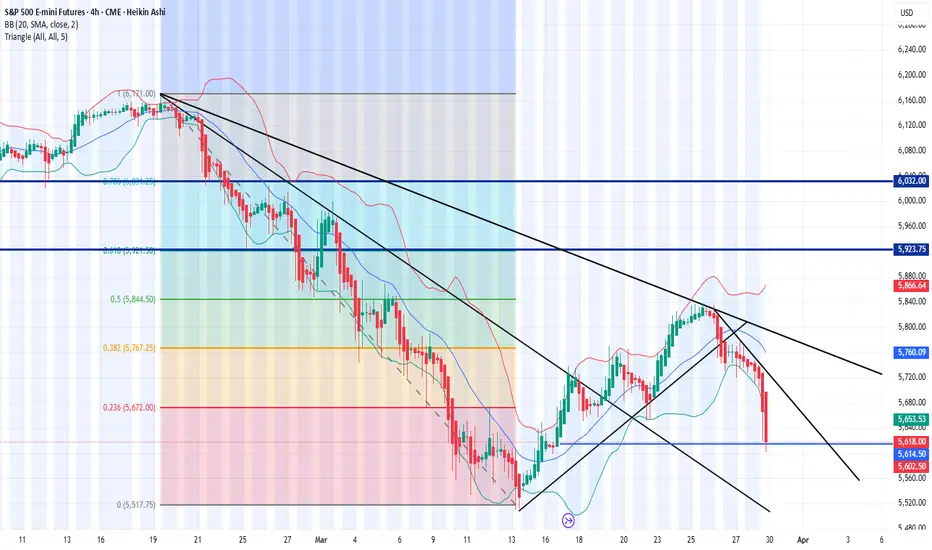
ES - Day Trading Analysis With Volume ProfileOn ES , it's nice to see a strong sell-off from the price of 5619 and 5651. It's also encouraging to observe a strong volume area where a lot of contracts are accumulated.
I believe that sellers from this area will defend their short positions. When the price returns to this area, strong sellers will push the market down again.
Downtrend and Volume cluster are the main reasons for my decision to go short on this trade.
Happy trading,
Dale

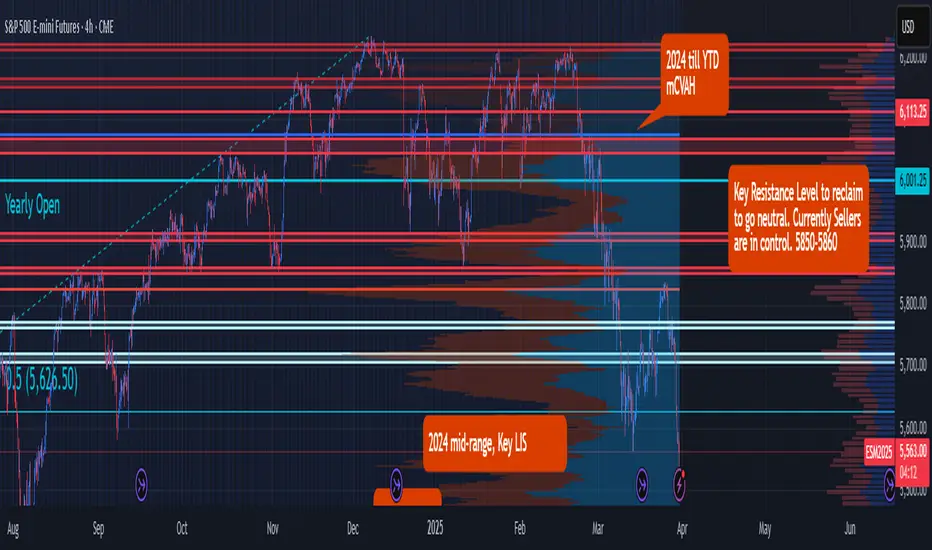
Liberation, Altercation or Doom? ES Futures weekly planCME_MINI:ES1!
Quick Update
The upcoming week is poised to be critical for financial markets as President Donald Trump's so-called "Liberation Day" on April 2 approaches. On this date, the administration plans to implement new tariffs aimed at reducing the U.S. trade deficit by imposing reciprocal duties on imports from various countries.
As April 2 looms, the full impact of these tariffs remains uncertain, leaving markets and investors in a state of heightened anticipation.
We may get clarity on the tariff situation on April 2, 2025.
Universal tariff announcement of categories of imports may clarify US administration’s maximum tariff escalation approach.
A phased out and unclear tariff approach may keep markets in limbo.
Economic Calendar
Keep an eye on the data docket, NFP and other key releases are due this week.
Tuesday, Apri 1, 2025 : ISM Manufacturing PMI, JOLTS Job Openings
Wednesday April 2, 2025 : ADP Employment Change, Factory Orders MoM
Thursday April 3, 2025 : Balance of Trade, Imports, Exports, ISM Services PMI, Initial Jobless Claims
Friday, April 4, 2025 : Non-Farm Payrolls, Unemployment rate, Average Hourly Earnings MoM,Average Hourly Earnings YoY, Fed Chair Powell Speech
Key Levels to Watch:
Yearly Open 2025 : 6001.25
Key Resistance : 5850- 5860
LVN : 5770 -5760
Neutral Zone : 5705-5720
Key LIS Mid Range 2024 : 5626.50
2024-YTD mCVAL : 5381
2022 CVAH : 5349.75
August 5th, 2024 Low : 5306.75
Scenario 1: Bold but Strategic Tariffs (Effective Use of Tariff to reduce trade deficit and raise revenue) : In this scenario, we may see relief rally in ES futures, price reclaiming 2024 mid-range with a move higher towards key resistance level.
Scenario 2: Maximum pressure, maximum tariff (All out trade war) : In this scenario, we anticipate a sell-off with major support levels, such as 2024- YTD mCVAL, 2022 CVAH and August 5th, 2024 low as immediate downside targets.
Scenario 3: Further delays in Tariff policy (A negotiating tool, with looming uncertainty) : In this scenario, sellers remain in control and uncertainty persists, while we anticipate that rallies may be sold, market price action may remain choppy and range bound.
Sp500 Weekly Action Areas & Price Targets 31/03/25In this update we review the recent price action in the emini SP500 futures and identify high probability action areas and price targets fort he trading week ahead!

Weekly Market Forecast: SELL THE INDICES!In this video, we will analyze the S&P 500, NASDAQ, AND DOW JONES Futures for the week of March 31st - April 4th.
The equity markets took a bearish turn last week. This is likely to continue for the upcoming week.
Monday is the end of March. Tuesday brings a new week and new opportunities. April 2nd brings... potentially market flipping volatility. The day the Trump tariffs are implemented.
Be careful. Let the market give you direction, and then get involved.
Enjoy!
May profits be upon you.
Leave any questions or comments in the comment section.
I appreciate any feedback from my viewers!
Like and/or subscribe if you want more accurate analysis.
Thank you so much!
Disclaimer:
I do not provide personal investment advice and I am not a qualified licensed investment advisor.
All information found here, including any ideas, opinions, views, predictions, forecasts, commentaries, suggestions, expressed or implied herein, are for informational, entertainment or educational purposes only and should not be construed as personal investment advice. While the information provided is believed to be accurate, it may include errors or inaccuracies.
I will not and cannot be held liable for any actions you take as a result of anything you read here.
Conduct your own due diligence, or consult a licensed financial advisor or broker before making any and all investment decisions. Any investments, trades, speculations, or decisions made on the basis of any information found on this channel, expressed or implied herein, are committed at your own risk, financial or otherwise.

No where to go but up....What a mess! As you can see from the 240 minute chart, things are indeed ugly. But, isn't it strange that we made all time highs just a month or so ago? Look at the Magic 7 stocks and find one that doesn't look buyable here. All the bearish sentiment in the world cannot stop the flood of FOMO money that will attract to the negative look of the chart to the first clear sign of a trend reversal. I don't care about the rest of the world, I am going to try and buy this somewhere between where we are and an absolute bottom in the 5500's.
Here is my default setupMean Reversion Channel
Swing Failure Pattern
BUY-SELL MAs RSI
Pivot Trendlines with Breaks
BUY-SELL Requirements info

bearflag broke downno rate cuts but im still balling
we already tested that gap (rectangle) so a second attempt will probably close it.
that will throw us well below the year to date value range
so im looking at it as a potential bottom.
if this gap fails to hold im looking at the previous range for help and the previous value area high to turn support (classic what was once resistance is now support)
on the shorter timeframe i anticipate 5485 to act as support a small bounce can make it look like a head and shoulders pattern for the bearflag target if there's any bullish play
note this is not a trade i will take unless the data and reaction at the level will look bullish.
so make sure you know we can straight up nuke on monday. (eyes on BTC during this weekend)
anyone who saw my posts before i talked about how we need to rotate back to value thats exactly what happened.
previous range value area high was left untested, retesting it is quite the possibility. (theres a gap right above it )
