DIYWallSt Trade Journal: Why Price Action Beats News **07/02/25 Trade Journal, and ES_F Stock Market analysis **
EOD accountability report: +763
Sleep: 4.5 hours
Overall health: sleep deprived
** VX Algo System Signals from (9:30am to 2pm) 4/4 success**
— 9:57 AM Market Structure flipped bullish on VX Algo X3! :check:
— 10:30 AM Market Structure flipped bullish on VX Algo X3! :check:
— 11:10 AM VXAlgo ES X1 Sell Signal :x:
**What’s are some news or takeaway from today? and What major news or event impacted the market today? **
You can't trade on news, the only thing that matters in day trading is price action.
Bad news can still make the market go up.
News
The U.S. economy lost 33,000 jobs in June, as per ADP, badly missing forecasts for a gain of 99,000.
MICROSOFT TO LAY OFF AS MANY AS 9,000 EMPLOYEES
Tesla’s NASDAQ:TSLA Q2 deliveries miss consensus expectations
**What are the critical support levels to watch?**
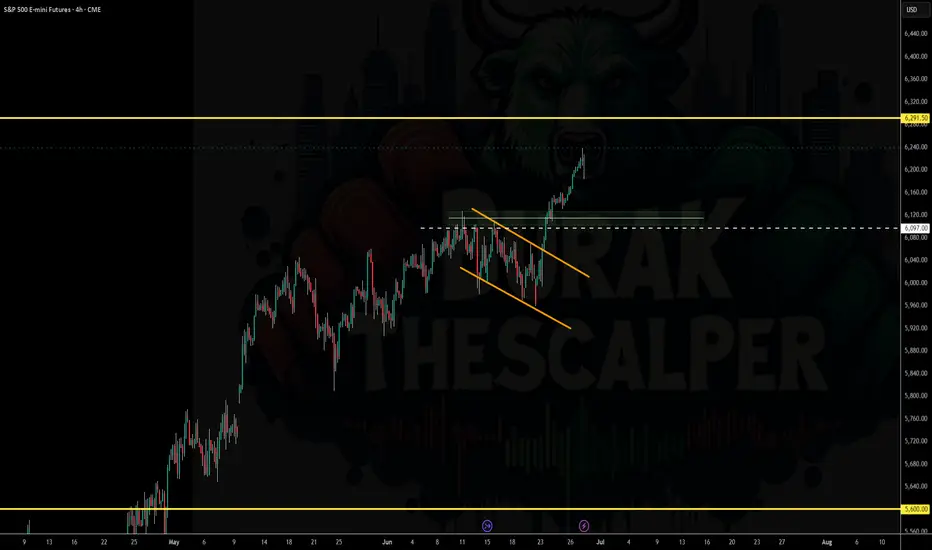
--> Above 6250= Bullish, Under 6240= Bearish
Video Recaps -->https://www.tradingview.com/u/WallSt007/#published-charts
WSP1! trade ideas

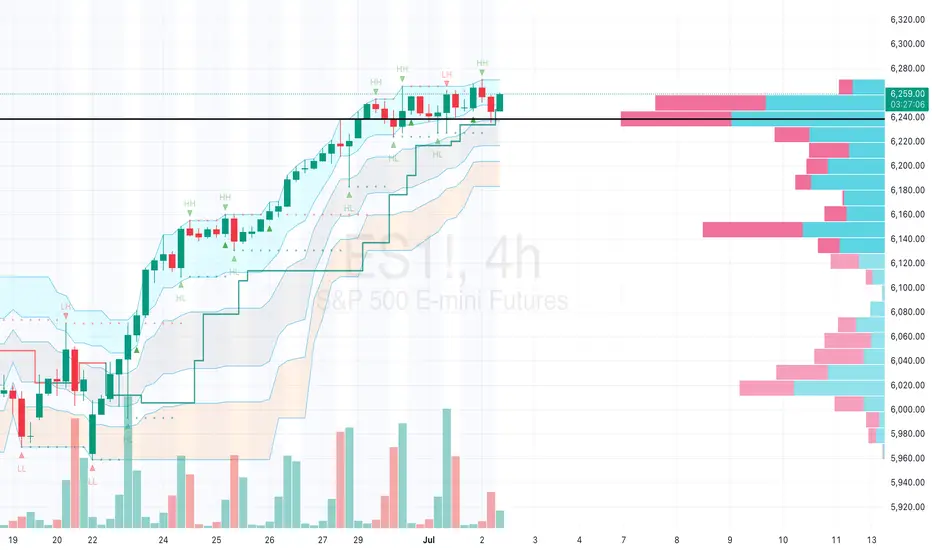
S&P 500 E-Mini Futures (ES) Market AnalysisKey Observations
The S&P 500 E-Mini Futures (ES) is currently trading at 6,240.00, with a high of 6,259.00 and a low of 6,244.75, based on the 4-hour chart provided.
The price is approaching a significant resistance level around 6,240–6,259, where recent selling pressure is evident from the volume profile.
The market has shown a strong upward trend, with higher highs (HH) and higher lows (HL) forming since the last major low near 6,020, but momentum appears to be slowing.
Technical Analysis
Price Action: The chart indicates a consolidation phase near the current level of 6,240.00, following a rally from the support zone around 6,020–6,040. The recent red candles suggest a potential reversal or pause in the uptrend.
Volume Profile: The right-hand volume profile shows high volume nodes (HVNs) between 6,180 and 6,240, with the point of control (POC) near 6,220–6,240. This indicates strong trader interest and a potential support/resistance zone. The pink bars (selling volume) dominate above 6,240, signaling rejection at higher levels.
Support and Resistance:
Support: 6,220–6,240 (POC), with a deeper support at 6,180–6,200 if the price breaks lower.
Resistance: 6,259 (recent high), with a psychological barrier at 6,300 if bullish momentum resumes.
Indicators: The chart includes Market Profile levels (e.g., HH, HL, LH, LL), suggesting a structured approach to identifying value areas. The flattening of the value area suggests a lack of directional conviction at present.
Market Context
The ES has been influenced by mixed economic data, including the June 2025 ADP employment report, which reported a loss of 33,000 jobs, signaling potential economic slowdown. This could pressure equity markets, including the S&P 500.
The upcoming Nonfarm Payrolls report on July 03, 2025, is a critical event. A weaker-than-expected result (forecasted at 110,000 jobs) could increase bearish pressure, while a strong report might push the ES toward new highs.
Recent market performance (e.g., NASDAQ 100 weakness due to Tesla news) may also be impacting the broader index, though the S&P 500 has shown relative resilience.
End of Month and QuarterAs we wrapped up the end of the month and the end of the quarter, it can be helpful for traders to take time and look back on how markets have performed. The second quarter of 2025 showed extreme volatility in many markets, starting off with the strong broad selloff with the tariff announcement in early April, and as that was walked back the markets have rallied and equity markets are trading near all time high prices, specifically the S&P and Nasdaq. Traders also saw the Fed keep rates unchanged at the June meeting, stating that rate cuts are available if needed depending on the data.
As of now, the CME Fed Watch Tool is pricing in another pause for rates at the July meeting in a few weeks, and the first cut coming at the September meeting at a near 75% probability by 25 basis points. Powell has mentioned that the Fed does not want to be early with rate cuts, and wants to only use the cuts if necessary and as a tool. There will be imperative data looking at GDP, inflation, and jobs that may give traders an idea of the direction the Fed will go on rates for the second half of the year.

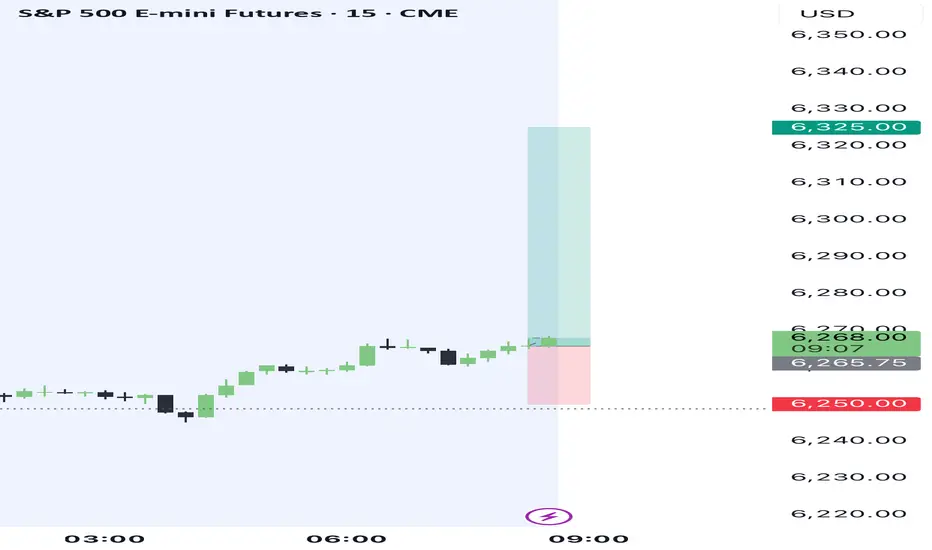
TiqGPT buy setup ESJul 2, 2025 8:43 AM
MARKET NARRATIVE:
1D Timeframe: The daily chart shows a strong bullish momentum with a series of green candles indicating a sustained upward move. This suggests institutional buying pressure and a lack of significant sell-side resistance.
4H Timeframe: The 4-hour chart confirms the bullish sentiment seen on the daily chart, with recent candles forming higher highs and higher lows. This is indicative of continued institutional interest in driving prices higher.
1H Timeframe: On the hourly chart, the bullish trend continues with price action showing smaller pullbacks followed by aggressive bullish candles. This pattern suggests that any dips are being used as buying opportunities by institutions.
15M Timeframe: The 15-minute chart shows more granularity in the price action, with recent bullish candles breaking past previous minor highs. This indicates that short-term liquidity is being taken on the buy-side, likely trapping late retail sellers.
5M Timeframe: The 5-minute chart shows a consolidation pattern forming at higher levels, suggesting a pause in the immediate bullish momentum. This could be a setup for another push higher as the market digests the gains.
1M Timeframe: The 1-minute chart shows choppy but generally upward-trending price action, indicating ongoing micro battles between buyers and sellers with buyers maintaining a slight edge.
INSTITUTIONAL THESIS:
Institutions appear to be in a phase of accumulation and upward price pressure across multiple timeframes. The consistent formation of higher highs and higher lows across these timeframes suggests a coordinated effort to drive prices higher, likely targeting overhead liquidity pools where institutional sell orders may be placed.
LEARNING POINT:
"Multi-timeframe confluence of bullish order flow and mitigation of lower timeframe liquidity pools."
SIGNAL: BUY
SYMBOL: S&P 500 E-mini Futures (ES1) ENTRY PRICE: $6,266.25 STOP LOSS: $6,250.00 (Below the recent minor low on the 15M chart) TARGET PRICE: $6,285.00 (Next potential liquidity pool on the 1D and 4H charts) CONDITION: Buy limit order at current market price with confirmation of continued bullish momentum on lower timeframes. RATIONALE: Strong bullish momentum across all timeframes, consistent institutional buying, and potential for reaching higher liquidity pools. STRATEGIES USED: Multi-timeframe bullish momentum, liquidity pool targeting. URGENCY: HIGH TIMEFRAME: Short-term to medium-term CONFIDENCE SCORE: 90% based on institutional confluence RISK/REWARD RATIO: Calculated as 1:3.8
Risk: $16.25 (Entry Price - Stop Loss = $6,266.25 - $6,250.00)
Reward: $18.75 (Target Price - Entry Price = $6,285.00 - $6,266.25)
Ratio: 1:3.8 (Reward ÷ Risk = $18.75 ÷ $16.25)
Working towards a new highThe S&P 500 daily chart indicates that buyers continue to be present and the next objective to the upside on the daily chart is 60 to 90.

DIYWallSt Trade Journal: Why Traders Are Rotating from Nasdaq to**07/01/25 Trade Journal, and ES_F Stock Market analysis **
EOD accountability report: +1160
Sleep: 5 hours
Overall health: Need to catch up on sleep again
** VX Algo System Signals from (9:30am to 2pm) 4/4 success**
9:39 AM Market Structure flipped bullish on VX Algo X3! :check:
11:00 AM Market Structure flipped bearish on VX Algo X3 :check:
11:24 AM VXAlgo ES X1 Buy signal :check:
12:00 PM Market Structure flipped bullish on VX Algo X3! :check:
**What’s are some news or takeaway from today? and What major news or event impacted the market today? **
RTY and YM leading the way today
NQ lagging
Why is this?
The answer is, Simple Supply and Demand theory.
Money has to come from somewhere.
If Money is going to YM and RTY,
Money has to leave from NQ or ES or both.
There is not an infinite amount of money, So if one index is outperforming like crazy over the other. It must be draining from it
Why would it drain from NQ? Easy
Because NQ and ES already hit ATH,
YM and RTY has not hit ATH yet.
So people are selling NQ and buying YM because it is on Discount
News
N/A
**What are the critical support levels to watch?**
--> Above 6235= Bullish, Under 6210= Bearish
Video Recaps -->https://www.tradingview.com/u/WallSt007/#published-charts

Waiting for additional informationThe S&P 500 daily chart structure implies a bullish bias with a 6282 objective as it waits for additional fundamental information that will be revealed as this week progresses.

06/30/25 Trade Journal, and ES_F Stock Market analysis
EOD accountability report: +212
Sleep: 7 hours
Overall health: Good, caught up on workout and sleep over the weekend.
** VX Algo System Signals from (9:30am to 2pm) 2/4 success**
— 12:20 PM VXAlgo NQ X1 Sell Signal :x:
— 12:30 PM Market Structure flipped bullish on VX Algo X3!:check:
— 1:55 PM VXAlgo NQ X1 Buy Signal :x:
— 2:00 PM Market Structure flipped bearish on VX Algo X3! :check:
**What’s are some news or takeaway from today?
and What major news or event impacted the market today?
**
The X1 Signals today has been happening after market structure signals and usally that means MM is going to change the direction to the opposite way to scam us. Based on that, I decided to lock out my account after making $200 today so i don't get caught in the scam.
News
EU TO ACCEPT TRUMP’S UNIVERSAL TARIFF BUT SEEKS KEY EXEMPTIONS — 2:07 PM
What are the critical support levels to watch?
--> Above 6240= Bullish, Under 6210= Bearish
Video Recaps -->https://www.tradingview.com/u/WallSt007/#published-charts

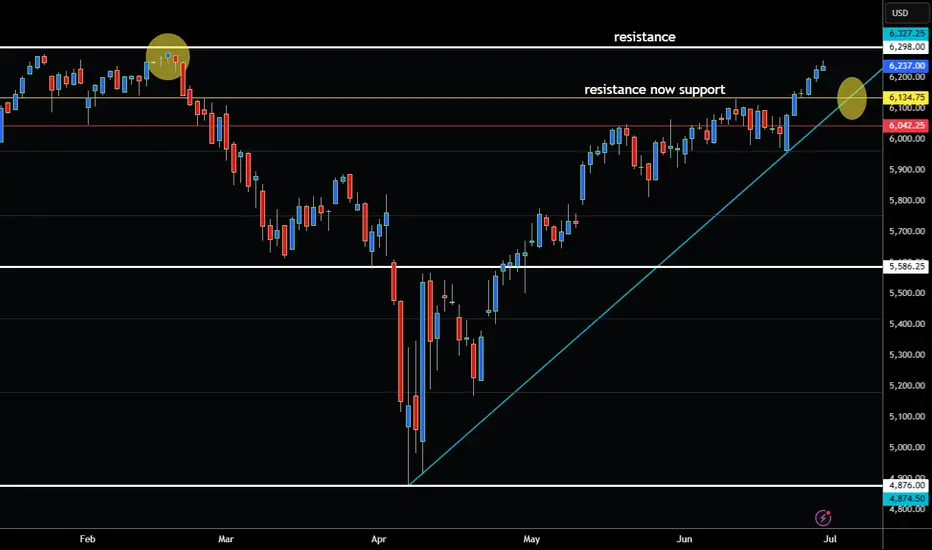
S&P 500 ABOUT TO TEST CRITCAL RESISTANCE LEVEL!Hey Traders so today watching S&P500 and looks like strong resistance at 6300.
Market can do 1 of 3 things like before.
Pause, Reverse, or Breakthrough so if your long watch for reversals. If not watch for pullback to new support level around 6135. Can be a nice area to enter new long positions in the buy zone.
Place stops under trendline around 6040.
Remember trend is your friend so if bullish wait for pullback. However if bearish wait for break below trendline to confirm market wants to break lower.
Also watch Nasdaq 100 because it normally leads the market higher. If S&P rises but Nasdaq is holding back it's not a good sign for breakout.
Always use Risk Management!
(Just in we are wrong in our analysis most experts recommend never to risk more than 2% of your account equity on any given trade.)
Good Luck & Hope This Helps Your Trading 😃
Clifford
Stock Index Futures - ES, NQ, YM - Weekly AnalysisS&P 500 / ESU2025
Key drivers:
Rebounding from April’s tariff-induced lows, boosted by optimism around U.S.–China trade, easing geopolitical tensions, and Fed rate‑cut expectations
Market breadth strengthened as sectors beyond mega-cap tech—especially financials and industrials—joined the rally
Nasdaq / NQU2025
Catalysts:
Continued leadership from AI/digital giants like Nvidia (which rose ~4% on Friday and regained its title as the world’s most valuable company) alongside broader tech momentum
Dow Jones / YMU2025
Highlights:
Strongest weekly performance since early April.
Corporate earnings (e.g., Nike’s better-than-expected report) provided sector-specific tailwinds.
Cross‑asset momentum: Equities rebounded strongly from April’s slump, logging back-to-back months of double-digit gains—fuelled by tariff ease, geopolitical calm, and dovish Fed signals.
Vigilance required: While sentiment is strong, potential catalysts include the July 9 deadline on tariff pauses, upcoming jobs data, Fed commentary, and the tax/spending package.
------------------------------------
I will be approaching the markets differently from now on.
Based on the feedback from past analysis, I will be compiling all related pairs into one video, giving you guys the ability to see how one asset affects the other.
This is called inter-market relationship and it's something i've been doing for years.
It gives you confidence on what pairs are 'Hot Picks' and the ones that have a high chance of not delivering the way you want.

SP500 - Cycle Analysis; New V-Bottom24 Dec 2018 - V-Bottom Trough:
This marks a clean V-bottom. Both the 227-ROC and 114-ROC showed simultaneous positive acceleration after price reacing its low. Shortly after, both crossed their 57-SMA almost in sync — increasing the probability of a sustained bullish move. Price confirmed this by breaking resistance and forming a V pattern. This was further validated by the centered moving average crossover (114-CMA crossing above 227-CMA).
25 Mar 2020 - Deep COVID Crash Trough:
During this phase the priced broke below the support, creating a deep trough. Altough both ROC lines initially showed strong negative acceleration due to the COVID-19 crash, they soon reversed above their 57-SMAs, signaling a major shift in momentum. This coincided with the price breaking above the key resistance which was also crossed in 2019 when confirming the old V-pattern. After this breakout, a brief pullback followed before the uptrend resumed with increasing strength.
22 Jun 2021 to 19 Dec 2023 - Pattern
During the initial period a bearish divergence was visible in the ROC, nevertheless price and rate of change both declined making a low in early October 2022. A technical pattern began to form, which appears to align more closely with a symmetrical triangle; So when measuring its height and projecting it from the breakout point aligns with the new all-time highs that were reached on 27 June 2025.
21 Mar 2025 - New Cycle Trough
A new V-bottom formed shortly after the current cycle began. Both ROC indicators had already crossed their SMAs to the upside, showing early signs of positive acceleration, days before of price broke through the resistance and reached the new record high.
The 227-SMA is likely to cross from below the fast SMA while a possibility of a pullback increase.
Following that, the 114-CMA will probably has the chance to cross back the 227-CMA, with the price potentially confirming a new support level and resuming its uptrend - in line with the broader cycle timeline.

Risk On! Buy Stock Indices, Sell Gold, Silver.In this Weekly Market Forecast, we will analyze the S&P 500, NASDAQ, DOW JONES, Gold and Silver futures, for the week of June 29 - July 4th..
Stock Indices are pointed to the all time highs. Take advantage of the "risk on" environment while it lasts!
Gold and Silver have seen the outflows and profit taking... so look for lower prices this week.
Oil ... be patient. After a huge dump in prices when the tensions eased up between Israel/US and Iran, price is moving sideways in consolidation. I suspect lower prices to come, but I urge patience! Wait for the signature of price to show it intends to move lower. A sweep of the range highs and a run of the range lows right after... is the signal to sell.
Enjoy!
May profits be upon you.
Leave any questions or comments in the comment section.
I appreciate any feedback from my viewers!
Like and/or subscribe if you want more accurate analysis.
Thank you so much!
Disclaimer:
I do not provide personal investment advice and I am not a qualified licensed investment advisor.
All information found here, including any ideas, opinions, views, predictions, forecasts, commentaries, suggestions, expressed or implied herein, are for informational, entertainment or educational purposes only and should not be construed as personal investment advice. While the information provided is believed to be accurate, it may include errors or inaccuracies.
I will not and cannot be held liable for any actions you take as a result of anything you read here.
Conduct your own due diligence, or consult a licensed financial advisor or broker before making any and all investment decisions. Any investments, trades, speculations, or decisions made on the basis of any information found on this channel, expressed or implied herein, are committed at your own risk, financial or otherwise.

here is the #chart for $SPY $SPX #ES_F Bullish with caution. AMEX:SPY is near all-time highs at $614.91, up 0.52% daily and 4.83% monthly, driven by trade deal optimism and expected Fed rate cuts. Technicals show a strong buy signal, but failure to break 6178.75 could signal a pullback. Tariff risks and inflation (core PCE at 2.7%) add caution
S&P 500 BULLISH GRAB: Steal These Gains Before the Trap Closes!🚨 E-MINI S&P 500 HEIST: Bullish Loot Before the Market Turns (Thief Trading Blueprint) 🚨
🌟 Hola! Oi! Bonjour! Ciao! Guten Tag! 🌟
Attention all Market Bandits & Index Raiders! 🏴☠️📊💰
🔥 Thief Trading Intel: We're targeting ES1! (E-Mini S&P500) for a potential bullish breakout! Long entry only—approaching high-risk Red Zone: overbought, consolidating, and ready for a move. Don't let the bears steal your profits!
"Grab your gains and disappear into the night—you've earned this steal!" 💰🌙
🚪 ENTRY: The Vault is Cracked!
📈 "Swipe bullish positions at any price—the heist is ON!"
Buy Limit orders near swing lows/highs (15-30 min TF)
📌 Pro Tip: SET PRICE ALERTS! Don't miss the move
🛑 STOP LOSS: Escape Route
📍 Smart Thief SL: Nearest swing low (4H timeframe)
📍 Adjust based on your risk tolerance & position size
🎯 TARGET: Take the Money & Run!
🎯 6260.00 (or exit early if the market turns)
⚡ SCALPERS' QUICK GRAB
👀 Long positions ONLY!
Big accounts? Strike now
Small accounts? Ride with swing traders
Trailing SL = Your Getaway Car!💨
📢 WHY THIS HEIST? (S&P 500 Setup)
Neutral trend with bullish potential! Watch for:
Fundamentals (COT, Macro Data, Geopolitics)
Market Sentiment & Sector Rotation
Index-Specific Patterns
🔗 Full analysis? Check our bio0 linnks! 👉🏻👉🏻👉🏻
⚠️ WARNING: News = Danger Zone! 📰🚨
Economic reports move markets! Protect your loot:
❌ Avoid new trades during news
🔒 Trailing stops lock in profits
💖 SUPPORT THE HEIST CREW!
💥 SMASH THAT BOOST BUTTON! 💥
More boosts = bigger future scores!
Stronger crew = more profits for all!
Trade like a thief, profit like a king! 👑💰
Next heist coming soon—stay sharp! 🎯🤫

"Pricing Perfection: The Thin Ice Beneath Record Highs"As markets push to all-time highs, the rally feels less like euphoria and more like walking a tightrope. What happens when the market prices in perfection
The S&P 500 is sitting at all-time highs, not because the world is perfect — but because the market is betting that it will be. This rally is no longer driven by surprises or revisions — it’s driven by expectations that everything will go right: inflation will cool, rates will drop, earnings will beat, AI will deliver, and geopolitical tensions will stay neatly compartmentalized.
In reality, we are walking on thin ice. Beneath the surface lies fragile market breadth, decelerating economic data, and a Fed that continues to speak hawkishly even as liquidity props things up. Any minor deviation from this “Goldilocks” scenario — a hot CPI, a guidance miss from a mega-cap, or a geopolitical headline — has the power to trigger sharp repricing.
When the market prices in perfection, it doesn’t need a bear to show up. It just needs something less than ideal. At these levels, risk becomes asymmetric — all reward is front-loaded, but the pain, if it comes, is unpriced and sudden.
The current equity landscape isn’t just optimistic — it’s priced for flawless execution across earnings, rates, geopolitics, and liquidity.
That leaves asymmetric downside risk if even a minor narrative breaks. Trump has become know for creating larger than minor narratives... ;)

S&P500: Target Zone DeactivatedThe S&P 500 extended its bullish trend yesterday, moving beyond our now-deactivated (formerly magenta) Target Zone. Existing positions remain intact, as the stop set 1% above the upper boundary has not been triggered. In our updated primary scenario, we anticipate continued upward movement within magenta wave (B), potentially reaching the resistance at 6675 points. Once this peak is established, we expect a corrective decline to begin in the form of wave (C), which should guide the index into the green Long Target Zone between 4988 and 4763 points. There, the larger green wave is expected to complete. A sustained breakout above the 6675-point level would shift the outlook in favor of the alternative scenario. In that case, green wave alt. would be considered complete—a trajectory we currently assign a probability of 40%.
📈 Over 190 precise analyses, clear entry points, and defined Target Zones - that's what we do.

How to Trade When Buy/Sell Alerts Conflict with Market StructureQuestion:
If we have a buy/sell alert and an opposing Market Structure, how can we tell which will prevail or is heavier?
Answer (VX Algo System perspective):
In the VX Algo system, both the alert signals (buy/sell) and the market structure are crucial, but they serve different roles:
Alerts are dynamic triggers based on price action, momentum, or specific algorithmic conditions. They indicate potential entry or exit points.
Market Structure reflects the broader trend and underlying order flow, indicating the prevailing direction of the market (e.g., higher highs and higher lows for bullish structure, or lower highs and lower lows for bearish structure).
When an alert contradicts the prevailing market structure, the heavier factor is usually the Market Structure because it represents the dominant order flow and sentiment. In other words, alerts give you tactical timing, but market structure provides strategic context.
How to tell which prevails:
Confirm with Market Structure: If the market structure is bullish (uptrend), a buy alert aligns with it and is more likely to succeed. A sell alert against that structure is a warning sign that the alert may be weaker or a potential false signal.
Volume and Momentum: Use volume or momentum indicators (built into VX Algo or complementary tools) to see if the alert has strength behind it. A strong sell alert with high volume during an uptrend may indicate an imminent structure shift.
Multiple Timeframe Analysis: Check if the opposing alert is supported or rejected on higher timeframes. A buy alert on a lower timeframe against a bearish higher timeframe structure is less likely to prevail.
Risk Management: If you trade against structure alerts, reduce position size and tighten stops until the structure confirms the shift.
Summary: Market structure is heavier and more reliable for directional bias. Alerts provide tactical entry timing. When they conflict, lean on structure for bias but watch for alert strength as early signals of possible structure changes.

Buyers maintain controlBuyers maintain control going into the close on Friday in the S&P 500 daily chart. The expectation is for further movement to the upside but not a dramatic move on Monday.

06/27/25 Trade Journal, and ES_F Stock Market analysis 06/27/25 Trade Journal, and ES_F Stock Market analysis
EOD accountability report: +915
Sleep: 6 hours
Overall health: edgy from sleep
** VX Algo System Signals from (9:30am to 2pm) 3/4 success**
9:37 AM VXAlgo ES X1 Buy signal :check:
9:55 AM Market Structure flipped bullish on VX Algo X3! :check:
10:31 AM VXAlgo ES X1 Sell Signal (double sell) iffy
1:43 PM Market Structure flipped bearish on VX Algo X3! :check:
**What’s are some news or takeaway from today?
and What major news or event impacted the market today?
**
Early on in the market, I noticed that there was heavy manipulate by the MM with violent buy and sell. This somewhat warns that today's market could be tough to trade and you have to be very patient.
News
PRES TRUMP: ENDING ALL TRADE TALKS WITH CANADA; WILL TELL CANADA ITS TARIFF LEVEL IN COMING DAYS - around 1 :40pm est
What are the critical support levels to watch?
--> Above 6200= Bullish, Under 6185= Bearish
Video Recaps -->https://www.tradingview.com/u/WallSt007/#published-charts

S&P 500 VS ATH, how to break through?Technical objective achieved! The S&P 500 index has reached its all-time high, offering a bullish V-shaped recovery since the bearish shock of early April against the backdrop of the trade war between the USA and its main trading partners.
In our previous TradingView analysis, we highlighted numerous favorable technical signals since mid-April in favor of this rally towards the all-time record, including an analysis of the chart battlefield for the S&P 500 index at the beginning of June, which you can reread by clicking on the image below. In general, don't hesitate to follow our Swissquote account for regular updates on stock market indices and all other asset classes (bitcoin, forex, commodities, etc.).
The short-term question is whether the S&P 500 index is in a position to break through its all-time high (ATH) in the immediate future, or whether it needs to enter a consolidation phase first.
The answer to this question is both technical and fundamental.
1) From a technical point of view, here are the conditions that would enable the S&P 500 to surpass its all-time record (even if it were to enter a short-term bearish consolidation first)
The market may need to take a breather in the short term after the strong upward rally of the last two months. But for the medium/long term, the underlying trend remains bullish above support at 5800 points and above the 200-day moving average. On the long time horizon, the theoretical target for wave 5 (Elliott waves) lies at 6500 points.
In order for the S&P 500 to be in a position to break through its all-time record, it is imperative that stocks in the most important sectors in terms of weighting are bullish. The S&P 500 can only go higher if the technology, financials and consumer discretionary sectors contribute.
The study of US retail trader sentiment provides a contrarian approach to the financial markets, and it bodes well that doubt and pessimism remain dominant among retail investors. Bear in mind that market tops are built on euphoria, not pessimism.
Finally, in terms of quantitative analysis, the overbought zone is still a long way from the current price level, so it's conceivable that the S&P 500 index could be in a position to surpass its all-time record in the course of July, even if a consolidation phase were to develop in the short term.
2) In terms of fundamentals, two factors seem to me to be essential for the S&P 500 index to be in a position to make further progress
Firstly, the US equity market will not move higher until there is confirmation that the Fed will resume cutting the federal funds rate. On this subject, this week we offered you a full fundamental analysis, which you can read below. The market needs the FED's pivot on either July 30 or September 17. In terms of valuation, the S&P 500 is expensive again, so rate cuts are needed to justify further upside.
With the rebound in share prices over the past 2 months, S&P 500 valuation is indeed back in the high zone, so we'll need sharply higher prospective earnings to justify a possible new all-time high in the coming months.
DISCLAIMER:
This content is intended for individuals who are familiar with financial markets and instruments and is for information purposes only. The presented idea (including market commentary, market data and observations) is not a work product of any research department of Swissquote or its affiliates. This material is intended to highlight market action and does not constitute investment, legal or tax advice. If you are a retail investor or lack experience in trading complex financial products, it is advisable to seek professional advice from licensed advisor before making any financial decisions.
This content is not intended to manipulate the market or encourage any specific financial behavior.
Swissquote makes no representation or warranty as to the quality, completeness, accuracy, comprehensiveness or non-infringement of such content. The views expressed are those of the consultant and are provided for educational purposes only. Any information provided relating to a product or market should not be construed as recommending an investment strategy or transaction. Past performance is not a guarantee of future results.
Swissquote and its employees and representatives shall in no event be held liable for any damages or losses arising directly or indirectly from decisions made on the basis of this content.
The use of any third-party brands or trademarks is for information only and does not imply endorsement by Swissquote, or that the trademark owner has authorised Swissquote to promote its products or services.
Swissquote is the marketing brand for the activities of Swissquote Bank Ltd (Switzerland) regulated by FINMA, Swissquote Capital Markets Limited regulated by CySEC (Cyprus), Swissquote Bank Europe SA (Luxembourg) regulated by the CSSF, Swissquote Ltd (UK) regulated by the FCA, Swissquote Financial Services (Malta) Ltd regulated by the Malta Financial Services Authority, Swissquote MEA Ltd. (UAE) regulated by the Dubai Financial Services Authority, Swissquote Pte Ltd (Singapore) regulated by the Monetary Authority of Singapore, Swissquote Asia Limited (Hong Kong) licensed by the Hong Kong Securities and Futures Commission (SFC) and Swissquote South Africa (Pty) Ltd supervised by the FSCA.
Products and services of Swissquote are only intended for those permitted to receive them under local law.
All investments carry a degree of risk. The risk of loss in trading or holding financial instruments can be substantial. The value of financial instruments, including but not limited to stocks, bonds, cryptocurrencies, and other assets, can fluctuate both upwards and downwards. There is a significant risk of financial loss when buying, selling, holding, staking, or investing in these instruments. SQBE makes no recommendations regarding any specific investment, transaction, or the use of any particular investment strategy.
CFDs are complex instruments and come with a high risk of losing money rapidly due to leverage. The vast majority of retail client accounts suffer capital losses when trading in CFDs. You should consider whether you understand how CFDs work and whether you can afford to take the high risk of losing your money.
Digital Assets are unregulated in most countries and consumer protection rules may not apply. As highly volatile speculative investments, Digital Assets are not suitable for investors without a high-risk tolerance. Make sure you understand each Digital Asset before you trade.
Cryptocurrencies are not considered legal tender in some jurisdictions and are subject to regulatory uncertainties.
The use of Internet-based systems can involve high risks, including, but not limited to, fraud, cyber-attacks, network and communication failures, as well as identity theft and phishing attacks related to crypto-assets.

Confidence going into the weekendA stronger close in the S&P 500 daily chart above 6235 would imply the higher confidence going into the weekend. This would indicate that buyers are willing to hold onto positions going into the weekend.

06/26/25 Trade Journal, and ES_F Stock Market analysis 06/26/25 Trade Journal, and ES_F Stock Market analysis
EOD accountability report: +731.25
Sleep: 5 hours
Overall health: meh
** VX Algo System Signals from (9:30am to 2pm) 3/3 success**
— 9:38 AM Market Structure flipped bullish on VX Algo X3
— 10:30 AM Market Structure flipped bullish on VX Algo X3!
— 11:27 AM VXAlgo ES X1 Sell Signal
What’s are some news or takeaway from today?
and What major news or event impacted the market today?
today was another interesting day, i am noticing that when market structure changes 2x in the same direction, it is usally pretty effective and scammy at the same time
News
*NVIDIA NASDAQ:NVDA SHARES HIT A NEW HIGH TO RECLAIM WORLD'S LARGEST STOCK TITLE - market is being carried by the momentum of mag 7
What are the critical support levels to watch?
--> Above 6175 = Bullish, Under 6155= Bearish
Video Recaps -->https://www.tradingview.com/u/WallSt007/#published-charts

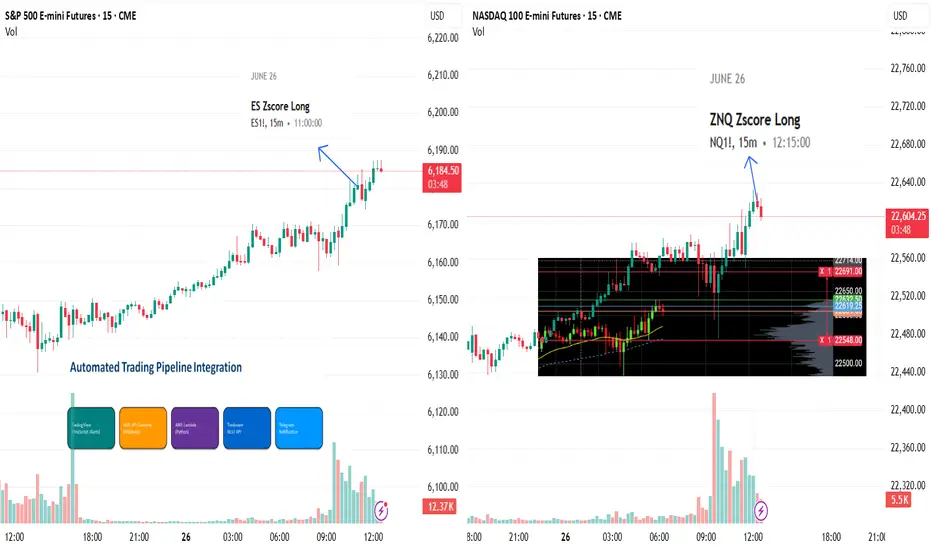
June 26: Long ES and NQ
My two algorithmic strategies each generated a signal. The signals were triggered live in TradingView and sent via web-hook to AWS. From there, an AWS Lambda function processed the alerts and placed the orders through the Tradovate API directly into the Tradovate platform.