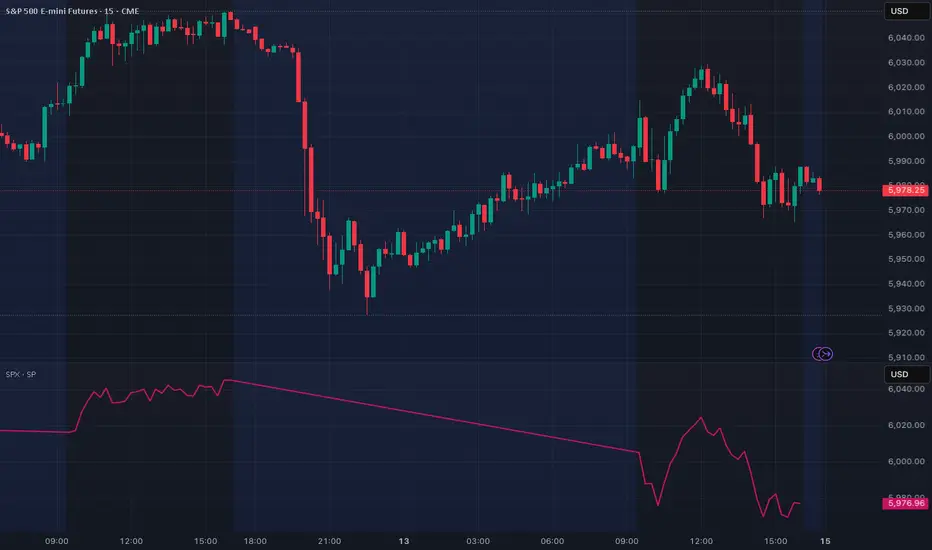
SPX Futures - Sunday Night Must Watch (bookmark this chart)This chart displays the price action of the S&P 500 E-mini Futures (ES), a stock market index futures contract that is traded on the Chicago Mercantile Exchange's Globex electronic trading platform. The S&P 500 index is a capitalization-weighted index that tracks 500 of the largest U.S. companies, making it a key benchmark for the overall health of the U.S. economy and stock market. This particular chart visualizes the ongoing battle between buyers and sellers, with the candlesticks representing the open, high, low, and close prices for each period. By analyzing the patterns and trends on this chart, traders and investors can speculate on the future direction of the S&P 500 index. This analysis is often supplemented with various technical indicators that can provide further insights into market momentum, volatility, and potential turning points. Lower pane is the actual SPX which will be live only during market hours.
WSP1! trade ideas
Buy OIL & GOLD, Sell Stocks Indices When Missiles Are Flying!In this Weekly Market Forecast, we will analyze the S&P 500, NASDAQ, DOW JONES, Gold and Silver futures, for the week of June 16-20th.
When missiles start flying in the Middle East, investors become reactively risk averse. Money goes from stocks to safe havens and oil. That's it. Expect oil prices to rise, Gold to reach new highs, and the equity markets to see more sellers than buyers.
This environment may last a few days or a few weeks. Keep an ear to the news.
Enjoy!
May profits be upon you.
Leave any questions or comments in the comment section.
I appreciate any feedback from my viewers!
Like and/or subscribe if you want more accurate analysis.
Thank you so much!
Disclaimer:
I do not provide personal investment advice and I am not a qualified licensed investment advisor.
All information found here, including any ideas, opinions, views, predictions, forecasts, commentaries, suggestions, expressed or implied herein, are for informational, entertainment or educational purposes only and should not be construed as personal investment advice. While the information provided is believed to be accurate, it may include errors or inaccuracies.
I will not and cannot be held liable for any actions you take as a result of anything you read here.
Conduct your own due diligence, or consult a licensed financial advisor or broker before making any and all investment decisions. Any investments, trades, speculations, or decisions made on the basis of any information found on this channel, expressed or implied herein, are committed at your own risk, financial or otherwise.

A cool off dayA cool off day is expected in the S&P 500 daily chart for Monday, June 16. This would be reflected as a day that would trade inside the range of Friday's daily chart. It will take new information to create volatility and directional up or down movement beyond the midpoint of Friday's daily chart.

Futures RSII will go through why I prefer the 63 RSI to be OHLC4 or HLC3. That's because I think Volume Weighted MA is influenced by the high, low, and close price, so I use either that or OHLC4 after double smoothing it. Watch the 70-30 and oversold levels as a potential reversal play; typically, everything above 35 is bullish and everything below 65 is bearish, with 50 as TP. The most powerful aspect of the RSI lies in finding divergences from the strength of the RSI and the direction of price; that's where the largest trades I have taken were made.

SHORT SP500fundamental : negative dollar
Techniq: respecting 15M BEARISH GAP
OB = BB
SSL still not taken

06/13/25 Trade Journal, and ES_F Stock Market analysisEOD accountability report: +3825
Sleep: 5.5 hours (sleep is declining, will spend the weekend catching up)
Overall health: Good
What was my initial plan? I wanted to short 6016-6020 area in the morning but we didn't open up to that, so i just sat on sideline until we hit the 6025 , took a big short there and paid off really well.
Daily Trade recap based on VX Algo System from (9:30am to 2pm)
— 9:30 AM Market Structure flipped bearish on VX Algo X3!
— 10:30 AM Market Structure flipped bearish on VX Algo X3!
— 10:40 AM VXAlgo YM X1 Buy Signal
— 11:30 AM Market Structure flipped bullish on VX Algo X3!
— 12:21 PM VXAlgo ES X1 Sell Signal (double signal)
— 1:12 PM VXAlgo NQ X3 Sell Signal
— 1:30 PM Market Structure flipped bearish on VX Algo X3!
Next day plan--> Above 6010 = Bullish, Under 5965= Bearish
Video Recaps -->https://www.tradingview.com/u/WallSt007/#published-charts

Over 450 ticks gone: S&P 500 Plunges ahead of today's key dataThe S&P 500, in the session reset following the U.S. market close, has begun a sharp downward move, dropping nearly 2% and more than 450 ticks. The decline has been so steep that it wiped out the entire bullish effort from last Friday, June 6th, when it surged strongly from the 5970 level. Today, the most important data point on the agenda is consumer sentiment, which is scheduled to be released at 10:00 AM EST.

S&P 500, the technical battleground for JuneIn our April 15 analysis, we questioned the likelihood of a low point for the S&P 500 index based on technical analysis considerations. The VIX (the implied volatility of the S&P 500) also showed bearish technical characteristics (inverted correlation with the S&P 500), and indeed, the equity market offered a solid rebound against a backdrop of trade diplomacy.
With elements of technical overheating appearing in the short term, let's review the technical analysis signals to establish a diagnosis of the current situation in the US equity market.
To start with, you can reread our April analyses of the S&P 500 and VIX by clicking on the two images below.
1) Short-term technical overheating, but fundamental uptrend preserved above technical support at 5750/5800 points
The S&P 500 index has developed a bullish V-bottom rally since the beginning of April, and the global equity market even made a new all-time high last week.
The upward movement of the S&P 500 sees an alternation between bullish impulses and short-term consolidations/corrections, and this chart pattern is likely to repeat itself as long as trade diplomacy takes its course and as the market awaits the FED's next monetary policy decision next week. The daily chart suggests short-term technical overheating (small bearish price/momentum divergence, with momentum represented here by the RSI technical indicator). In any case, even if the market needs a breather in the short term, the underlying trend remains bullish above major support at 5700/5800 points, i.e. the bullish gap opened in mid-May and the 200-day moving average.
The chart below shows daily Japanese candlesticks for the S&P 500 future contract
2) In terms of retail investor sentiment, the reservoir of sellers has diminished, but remains well filled
The study of retail investor sentiment is part of contrarian analysis of financial markets, one of the disciplines of technical analysis of financial markets. Although the pool of sellers has shrunk, a significant proportion of retail investors are still doubtful about the recovery. This pessimistic sentiment among retail traders is an indicator that the recovery still has medium-term potential, as market peaks have always taken place amid retail investor euphoria.
3) On the quantitative side, watch out for a technical overbought situation in the short term
On the other hand, caution is called for in the short term, as the percentage of S&P 500 shares above the 50-day moving average (this tool here represents the quantitative side of the market) is approaching its overbought zone, a situation soon to be reversed from that of early April.
4) Institutional investors remain cautious ahead of the FED meeting on Wednesday June 18, while trade agreements are still pending
In conclusion, it is important to bear in mind that next week's fundamental highlight will be the FED's monetary policy decision. The market needs to know whether or not the FED will confirm two rate cuts between now and the end of the year. The FED will also be updating its macro-economic projections, and institutional investors are being cautious in the meantime, as shown by the CFTC's latest Commitment Of Traders report.
DISCLAIMER:
This content is intended for individuals who are familiar with financial markets and instruments and is for information purposes only. The presented idea (including market commentary, market data and observations) is not a work product of any research department of Swissquote or its affiliates. This material is intended to highlight market action and does not constitute investment, legal or tax advice. If you are a retail investor or lack experience in trading complex financial products, it is advisable to seek professional advice from licensed advisor before making any financial decisions.
This content is not intended to manipulate the market or encourage any specific financial behavior.
Swissquote makes no representation or warranty as to the quality, completeness, accuracy, comprehensiveness or non-infringement of such content. The views expressed are those of the consultant and are provided for educational purposes only. Any information provided relating to a product or market should not be construed as recommending an investment strategy or transaction. Past performance is not a guarantee of future results.
Swissquote and its employees and representatives shall in no event be held liable for any damages or losses arising directly or indirectly from decisions made on the basis of this content.
The use of any third-party brands or trademarks is for information only and does not imply endorsement by Swissquote, or that the trademark owner has authorised Swissquote to promote its products or services.
Swissquote is the marketing brand for the activities of Swissquote Bank Ltd (Switzerland) regulated by FINMA, Swissquote Capital Markets Limited regulated by CySEC (Cyprus), Swissquote Bank Europe SA (Luxembourg) regulated by the CSSF, Swissquote Ltd (UK) regulated by the FCA, Swissquote Financial Services (Malta) Ltd regulated by the Malta Financial Services Authority, Swissquote MEA Ltd. (UAE) regulated by the Dubai Financial Services Authority, Swissquote Pte Ltd (Singapore) regulated by the Monetary Authority of Singapore, Swissquote Asia Limited (Hong Kong) licensed by the Hong Kong Securities and Futures Commission (SFC) and Swissquote South Africa (Pty) Ltd supervised by the FSCA.
Products and services of Swissquote are only intended for those permitted to receive them under local law.
All investments carry a degree of risk. The risk of loss in trading or holding financial instruments can be substantial. The value of financial instruments, including but not limited to stocks, bonds, cryptocurrencies, and other assets, can fluctuate both upwards and downwards. There is a significant risk of financial loss when buying, selling, holding, staking, or investing in these instruments. SQBE makes no recommendations regarding any specific investment, transaction, or the use of any particular investment strategy.
CFDs are complex instruments and come with a high risk of losing money rapidly due to leverage. The vast majority of retail client accounts suffer capital losses when trading in CFDs. You should consider whether you understand how CFDs work and whether you can afford to take the high risk of losing your money.
Digital Assets are unregulated in most countries and consumer protection rules may not apply. As highly volatile speculative investments, Digital Assets are not suitable for investors without a high-risk tolerance. Make sure you understand each Digital Asset before you trade.
Cryptocurrencies are not considered legal tender in some jurisdictions and are subject to regulatory uncertainties.
The use of Internet-based systems can involve high risks, including, but not limited to, fraud, cyber-attacks, network and communication failures, as well as identity theft and phishing attacks related to crypto-assets.

MES1! - Pivots are still Intact We remain bullish on ES till the pivots are intact. Any knee-jerk reaction is an opportunity to accumulate.

06/12/25 Trade Journal, and ES_F Stock Market analysisEOD accountability report: +437.50
Sleep: 6.5 hours
Overall health: Good
What was my initial plan?
market pumped heavily due to ppi data so I decided today was another oe of those days where you wait on the sideline for a better move.
1. until major levels are hit.
2. or a signal occur.
**Daily Trade recap based on VX Algo System from (9:30am to 2pm)**
10:57 AM VXAlgo ES X1 Sell Signal
2:00 PM VXAlgo NQ X3 Sell Signal
Next day plan--> Above 6010 = Bullish, Under 5950= Bearish
Video Recaps -->https://www.tradingview.com/u/WallSt007/#published-charts

ID: 2025 - 0136.12.2025
Trade #13 of 2025 executed.
Trade entry at 162 DTE (days to expiration).
Excellent fills this morning, well under mid. Created a GTC working order two days ago and let price come to me. No chasing. There are TONS of external liquidity voids resting below.
Target profit is 5% ROI
Happy Trading!
-kevin

Positive enviromentLooking for a positive close on Friday because the bias is bullish and the recent days shows buyers are buying the break.

06/11/25 Trade Journal, and ES_F Stock Market analysis
EOD accountability report: +1200
Sleep: 7 hours
Overall health: Good
What was my initial plan?
Did not wanted to trade the market today unless we had multiple signals and confirmations because CPI data had already moved the market so much.
Daily Trade recap based on VX Algo System from (9:30am to 2pm)
— 10:00 AM Market Structure flipped bearish on VX Algo X3!
— 10:00 AM VXAlgo NQ X1 Buy Signal,
— 10:30 AM Market Structure flipped bullish on VX Algo X3!
— 11:08 AM VXAlgo ES X1 Sell Signal (double signal)
— 11:48 AM VXAlgo ES X3 Sell Signal
— 12:00 PM Market Structure flipped bearish on VX Algo X3!
— 12:30 PM VXAlgo ES X1 Buy signal (double signal)
— 1:35 PM Market Structure flipped bullish on VX Algo X3!
Next day plan--> Above 6000 = Bullish, Under 5990 = Bearish
Video Recaps -->https://www.tradingview.com/u/WallSt007/#published-charts

ES Futures Play – Long Bias Despite MACD Caution (June 11, 2025)📈 ES Futures Play – Long Bias Despite MACD Caution (June 11, 2025)
Ticker: NYSE:ES | Bias: ✅ Moderately Bullish
Setup Time: Market Open | Confidence: 65%
🔍 AI Model Consensus Breakdown
📍 Price: ~6,027.25
📊 Trend: Above 20-, 50-, and 200-day MAs
📈 RSI: 64.25 – bullish but nearing overbought
📉 MACD: Bearish crossover → possible short-term pullback
📎 Bollinger Band: Price near upper band – may act as resistance
✅ Majority Long Bias (3 of 4 Models Agree)
Grok/xAI, Llama/Meta, Gemini/Google:
• Solid technical structure (higher highs/lows)
• High open interest and positive momentum
• Slight MACD concern, but bullish setup intact
• R:R ≈ 1.5:1 with upside target in 6,100 area
⚠️ Contrarian View – DeepSeek:
• Warns of overextension after a 30-day rally
• Suggests bearish MACD could drive pullback
• Recommends short targeting 5,930
📌 Recommended Trade Setup
🎯 Direction: LONG
📥 Entry: 6,027.25 (at market open)
🛑 Stop Loss: 5,980.00 (below short-term support)
🎯 Take Profit: 6,098.00 (R:R ≈ 1.5:1)
📊 Size: 1 contract
📈 Confidence: 65%
⚠️ Risk Watch
• 📉 MACD crossover = potential short-term weakness
• 🧊 Near upper Bollinger Band = possible resistance
• 💨 Volatility at open can cause whipsaw → manage risk strictly
• 🌐 Monitor news/macro events for any directional shift
📣 Are you taking the NYSE:ES long today or fading it like DeepSeek?
Drop your view ⬇️ | Follow for more AI-powered market setups.

Sellers are hereSeller showed up on the daily chart in the S&P 500. Typically, with this type of structure follow-through to the downside would be expected. However, with the release of PPI on Thursday it presents the possibility of a daytrading inside of Wednesday's daily range.

MES Long - HVN, Gap, FVG, Long trade for MES based on High Volume Node with refined Entry in lower timeframe.
HVN on higher timeframe (daily)
HVN on lower timeframe (m30)
Gap followed by huge FVG
Expected reaction for price to bounce to the upside.
TP2 rather a swing trade exit.
TP1 more of a intraday trade exit.

The Line in the Sand for the entire Post-Liberation Day recoverySince the market traded a double bottom two months ago on the 9th of April, it has rallied over 20% on Trump's backtracking of his foreign policy stance regarding international trade.
Throughout this rally, this trendline has proven to be the only respected structural artifact save for this fixed-range volume profile that serves as the sole area of high liquidity.

S&P500: Within reachThe S&P 500 has edged past the 88.70% retracement and is now trading within our magenta Target Zone (Coordinates: 5,880 points to 6,166 points). This places magenta wave (B) likely near its peak - a move that could soon give way to a sharper decline as part of the anticipated wave (C). At current levels, the setup remains favorable for initiating short positions. To manage risks, a stop just 1% above the upper boundary of the Target Zone is recommended. If the index breaks above resistance at 6,6675 points, however, we would shift to an alternative interpretation: a bullish continuation in the form of the wave alt.(III) in blaue. We currently assign a 40% probability to this scenario. One final note: the minimum technical requirement for wave (B) has already been fulfilled by the entry into the Target Zone. This means wave (C) could begin any time.
Over 190 precises analyses, clear entry points and defined Target Zones - that's what we do.

How to Draw Support & Resistance In TradingViewLearn how to effectively identify, draw, and utilize support and resistance levels in TradingView with this comprehensive step-by-step tutorial. Whether you're a beginner trader or looking to refine your technical analysis skills, this video covers everything you need to know about one of the most fundamental concepts in trading.
What You'll Learn:
Understanding support and resistance: the foundation of technical analysis and price action trading
Step-by-step instructions for drawing horizontal support and resistance lines in TradingView
Creating support and resistance zones for more flexible trading approaches
Practical tips for using TradingView's drawing tools effectively
This tutorial may be helpful for day traders, swing traders, and investors using TradingView who want to improve their chart analysis skills. The techniques covered could help you make more informed entry and exit decisions by understanding where price might find support or encounter resistance.
Visit Optimus Futures to learn more about trading futures with TradingView: optimusfutures.com
Disclaimer:
There is a substantial risk of loss in futures trading. Past performance is not indicative of future results. Please trade only with risk capital. We are not responsible for any third-party links, comments, or content shared on TradingView. Any opinions, links, or messages posted by users on TradingView do not represent our views or recommendations. Please exercise your own judgment and due diligence when engaging with any external content or user commentary.
This video represents the opinion of Optimus Futures and is intended for educational purposes only. Chart interpretations are presented solely to illustrate objective technical concepts and should not be viewed as predictive of future market behavior. In our opinion, charts are analytical tools—not forecasting instruments. Market conditions are constantly evolving, and all trading decisions should be made independently, with careful consideration of individual risk tolerance and financial objectives.

Short SP500 SPYI am net short SPY here. I believe we will cut rates and this will be a sell the news. The market approaches overvalued land yet again. This is why stock picking is so important. I believe we range between 5600-6000 for the next two quarters and we resume a very bullish 2026.

Getting readyThe S&P 500 daily chart is getting ready for fundamentals that will come out on Wednesday. In the Asia session were seeing evidence of selling coming in as the market prepares for Wednesday announcements. This selling could be buyers selling to take profits prior to the fundamentals.

06/10/25 Trade Journal, and ES_F Market analysisEOD accountability report: +2575
Sleep: 9 hours
Overall health: Good
What was my initial plan?
I was neutral going into market open, I expected market to pullback a bit if we had lost 6016 but it never truly got lost.
remained neutral and just watched my levels of 6028 and 6045.
**Daily Trade recap based on VX Algo System from (9:30am to 2pm)**
— 9:30 AM Market Structure flipped bearish on VX Algo X3!
— 10:00 AM VXAlgo YM X3 Sell Signal
— 10:58 AM VXAlgo ES X1 Sell Signal
— 11:32 AM VXAlgo ES X3 Sell Signal (triple sell x3) B+ set up
— 12:00 PM Market Structure flipped bearish on VX Algo X3!
1:03 PM VXAlgo ES X1 Sell Signal
— 1:20 PM VXAlgo ES X1 Sell Signal
Next day plan--> Above 6000 = Bullish, Under 5990 = Bearish
Video Recaps -->https://www.tradingview.com/u/WallSt007/#published-charts

Prepare For A Stock Market Crash
S&P 500 E-mini Futures, Daily Chart.
Potential Ending Diagonal.
Nothing serious. Just a Stop-hunt. But Fast & Furious...
......................................................................................................................
We are not registered or licensed in any jurisdiction whatsoever to provide investing advice or anything of an advisory or consultancy nature.
and are therefore are unqualified to give investment recommendations.
Always do your own research and consult with a licensed investment professional before investing.
This communication is never to be used as the basis of making investment decisions, and it is for entertainment purposes only.
