Z eyes on $68.80-69.75: Resistance even the Fib-Blind can SEEZillow has bounced into a major landmark of its lifetime.
Zone is defined by a Golden Covid and a Minor Genesis fib.
This has been tested from both sides many times already.
$ 68.60-69.75 is the exact resistance to watch.
$ 61.82-62.50 is the first support below to hold.
$ 76.18-7./00 is a good fir
−0.000 BRL
−603.79 M BRL
12.05 B BRL
About Zillow Group, Inc.
Sector
Industry
CEO
Jeremy Wacksman
Website
Headquarters
Seattle
Founded
2004
ISIN
BRZ2LLBDR006
FIGI
BBG0123NSYT4
Zillow Group, Inc. engages in the provision of real estate and home-related information marketplaces on mobile and the web. The company was founded by Richard N. Barton and Lloyd D. Frink in December 2004 and is headquartered in Seattle, WA.
Related stocks

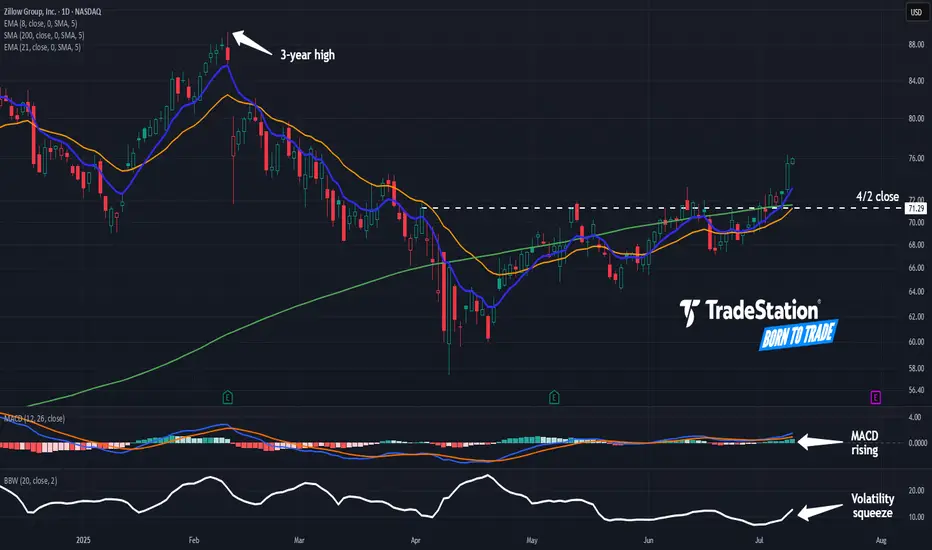
Zillow May Be Coming to LifeZillow has been in a tight range for months, but now it may be coming to life.
The first pattern on today’s chart is the April 2 close of $71.29. Z closed above it last week and is extending the move, which may confirm a breakout.
Second, prices pushed above the rising 200-day simple moving averag
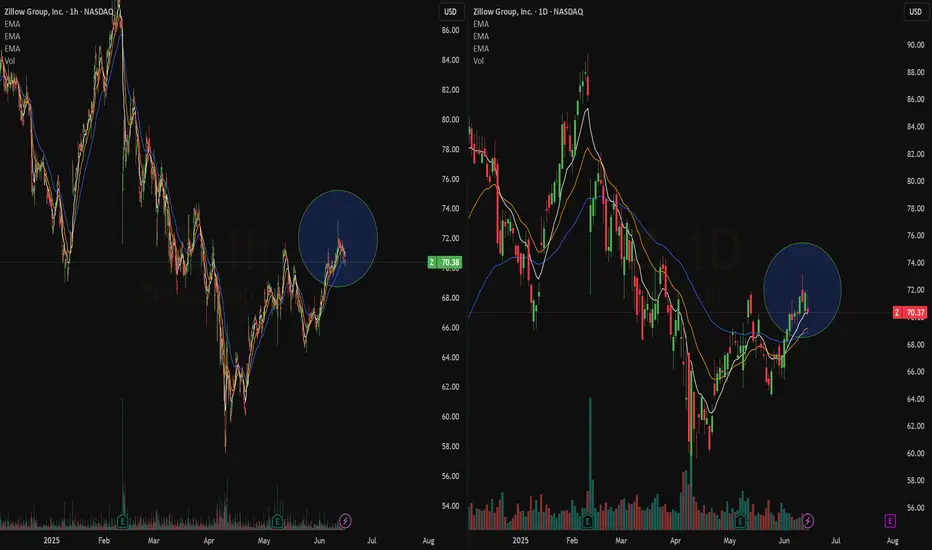
Quick View: $Z- Bullish Crossover on the daily chart, Bullish wave on the hourly chart.
- Some more volume would be good to support a new action to create new highs
What are your thoughts about my Zillow Analysis?I do believe Zillow will touch $98.04 then either push through, consolidate, or reverse. What are your thoughts?

2/11/25 - $z - I don't get it2/11/25 :: VROCKSTAR :: NASDAQ:Z
I don't get it
- 2.5% fcf yield "let's see"
- google search trends keep seeing lower highs, lower lows (trends.google.com)
- it's not like rates are going down... so there's some obvious friction in the system
- and really... 35x 2026 PE for this?
- i applaud the

Z tags $85, pulls back to $75MODs have suggested that I provide more detail about the picks I make.
Sorry. I'm not as verbose as y'all, and I don't like things to be complicated.
My trading plan is very simple.
I buy or sell at top & bottom of parallel channels.
I confirm when price hits Fibonacci levels.
So...
Here's wh

New Setup: ZZ : I have a swing trade setup signal. I'm looking to enter long if the stock can manage to CLOSE above the last candle high(BUY). If triggered, I will then place a stop-loss below (SL) and a price target above it(TP-50%,move SL to breakeven), then using the close below the 10SMA as my trailing stop

Zillow Group, Inc. (Z) AnalysisCompany Overview:
Zillow Group, Inc. NASDAQ:Z is a leading online real estate marketplace, transforming the real estate industry through innovative technology and strategic partnerships. Its platform serves as a bridge between high-intent homebuyers/renters and top-performing agents, fostering an

Z pullback to $65MODs have suggested that I provide more detail about the picks I make.
Sorry. I'm not as verbose as y'all, and I don't like things to be complicated.
My trading plan is very simple.
I buy or sell at top & bottom of parallel channels.
I confirm when price hits Fibonacci levels.
Bonus if a TTM Sq


See all ideas
Summarizing what the indicators are suggesting.
Oscillators
Neutral
SellBuy
Strong sellStrong buy
Strong sellSellNeutralBuyStrong buy
Oscillators
Neutral
SellBuy
Strong sellStrong buy
Strong sellSellNeutralBuyStrong buy
Summary
Neutral
SellBuy
Strong sellStrong buy
Strong sellSellNeutralBuyStrong buy
Summary
Neutral
SellBuy
Strong sellStrong buy
Strong sellSellNeutralBuyStrong buy
Summary
Neutral
SellBuy
Strong sellStrong buy
Strong sellSellNeutralBuyStrong buy
Moving Averages
Neutral
SellBuy
Strong sellStrong buy
Strong sellSellNeutralBuyStrong buy
Moving Averages
Neutral
SellBuy
Strong sellStrong buy
Strong sellSellNeutralBuyStrong buy
Displays a symbol's price movements over previous years to identify recurring trends.