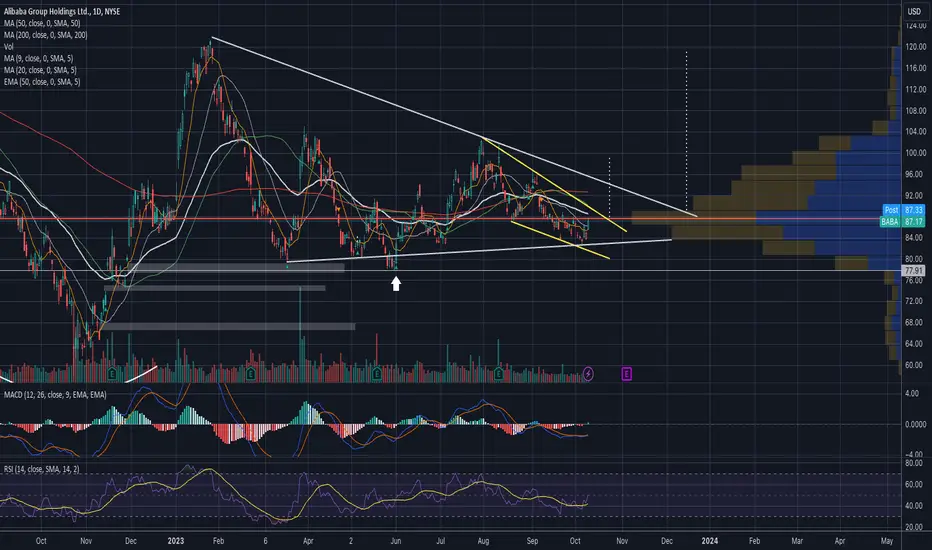
BABA, coming QR give positive outcome?Price was dropped more than 22% from 102.50
ROC showing a good momentum against prce.
It may pullback. But possible for it to form a first HL and swing higher?
When a stock / index has gone up substantially, we must be more care if we decide to get involve in it...
monitor closely and be agile....
we cannot PREDICT what definitely will happen ~ we can only RESPONSE to what we see!
Disclaimer: Mentioned stocks are solely based on own opinions for education and/or discussion purpose only. There's no buy and/or sell recommendation. Trading involve financial risk on your own. The author shall not be responsible for any losses or lost profits resulting from investment decisions based on the use of the information contained herein.
9988/N trade ideas

Alibaba Group Holding (NYSE:BABA) Has More To Do To GrowIn a perfect world, we'd like to see a company investing more capital into its business and ideally the returns earned from that capital are also increasing. If you see this, it typically means it's a company with a great business model and plenty of profitable reinvestment opportunities. Having said that, from a first glance at Alibaba Group Holding (NYSE:BABA) we aren't jumping out of our chairs at how returns are trending, but let's have a deeper look.
Return On Capital Employed (ROCE): What Is It?
Return on Capital Employed = Earnings Before Interest and Tax (EBIT) ÷ (Total Assets -
Current Liabilities) 0.09 = CN¥126b ÷ (CN¥1.8t - CN¥380b) (Based on the trailing twelve months to June 2023).
Thus, Alibaba Group Holding has an ROCE of 9.0%. On its own, that's a low figure but it's
around the 10% average generated by the Multiline Retail industry.
What The Trend Of ROCE Can Tell Us
There are better returns on capital out there than what we're seeing at Alibaba Group
Holding. Over the past five years, ROCE has remained relatively flat at around 9.0% and the
business has deployed 121% more capital into its operations. This poor ROCE doesn't inspire
confidence right now, and with the increase in capital employed, it's evident that the
business isn't deploying the funds into high return investments.
Long story short, while Alibaba Group Holding has been reinvesting its capital, the returns
that it's generating haven't increased. Since the stock has declined 44% over the last five
years, investors may not be too optimistic on this trend improving either. In any case, the
stock doesn't have these traits of a multi-bagger discussed above, so if that's what you're
looking for, we think you'd have more luck elsewhere.

Gigantic bullish divergence on the Alibaba chartAs you can see the angle of the divergence (the red trendlines) is very steep both ways, which means there is high volatility in this stock. I would not be buying here at this level unless it breaks the 100$ level and manages to hold it as support. It is almost overbought on the 4h00 so it would make sense for it to take a breather before trying to break the 100$ level which recently became resistance.
I will be buying shares of Alibaba upon bullish retest of the top channel at around 83-86$ (the yellow circle). First TP at 100$ and second one at 125$ and then 160-162$ for the gap fill.
To give a little extra perspective on why I'm taking this trade:
The Hang seng index (HSI) is also sitting close to very long term support trend line right now. China isn't going to let their tech sector crash and lose the long term support trend line as we saw a couple of months ago. As soon as that came close to happening during what seems like capitulation selling volume (on march 16th) the CCP started talking about easing regulations and then index moved from 18k to 22k almost instantly. So yeah, just like the FED, the CCP can decide to help the markets when they see key levels being breached. They understand the importance of economic growth and capital inflows.
For longer term swing trades I would look at the 200$ or 215$ levels to take some profits as well.
Good luck with your trades guys

$BABA - showing potentialNYSE:BABA Alibaba is once again showing potential. It is trading within a descending wedge and currently challenging the Point of Control (POC) resistance area.
Both the MACD and RSI are curling up, indicating the development of bullish momentum that might result in a change in the trend.
If it can break above the $89 level, there's potential for further upside.
Upside targets:
$96
$102
$120
Downside risk:
$84
ALIBABA: 1W Bullish Cross leading it to 220. Cycle repeating.Alibaba is neutral on the 1W timeframe (RSI = 46.095, MACD = -1.100, ADX = 22.119) but with the RSI on HL since March 2022. Having crossed already over the 1W MA50 and being on the verge of the first 1W MA50-100 Bullish Cross since April 2019 (and the third ever), this bullish divergence is exactly what has historically formed before BABA's two prior bottoms. The 1W MA50-100 Bullish Cross has been the buy entry signal.
It is evident that all bottom patterns are identical in the form of a Triangle. The target from top-to-bottom has been the 1.786 Fibonacci extension. That is our long term target (TP = 220.00).
Prior idea:
## If you like our free content follow our profile to get more daily ideas. ##
## Comments and likes are greatly appreciated. ##

BABA - When politics interfere...As of last week I had 2 positions in BABA, short term I owned shares, long term I bought January Calls... On the list rip up I closed my short term positions with a tiny loss, you can call it break even. But on my calls I am still bullish. I have better stocks to day trade short term without overnight risk of wars, politics and other bullshit. I am trading TQQQ and SQQQ, however, I still see in my chart a huge potential in BABA, so I allocated a small protion of capital for potential very high return x10 at least..... I was not expecting BABA to be so boring. So, I am done commenting/sharing BABA... it just does not pay to stay within 3-4 range - waste of time. When larger time frame signal develops, I will share.

Alibaba Express E-Commerce Resurgence Sparks Bullish EnthusiasmAlibaba Express Surging in Bullish Glory
Alibaba Express (BABA) is on a remarkable bullish run as e-commerce roars back to life. The stock's resurgence can be attributed to robust earnings, strong sales growth, and expanded international reach. Technical indicators like the Relative Strength Index (RSI) and Moving Averages are firmly in the bullish zone, affirming investor optimism. With the global shift toward online shopping and Alibaba's strategic positioning, BABA is well-poised for further gains, igniting enthusiasm among investors tracking this bullish trend.

Unveiling Alibaba's Secrets: A Technical Analysis of Its Future NYSE:BABA
Based on the weekly ElliotWaves analysis , BABA is currently in a corrective wave structure. The corrective wave structure is a complex wave pattern that can take many different forms. However, the most common corrective wave structure is a three-wave ABC pattern.
BABA appears to be in the wave B of the corrective wave structure. Wave B is a retracement of wave A.
We can expect to see BABA continue to move higher in the coming weeks . However, it is important to note that wave B retracements can be sharp and volatile, so we may have a final push on the downside, before the long-term uptrend begins.
Therefore, it is important to be cautious when trading BABA during the wave B retracement and a stronger price confirmation is needed.
BABA's RSI is currently at approx. 50, which is neutral territory. This suggests that BABA is neither overbought nor oversold. However, the RSI is trending higher, which suggests that BABA is likely to continue to move higher in the coming weeks.
BABA's MACD is currently above its signal line, which is a bullish signal. This suggests that BABA is likely to continue to move higher in the coming weeks.
Potential Direction of BABA on a Weekly Timeframe
Based on the ElliotWaves, RSI, MACD, and other technical tactics, BABA is likely to continue to move higher in the coming weeks. However, it is important to note that the market is unpredictable and there is always the possibility of a trend reversal. Therefore, it is important to be cautious when trading BABA and to use a stop-loss order to protect your profits.
I hope this post is helpful.
This analysis represents is based on the information at the date it is posted.
This analysis does not represent professional and/or financial advice.
You alone assume the sole responsibility of evaluating the merits and risks associated with the use of any information or other content found on this profile before making any decisions based on such information.
Any feedback is encouraged and appreciated. Thank you and have a nice day!

BABA AnalysisPrice is on a consolidation right now, with intermediate trend being bearish. Right now, if price breaks 82.64, we should see price going lower back to mitigate the bullish OB at 78.85. If price breaks 87.95, we should see price going higher to fill the FVG at 92.95.

BABA set upBullish idea or 3/C play on baba incoming.
The whole drop from all time high is looking impulsive , meaning that this could be a corrective zig zag play incoming. And that the ultimate bottom might not be in.
The Drop impulse will be in the comment section.
All in all, good set up incoming in my opinion.

BABA Possible head and shoulders!6 months of correction after +100% of Baba stock..
Well, there is a strong resistance at 119-129 which was the last top and nearest strong support 80.
Looking at a bigger frame we clearly see possible an inverted head and shoulders pattern on weekly frame or call it a cup and handle pattern!
It is better to have entry after the full pattern completed to be ensure.
On Elliott waves method, it is about to start the third wave.

$BABA to hit $85 this week, bounce and continue lower to $80Current trend and following the Gann Fan, the stock is continuing a longer trend lower. Options data are showing a massive $85 magnet for this week and eventually it shifts to $80 in October. There is room for a rally end of September, but not long term.

BABA - Fcuk if I know what happened. However!!!If we bounce from the most recent low of this morning, we may still be OK, if not, I am out of this sucker! RIght now Im still ahead on this stock, since I started covereing, as I was buying low and selling high, so if I have to say good bye, so be it!

Alibaba (BABA) -> This After -80%My name is Philip, I am a German swing-trader with 4+ years of trading experience and I only trade stocks , crypto , options and indices 🖥️
I only focus on the higher timeframes because this allows me to massively capitalize on the major market swings and cycles without getting caught up in the short term noise.
This is how you build real long term wealth!
In today's anaylsis I want to take a look at the bigger picture on Alibaba.
For me personally it was quite impressive that Alibaba stock dropped more than 80% after the massive 400% increase from 2015 to 2020.
Recently Alibaba stock retested and already rejected the previous all time low of 2015 and I think that it is just a matter of time until we will see a monthly bullish break of structure.
- - - - - - - - - - - - - - - - - - - -
I know that this is a quite simple trading approach but over the past 4 years I've realized that simplicity and consistency are much more important than any trading strategy.
Keep the long term vision🫡

BABA - ain't going anywhere but up for now...Target is the same, can get there in a day, could be 2-3 but the bottom line is all the same. Lets hope we get to a higher high sooner than later.


BABA - I put in my buy order to re-buyI literally pulled the number out of my ass, but it does seem to be realistic $86.48 I am re-buying if it hits me, if it does not , I will buy at market, Target $92ish for now, but my larger time frame charts flashing a potential for even bigger move all the way into $120s range....
$92 can happen in a day or two, $120 will not happen this fast. Timing is something I have no control over, so anyone following me - don't expect anything to start, and more then that don't expect overnight mirracles! THeoretically it can happen sooner than later, because Smart money front running stocks, but if it does happen, I will not take any credit, saying I knew it was going to happen overnight. Timing is not upto me. This is precicely why options only seem lucrative, in my opinion, bookies can screw you over at any given time, even if you have a pefectly directed trade, time can be an issue.
IT DIDN'T HIT MY LIMIT ORDER, SO I JUST BOUGHT AT 86.88
MIND YOU I SOLD EARLIER THIS MORNING AT 87.82 WHY NOT CASHED OUT $1/SHARE...
THIS IS IT FOR THIS WEEK.

BABA - nice rip overnight! More to come!BABA is moving as expected. followed by a pullback after a nice rip last night, this is expected. ANyone who thinks markets move in straight line are delusional. For now target is unchanged, we may extend target Mon/Tue - market might generate additional signals on larger time frames. I took profit at morning high, expecting a pull back, will definitely rebuy when we tank a little more!

BABA - Im still bullish, big time, first targer $90-92In sophisticated terms it is called Market Mechanics. Just as everything was looking good for UP move (yesterday), market makers threw in another low, and took alot of tight stops out. And now/ Ripping up..... Story fo the market. I am still bullish and see the pattern that warrants my opinion. Patience! I will add to my position when situation warrants, and will post more...

BABA: Sell ideaSell idea on BABA as you see on the chart because we have the breakout with force the vwap indicator by a big red candle with a large red volume.Thanks.

BABA - PATEINCE! Dont be watching the down channel, should go upAs of this writing, patter is still in tact, I will wait for the break of the upper band of this channel and will add more to my bullish position. This isn't an advice, just sharing my strategy.
For now $89-90is my short term target, after we will see. Every avalanche starts with a snowflake, so this could be the reversal which might take us no $120s who knows.

BABA - short term signal BUY!My short term chart shows BUY, first target is 89.50 to 90.00 May not be a big deal, but could be a beginning of a next rally. US stocks are tanking, but China isn't soleley dependent on US markets! I don't relly care for fundamentals, I read charts, for now it's a buy. Frankly I am seirously surprised stock fell so low, but market mechanics is something we have no control over. Im in, this stock is capable of gaping $4-$10 easily overnight... Let's see

