Should you be concerned about falling price of your stocks?Well, the answer depends ! If we take a look at Alibaba shares, we can see that it has reached its 52 week low at 60.25. But Alibaba is more than an e-commerce store with diversified investment in cloud infrastructure, retail, internet and technology.
We all know about the disappearance act of Jack Ma and how he vanished into thin air after the last public speech years ago. Rather than speculate what happened to him, we need to understand he has long relinquish his controlling position in Alibaba and let the executive directors take charge. It's latest better than expected Q3 results have started once again to whet the appetite of many international investors and fund houses to go LONG on this company. So have I.
On the other hand, if we have to compare, i would say Amazon comes close in terms of its e-commerce part of the business but look at the chart. It is still within the bearish trend and has some time before we see it break out.
There is a saying that buying China stocks is RISKY because you never know what the CCP will do - look at the educational listed companies that plunged more than 90% in share price within the day. Strictly looking at the business part of Alibaba, I believe it has strong financial standing with tons of cash to funds its R&D and also it is usually in the forefront of technology. Not forgetting there lies a possibility of Ant Financials IPO. That could give Alibaba the catalytic boost it needs.
More importantly, if we are not peaceful over short term price volatility and constantly watch the price action, it sends nothing but frustration and anxiety to us. Then, it begs the question of WHY are you buying into this company in the first place ? Is it FOMO ? Is it some hearsay? Did you do your own due diligence ? If yes and the business has not deteriorate in any way, shouldn't the price drop be seen as a good chance to accumulate ?
I have also shared about my thoughts in diversification. Buying solely into one company does carry more risks than a basket of tech stocks like ISHARES TECH or PNQI ETF.
The latter strategy works best for those who have limited capital or recurring capital to top up each month.
Do not look at the stock market as some form of lottery ticket wins and you will be much better in years to come. Of course, this represents my view and it is not to be construed as a buy/sell advice. Please DYODD.
P/s: I am vested in both companies at time of writing.
9988/N trade ideas

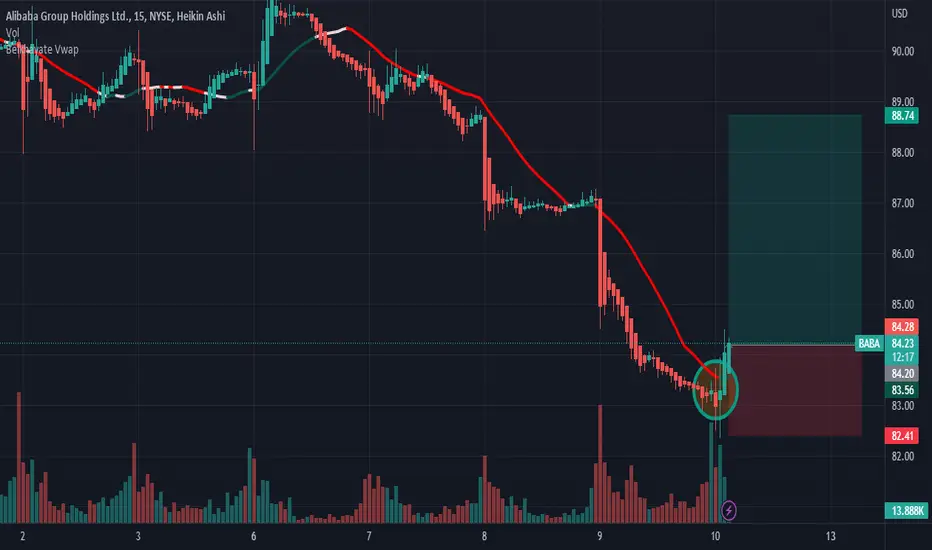
BABA 1. BABA bounced off of Godlen pocket support at 80.1
2. Broke the down trend
3. upside targets 88.03 -->89.35 -->92.9 (d200MA)

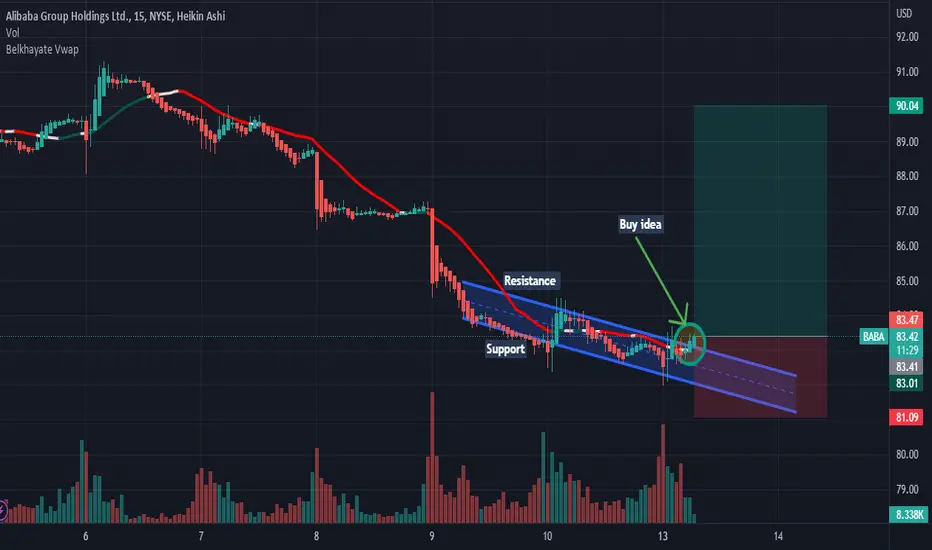
BABA: Buy ideaBuy idea on BABA as you see on the chart because we have the breakout with force the vwap and the resistance line by a big green candle with a large green volume! Thanks!

$BABA - looking interesting for bullish reversal#Baba could be forming inverse head and shoulder after breaking out of descending wedge. If the pattern materialized, the breakout target could be $165.
Target 1 - $99
Target 2 - $125
Target 3 - $165
Risk - Fall to $58
——
Trade is done when it hit one of the target or stop loss is hit.
Disclaimer: Trading note. Not an investment advice.


BABA double bottom on 60 (long)My 1st try in Ideas.
China Zero-COVID + BABA double bottom on 60 and go up to 120 return to 90 and to 130 -> 160

ALIBABA BABA 0.886 calling?One might anticipate this move with a great R:R.
Might be range bound for a while but after a break out its gonna be three digits easy peasy
---
If you like my content, if it helps you gain profit, give it a like!
Thanks!
---
Hold my beer pls
----
No financial advice, do your own research, don't be stupid

Weekly Levels : BABANext Support and Resistance Area for $BABA
Identified on the chart the next possible Support and Resistance, where the price will exit this trading range.

BabaBig trade idea for today. Baba downtrendinf reistance trend has held us down for quite some time. For a short term trade flipping 83.75 into new support could be a good trade idea up to 87.50 which was upper sideways considlation before the leg down to 80s
I’m looking long if we hold 83.75 as support today and confirm it with stops below 82s

BABA AnalysisPrice played out nicely as analyzed last week, giving us a 3.25% move tot he downside. From here, I'm expecting price to continue lower into the bullish POI at 78.85 following the bearish order flow.

BABA | Lets Get It! | LONGAlibaba Group Holding Limited, through its subsidiaries, provides technology infrastructure and marketing reach to help merchants, brands, retailers, and other businesses to engage with their users and customers in the People's Republic of China and internationally. The company operates through seven segments: China Commerce, International Commerce, Local Consumer Services, Cainiao, Cloud, Digital Media and Entertainment, and Innovation Initiatives and Others. It operates Taobao Marketplace, a social commerce platform; Tmall, a third-party online and mobile commerce platform for brands and retailers; Alimama, a monetization platform; 1688.com and Alibaba.com, which are online wholesale marketplaces; AliExpress, a retail marketplace; Lazada, Trendyol, and Daraz that are e-commerce platforms; Freshippo, a self-operated retail chain; and Tmall Global, an import e-commerce platform. The company also operates Taoxianda, an online-offline integration service for FMCG brands and third-party grocery retail partners; Cainiao Network logistic services platform; Ele.me, an on-demand delivery and local services platform; Koubei, a restaurant and local services guide platform; and Fliggy, an online travel platform. In addition, it offers pay-for-performance, in-feed, and display marketing services; and Taobao Ad Network and Exchange, a real-time online bidding marketing exchange. Further, the company provides elastic computing, storage, network, security, database and big data, and IoT services. Additionally, it operates Youku, an online video platform; Alibaba Pictures and other content platforms that provide online videos, films, live events, news feeds, literature, music, and others; Amap, a mobile digital map, navigation, and real-time traffic information app; DingTalk, a business efficiency mobile app; and Tmall Genie smart speaker. The company was incorporated in 1999 and is based in Hangzhou, the People's Republic of China.

BUY UNTIL BABA 96 Baba Coming back to 100
Stay Profitable
do not add to losers
be patience
HAVE A GOOD WEEKEND !!!

BABA LONG ABOVE 87Perfect downtrend channel so far! If it starts breaking out, I'll be going long above 87, no speculation buys yet!

Inverse head n shoulder? Target 160?Its possible to hit 160 in next 6 months. SL 83 on a weekly basis.

HnS BABA setup H&S setup for Alibaba in key zone
Great area to start entering slowly with a lot of great areas to have TPs
Easy invalidation at next shoulder, and if more risk averse under head.
Cheers.

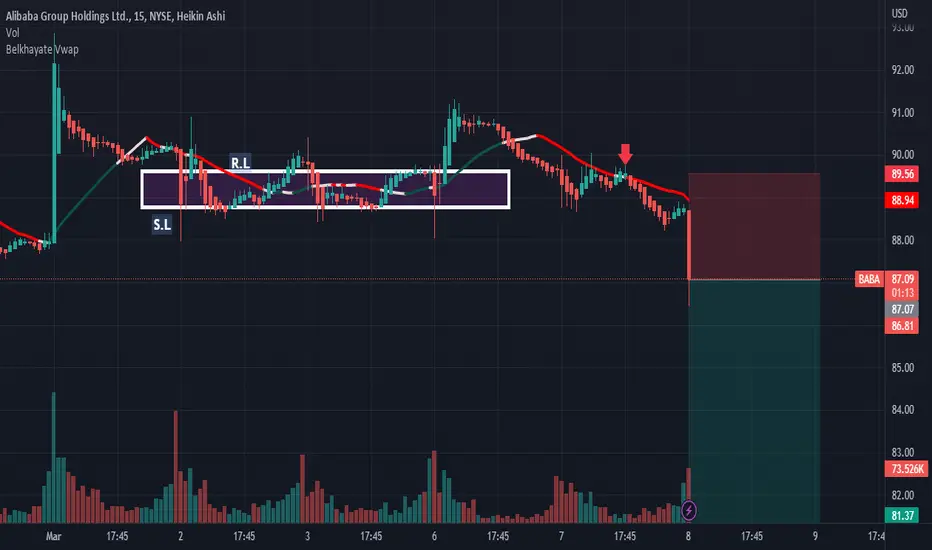
BABA: Buy ideaAs you see on the chart we have the breakout of vwap and resistance so it's mean that we will have a big probability to have an uptrend.Thanks!
Alibaba Trade Plan (March April Challange)In this one we are doing basics, and is basicaly a strategy where we are prepared to a Bearish Breakout that is flagged by a bearish RSI divergence, but we are also prepared for a bullish turn where the price is going to the suport and then the resistance literaly the basic that every trader knows.

BABA AnalysisPrice playing out nicely to what was analyzed last week, giving us a 7.66% move to the downside. I'm expecting price to continue lower following the order flow, into the bullish POI at 78.85.

BABA up trend is comingseem reverse head and shoulder is completing beside breaking trend line and pull-backing to trend line where ichimuko cloud is narrow!!

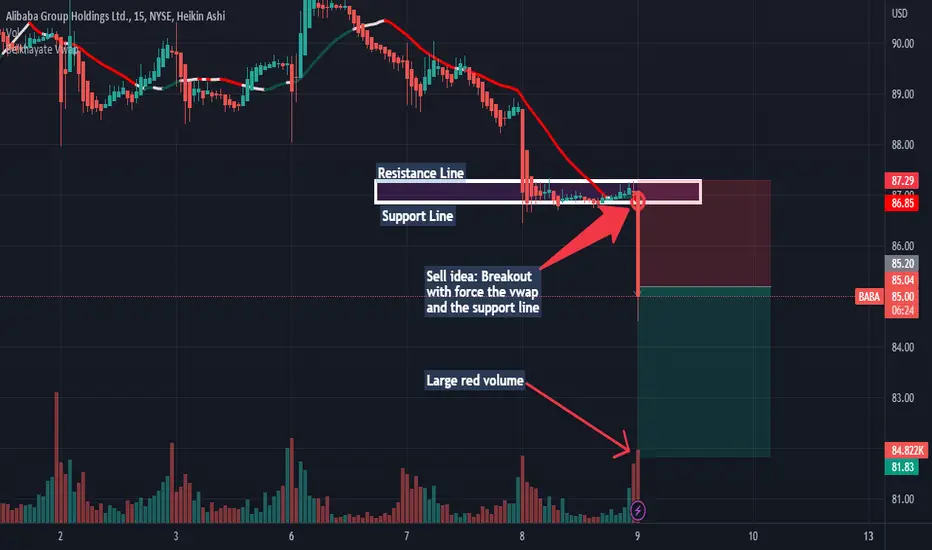
BABA: Sell ideaOn BABA as you see on the chart we have a sell idea because we have the breakout with force the vwap and the support line.Thanks!
ALIBABA - Potential Upward MovementALIBABA sitting on support level and replenishing from demand zone will likely continue its upward trajectory. Exit at 2nd supply zone.