agilent technologiesThis stock is in a strong downtrend. It has risen to test the last supply zone but couldn't break through the descending trendline. Now, it's ready to continue its downward move towards the first target, which is likely to break, but a small bounce from $106.5 to $96.5 could occur. We might take some profits from here after entering, with our bigger target being a sell-off range from $35.5 to $25.5
Sop Loss penetration 157$
A trade ideas

A_1W Agilent Technologieshello
Agilent Technologies stock analysis In the medium and long term time frame The market is forming a rising wave. The main support is the range of 130 and 135 The main target number is 200 and 228 and finally it can increase even up to 259, but for now our target number is 200. The share growth percentage is 40%.

Agilent Technologies | Chart & Forecast SummaryKey Indicators on Trade Set Up in General
1. Push Set Up
2. Range Set up
3. Break & Retest Set Up
Active Sessions on Relevant Range & Elemented Probabilities;
* Asian(Ranging) - London(Upwards) - NYC(Downwards)
* Weekend Crypto Session
# Trend | Time Frame Conductive | Weekly Time Frame
- General Trend
- Measurement on Session
* Support & Resistance
* Trade Area | Focus & Motion Ahead
# Position & Risk Reward | Daily Time Frame
- Measurement on Session
* Retracement | 0.5 & 0.618
* Extension | 0.786 & 1
Conclusion | Trade Plan Execution & Risk Management on Demand;
Overall Consensus | Buy

The Agilent Technologies, Inc wants to continue the correction? NYSE:A Agilent Technologies, Inc. , listed on the New York Stock Exchange, gives the impression that it wants to continue the correction that began in September 2021. Indications that short is the right direction are the gap of May 29, 2024, which was closed on August 22, 2024. An SHS formation and the strong rise from the upper channel resistance are also signs that the correction will continue.

HERE IS YOUR NEXT LONG OPPORTUNITY!NYSE:A (Agilent Technologies Inc.) looks very bullish. After beating their earnings report on August 21st 2024 by 4.85%. That company also beat their previous 3 earnings reports before that.
My first target is 146.54$. Then we should see 155.15$. Since we want to limit risk we placed our stoploss at 138.26$ which gives us a 6.89 risk-to-reward ratio.

Agilent Technologies - Inverse Head and Shoulders on DailyNYSE:A (Agilent Technologies) on the daily timeframe seems to have formed Inverse Head and Shoulders Pattern.
Expecting it to move upwards where we have a gap to fill on the Daily chart.
Potential targets I am expecting 140 and 145
Stop loss for me would be loss of 128 on Daily closing basis
PS: Something to note of, NYSE:A reports Earnings on 22nd Aug as per TV

Agilent Technologies buy with 3 targets: 134.95, 137.01, 140.62Buy trigger activated on A - Agilent Technologies with 3 possible targets: 134.95, 137.01, 140.62.

$A - AGILENTHigher Time Frame (HTF) analysis on the weekly TF. Clear Bearish bias with last leg up not running the previous key swing high, price sharply reversed and has left behind a liquidity void above (could yield higher prices to collect orders in that area), but overall, we appear to have a repeat of bullish turned bearish market sentiment.
Since the ATH, we can see price has retraced -37% before putting in a new LH then sharply returning to break the support below, and has since repeated yielding similar percentage moves. If bias and structure maintain the current bearish sentiment, i would anticipate the 90$ range to be the next area of orders to be ran.
No personal holdings or bias for this stock, i do have close friends that work for the company and hold shares, so ive tried to keep my analysis as unbiased and completely impartial.

Agilent Reports Second-Quarter Fiscal Year 2024 Financial ResultAgilent Technologies Inc. (NYSE: NYSE:A ) reported a revenue of $1.57 billion for the second quarter of fiscal year 2024, down 8.4% reported and 7.4% core compared to the second quarter of 2023. GAAP net income was $308 million, with earnings per share (EPS) of $1.05, up 3% from the second quarter of 2023. Non-GAAP(2) net income was $356 million, with EPS of $1.22, down 4% from the second quarter of 2023. The full-year revenue outlook was revised at $6.420 billion to $6.500 billion, representing a range of down 6.0% to 4.9% on a reported basis and down 5.4% to 4.3% core. Fiscal year 2024 non-GAAP(3) earnings guidance was revised at a range of $5.15 to $5.25 per share.
The company plans to repurchase $0.75 billion of its common stock by the end of the fiscal year, and the board recently authorized a new $2.0 billion share repurchase program. The company's president and CEO, Padraig McDonnell, expressed confidence in the future and excited about the opportunities that lie ahead for Agilent.
In the first quarter of 2024, Agilent (NYSE: NYSE:A ) implemented certain changes to its segment reporting structure, which have no impact on its consolidated financial statements. The Life Sciences and Applied Markets Group reported second-quarter revenue of $754 million, a decline of 14% reported and 13% core year-over-year. The Agilent CrossLab Group (NYSE: NYSE:A ) reported second-quarter revenue of $402 million, an increase of 4% reported and 5% core year-over-year. The Diagnostics and Genomics Group reported second-quarter revenue of $417 million, a decrease of 9% reported and 8% core year-over-year.
The full-year revenue outlook is revised at $6.420 billion to $6.500 billion, representing a range of down 6.0% to 4.9% on a reported basis and down 5.4% to 4.3% core. The outlook for third-quarter revenue is expected in the range of $1.535 billion to $1.575 billion, a decline of 8.2% to 5.8% reported and 6.9% to 4.5% core.
Technical Outlook
Agilent ( NYSE:A ) stock is down 18.36% in pre-market trading on Thursday starting on a rough slate it technically means Agilent stock is in a oversold region forming a downside gap. Gapping occurs in trading when there is no trading activities that occur but a stock is under-performing or outperforming prior to a fundamental.


A - fall -11.59% to $1.22 per share on February 27The last earnings report on October 31 showed earnings per share of $1.38, beating the estimate of $1.35. P/B Ratio (6.618) is normal, around the industry mean (25.768). P/E Ratio (31.511) is within average values for comparable stocks, (78.874). Projected Growth (PEG Ratio) (2.536) is also within normal values, averaging (6.641). Dividend Yield (0.007) settles around the average of (0.019) among similar stocks. P/S Ratio (5.721) is also within normal values, averaging (41.728). With 1.88M shares outstanding, the current market capitalization sits at 38.69B.

Long-term position in Agilent Technologies, Inc $AThis week, I entered into a long-term position in Agilent Technologies, Inc NYSE:A
Timeframe: M
SL: ~$107
Target: $216

Agilent small bull runAgilent has just defined a HL and is now moving towards the next resistance level
This is a simple jump and jump out trade
Entry @ 131-132
Stop loss @ 122
TP @ 140
if it breaks above 140 then as you wish TP

AUDCAD LONG AND SHORT TERM ANALYSIS 1/7/24(Audcad long- and short-term analysis)
I wanted to show you guys my whole thought process through Audcad so you guys can watch how this plays out.
* as traders we cannot predict the market but we can take what its giving us and run with it.

NYSE-A - a good time to buy! (indicator Thewaved)The last signal to buy on this strategy was given September 15.
The price of the asset at the time of entry into the trade was 113.79.
Our goals for this trade are as follows.
Take-Profit is set at 227.6.
and Stop-Loss Order at 96.7 At the moment, the price is moving well in the signal direction, and we we have already had a profit of 1.6%. By the way, this happens quite often after the previous trade is closed by stop, so we opened the position with a good discount. And if we look back, what are we observing then several Long signals in a row - closed by stop-loss order and this gives a great probability of the descending trend reversal. In addition, at the entrance to the purchase, we have already had a great advantage over a huge number of investors. And the most important thing that I want to mention is that the price of the last entrance to the position is higher than the previous exit, and this almost always suggests that there will be a slight price reduction to remove the stop loss orders of other players who has a position at the moment. And such an action can take place several times. And now let's move on to the most important part, statistics.
What do we see from the results The total income on strategy we have 222.87%. The percentage of profitable trades is not so important to us, since the general profit is satisfactory. The profit factor equals 1.801
and this is an excellent result.
And all the closed trades in our strategy are 23.

A Agilent Technologies Options Ahead of EarningsAnalyzing the options chain and the chart patterns of A Agilent Technologies prior to the earnings report this week,
I would consider purchasing the 125usd strike price Puts with
an expiration date of 2023-9-15,
for a premium of approximately $3.45.
If these options prove to be profitable prior to the earnings release, I would sell at least half of them.
Looking forward to read your opinion about it.

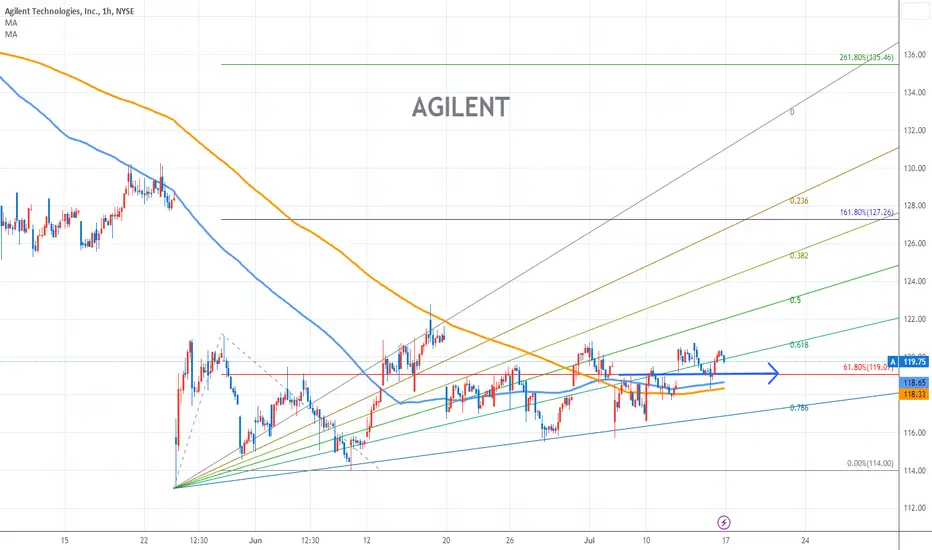
AGILENT Stock Chart Fibonacci Analysis 071623 Trading Idea
1) Find a FIBO slingshot
2) Check FIBO 61.80% level
3) Entry Point > 119/61.80%
Chart time frame : B
A) 15 min(1W-3M)
B) 1 hr(3M-6M)
C) 4 hr(6M-1year)
D) 1 day(1-3years)
Stock progress : A
A) Keep rising over 61.80% resistance
B) 61.80% resistance
C) Hit the bottom
D) Hit the top
Stocks rise as they rise from support and fall from resistance. Our goal is to find a low support point and enter. It can be referred to as buying at the pullback point. The pullback point can be found with a Fibonacci extension of 61.80%. This is a step to find entry level. 1) Find a triangle (Fibonacci Speed Fan Line) that connects the high (resistance) and low (support) points of the stock in progress, where it is continuously expressed as a Slingshot, 2) and create a Fibonacci extension level for the first rising wave from the start point of slingshot pattern.
When the current price goes over 61.80% level , that can be a good entry point, especially if the SMA 100 and 200 curves are gathered together at 61.80%, it is a very good entry point.
As a great help, tradingview provide these Fibonacci speed fan lines and extension levels with ease. So if you use the Fibonacci fan line, the extension level, and the SMA 100/200 curve well, you can find an entry point for the stock market. At least you have to enter at this low point to avoid trading failure, and if you are skilled at entering this low point, with fibonacci6180 technique, your reading skill to chart will be greatly improved.
If you want to do day trading, please set the time frame to 5 minutes or 15 minutes, and you will see many of the low point of rising stocks.
If want to prefer long term range trading, you can set the time frame to 1 hr or 1 day.
AGILENT TECHNOLOGIES still bearish for expect
Hi viewers, A strong bearish in alst periods, currently price on zone, tech. side showing we can expect still bearish trend
TP1:130
TP2:126

RectangleNeutral until broken.
Price is balancing on the support line.
Earnings 2-28 AMC.
SHORT is around 1%

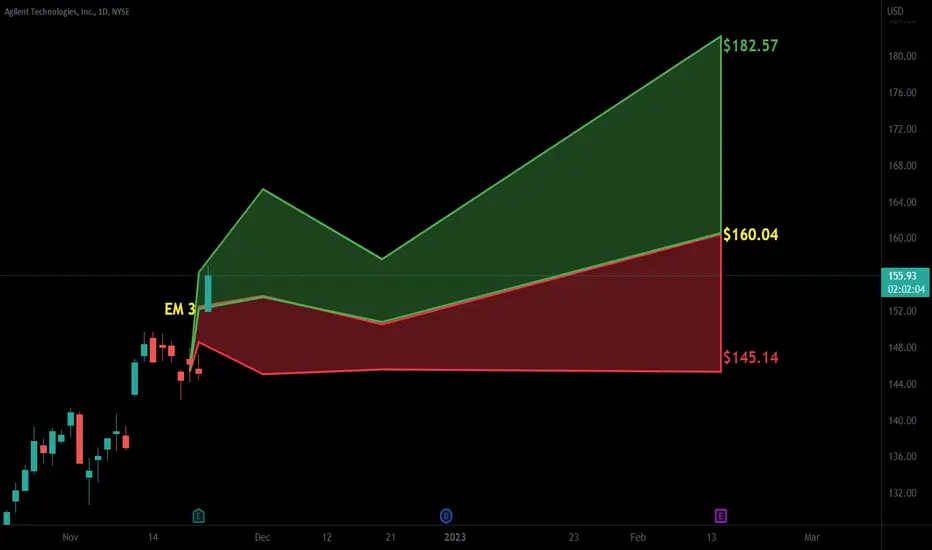
AGILENT TECHNOLOGIES new bullish push expected
Hi viewers, A technically watched here expecting new bullish push in next periods
TP1:162
TP2:166
TP2:170

A(agilent technologies) WEEKLYRULES:
-If price break Point 2, 4, 6, or 8 cancel the setup
-Price needs to break Point 1, 3, 5, or 7 to confirm the setup
When price reach the 100FE(BLUE BOX) it normally does a pullback/retest or reversal
The market can Truncate(fall short)

ABC DEarnings Beat.
ABC Bullish pattern. Today, after the beat, CD is equal to AB. You can use the magnet to move the AB leg and project it up from C.
The Auto-Fib tool on here helps you find C. C will be at the 0 fib level if it is an ABC pattern. The target is D but D can be in several different levels.
In the bearish version, leg AB would be Down.
This pattern reverses when D is met. I am not sure price is at D, so I will watch price/candles, and volume. The overall market movement can also influence targets.
Unfortunately CD does not always equal AB and can be a lesser or greater fib level than 100%. I use the .382, .618 and .786 for smaller fib levels. If this passes the 1 (100%), I use the 1.272 and the 1.618. So this can go higher, but I would be tightening my stop at this point. (Actually I sold it at market open and it may have been too soon)o:
Any pattern can fail, an could d always be on the look out for other patterns. There is a possible W pattern forming in this chart as well.
No recommendation.
If you look inside the ABC portion, there is an M pattern that measures out to be a Bullish Gartley. Leg 2 of the M hit the .618 and leg 4 hit the .786 of the first leg in the M pattern. Peak 2 is lower than peak 1. I did not draw that on here as it was not my focus for this chart. My point being there are often 2 or more patterns going on at once making Technical Analysis a tough sport (o:

$A with a Bullish outlook following its earnings #Stocks The PEAD projected a Bullish outlook for $A after a Positive Under reaction following its earnings release placing the stock in drift A.