20% time to fly againAAL has consolidated very well at these levels, recovering some of the lost value. This correction creates an upward movement with a potential of over 20%, con una cuña expansiva y el precio terminando la estructura.
AAL trade ideas

American Airlines is in an uptrend >>>55-63Price of AAL is rebounded from the strong demand zone and now flying to its attractive supply zone 55-63 $

American Airlines is flying soonAccording to the Elliot Wave Count, there is a possibility that in the next few days, American Airlines will start to increase its price.
This price increase will be around 25% to 30% and the price target is between 19 and 22 dollars.

Ready to collect for long termFollowing weekly. American Airlines break the trendline and got getting confirmation. A nice one to collect for long term.

AAL Looks Good Fore Me To Buy Now As it shown on the chart my Entry price is 17.5
and my stop loss is Closing lower than 17$
the target is 25$
What do you think about NASDAQ:AAL

American Airlines preparing for takeoffBuckle your seat belts ladies and gentlemen...support forming at touch-point 5 along the up-sloping trendline. Primary target at $45 interest. This projection coincides with new airline markets opening, cancellation of first class seats in new ordered planes, and projection of oil rising over the next years--especially leading into elections.

Is America Airlines about to take off?
With a 20% higher than expected earnings today and also raising future expectations...is American Airlines NASDAQ:AAL about to "take off" ? ✈️✈️✈️
EARNINGS RELEASED: Exp 1.59 / Rep 1.92 (20.6% higher than expected)
- Breaking diagonal resistance line
- Price peaking above the 200 week SMA
- Nice to see 200 week SMA slope up now (TBC)
- Ideally OBV to make a new higher high (TBC)
Pre-market coming in lower. Pull back to $17 before continuation would not surprise me. I would enter having established support on the 200 week SMA. I would be waiting here. An eventual rise to over head resistance possible.

Aal must go run Chart is looking good that chart is logarithmic weekly chart my target is between 26-35 in one year


America Airlines (AAL) Starts New Impulse HigherShort term view in AAL (America Airlines) suggests the rally from 5.24.2023 low is ongoing as a 5 waves impulse Elliott Wave structure. Up from 5.24.2023 low, wave ((i)) ended at 16.78 and dips in wave ((ii)) ended at 15.92. Internal subdivision of wave ((ii)) unfolded as a zigzag structure. Down from wave ((i)), wave (a) ended at 16, wave (b) ended at 16.39, and wave (c) lower 15.92. This completed wave ((ii)) in higher degree.
The stock has turned higher in wave ((iii)). Up from wave ((ii)), wave (i) ended at 16.32 and dips in wave (ii) ended at 16.11. The stock resumes higher again in wave (iii). Up from wave (ii), wave i ended at 16.49 and pullback in wave ii ended at 16.27. The stock resumes higher in wave iii towards 17.48 and dips in wave iv ended at 17.12. The stock extends higher in wave v towards 17.98. This completed wave (iii) in higher degree. Pullback in wave (iv) ended at 17.51. Up from wave (iv), wave i ended at 17.94 and pullback in wave ii ended at 17.67. Near term, as far as pivot at 15.92 low stays intact, expect pullback to find support in 3, 7, or 11 swing for further upside.

American Airlines Stock Price Poised to Break Out to New HighAmerican Airlines has broken through a key resistance level of $17.0 and set a new 52-week high on weekly charts. This suggests that the stock has changed its momentum and is poised for further upward movement. NASDAQ:AAL

AAL is stuck on the runwayLook at the larger timeframe, it's going sideways. This flight is not ready to take off yet and has been bouncing around at the key pivot areas charted. Seems like an easy play off the top or bottom.

American Airlines to find support at previuos resistance?American Airlines - 30d expiry - We look to Buy at 15.11 (stop at 14.51)
Broken out of the Head and Shoulders formation to the upside.
Previous resistance at 15 now becomes support.
A higher correction is expected.
We look to buy dips.
Daily signals are bullish.
Our profit targets will be 16.61 and 16.91
Resistance: 16.40 / 16.72 / 17.00
Support: 16.00 / 15.70 / 15.00
Please be advised that the information presented on TradingView is provided to Vantage (‘Vantage Global Limited’, ‘we’) by a third-party provider (‘Signal Centre’). Please be reminded that you are solely responsible for the trading decisions on your account. There is a very high degree of risk involved in trading. Any information and/or content is intended entirely for research, educational and informational purposes only and does not constitute investment or consultation advice or investment strategy. The information is not tailored to the investment needs of any specific person and therefore does not involve a consideration of any of the investment objectives, financial situation or needs of any viewer that may receive it. Kindly also note that past performance is not a reliable indicator of future results. Actual results may differ materially from those anticipated in forward-looking or past performance statements. We assume no liability as to the accuracy or completeness of any of the information and/or content provided herein and the Company cannot be held responsible for any omission, mistake nor for any loss or damage including without limitation to any loss of profit which may arise from reliance on any information supplied by Signal Centre.

Potential Spread TadePotential Pairs Trade setup:
Long: 100 shares of AAL
Short: 272 shares of JOBY
Target would be 1-2$ of the spread

Discounted GrowthRev Growth YoY and FWD are 50 and 23% respectively and 307 and 167% above the sector respectively while PE GAAP TTM and FWD are 71 and 65% below sector! This implies a huge discount in growth.
Gross Profit does lag behind the sector by about 12%, but the valuation combined with the outsized growth substantially off-sets this disparity.
On a technical note, there is an intermediary "W" pattern. Confirmation of this pattern would be realized once the SP closes above the midpoint peak of @25.75 along w/ substantial volume, 3 day rule, etc. Pattern and targets are also correlated with Fibonacci retracement levels and Fib Time series.

Bearish Cypher D leg Rejection short set up Bearish Cypher. Monitoring the 4hr chart, we had a bearish cypher retest back to (B) leg. It then retrace back up to D leg where it sold off, from the initial sell off it retrace back to D leg again. Here is where i'm considering a short position. The 4hr chart is showing oversold rsi above the cloud. Price Action would have to gap above D leg, and if you notice Currently X leg is acting as resistances. No position, waiting for confirmation from price action

AAL - Like An Eagle 🦅Hello TradingView Family / Fellow Traders. This is Richard, also known as theSignalyst.
on MONTHLY: Left Chart
After rejecting the 26.0 resistance zone, AAL has been overall bearish.
However, AAL is now sitting around a strong support zone and round number 10.0
on WEEKLY: Right Chart
For the bulls to take over, we need a break above the last major high in gray.
Meanwhile, until the buy is activated, AAL can still trade lower inside the 10 - 12 support zone where we will be looking for short-term buy setups on lower timeframes.
📚 Always follow your trading plan regarding entry, risk management, and trade management.
Good luck!
All Strategies Are Good; If Managed Properly!
~Rich

American Airlines in an inverted head and shoulders.American Airlines - 30d expiry - We look to Buy at 13.54 (stop at 12.94)
A bullish reverse Head and Shoulders is forming.
13.36 has been pivotal.
Expect trading to remain mixed and volatile.
Bespoke support is located at 13.50.
We look to buy dips.
Our profit targets will be 15.04 and 15.34
Resistance: 14.30 / 14.76 / 15.00
Support: 14.00 / 13.87 / 13.50
Please be advised that the information presented on TradingView is provided to Vantage (‘Vantage Global Limited’, ‘we’) by a third-party provider (‘Signal Centre’). Please be reminded that you are solely responsible for the trading decisions on your account. There is a very high degree of risk involved in trading. Any information and/or content is intended entirely for research, educational and informational purposes only and does not constitute investment or consultation advice or investment strategy. The information is not tailored to the investment needs of any specific person and therefore does not involve a consideration of any of the investment objectives, financial situation or needs of any viewer that may receive it. Kindly also note that past performance is not a reliable indicator of future results. Actual results may differ materially from those anticipated in forward-looking or past performance statements. We assume no liability as to the accuracy or completeness of any of the information and/or content provided herein and the Company cannot be held responsible for any omission, mistake nor for any loss or damage including without limitation to any loss of profit which may arise from reliance on any information supplied by Signal Centre.

AAL WITH A STRONG ACCUMULATION ZONE AAL is following an accumulation lay off on the bottom which is promising for a nice rally ahead with a bullish breakout confirmation.

Unclear Expectations AAL - A positive earnings report from last quarter was soon clouded by government pressure to now provide support for stranded passengers could put airlines once again in the crosshairs of regulations and high cost of doing business. Looking for a more sideways to bearish outlook for the next few weeks as there shows to be weakening confidence over time in combination with no pressures for changes in their business. Not to say that the changes may pass as there are many things in place already such as travelers insurance that people can buy to protect themselves should there be any troubles in your journey.

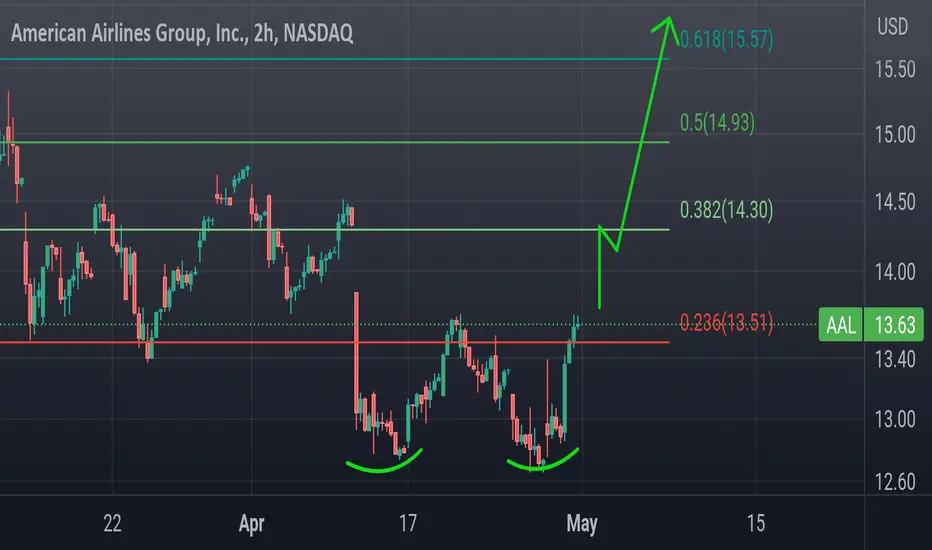
AAL double bottomFirst thing you notice is the weekly hammer print
With a big tick up in Volume
2nd thing is the clear double bottom formed here.
My first target is the 200sma or 14.30..
it's so much resisitance between 14.50- 15.00 that I'd take profit there and wait for a move above 15.00 to get back in long with a 16.00 target
Entry - above 13.70
Stop loss - 13.50
Target - 14.30 gap close.
I like either
5/19
14.5c
Or
5/12
14c
The move should happen early next week
AAL BACK ON WEEKLY SUPPORTFor more updates, please follow my TradingView page, and if you find the content useful, kindly hit the "thumbs up" button to show your support. If you have any queries regarding trading, please feel free to send me a direct message on TradingView. Additionally, please share this content with your friends who may find it beneficial.
Please note that any trading updates provided here are for educational purposes only, and it is always advisable to conduct your own research before making any investment decisions. It is important to ensure that all conditions are met before following any trade plan suggested in this update.

AAL will should breakout lowerAAL should breakout lower. Recession is on the horizon and that is bad for travel business.
There is liquidity under all those previous lows that will need to cleared out in order for the stock rise again. Im looking for bottom at $2.00 near all time low from 2008.
