ABBV Comprehensive analysisChart Analysis:
1. Asset: AbbVie Inc. (ABBV) on NYSE
2. Timeframe: 1-hour chart
3. Date Range: August 2023 to September 2024 (future projection)
Price Action and Trend Analysis:
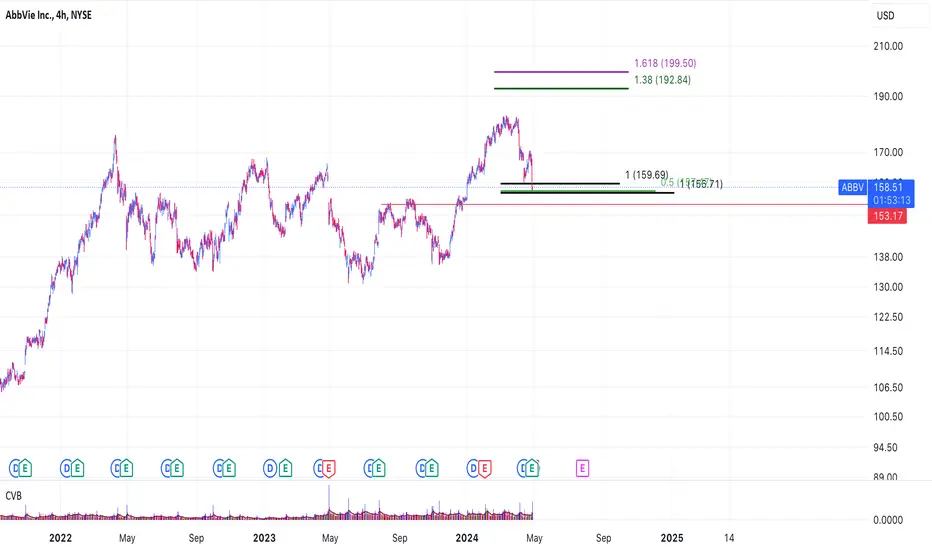
The chart shows a bullish trend from August 2023 to June 2024, with the price rising from around $150 to a peak of about $170. There are several notable features:
1. Strong upward momentum from November 2023 to January 2024.
2. Consolidation phase from January to May 2024.
3. Recent breakout to new highs in June 2024.
Support and Resistance Levels:
- Major support: $155.12
- Minor support: $163.60
- Current resistance/sell point: $170.83
- Previous resistance turned support: $165.21
Volume Analysis:
Without clear volume bars, it's challenging to make a definitive volume-based analysis. However, the presence of multiple long and short positions indicated on the chart suggests active trading periods.
Technical Indicators:
RSI-VWAP Indicator (17, 19, 80) is visible at the bottom of the chart, currently reading 57.20. This indicates:
1. The asset is not overbought or oversold (neutral territory).
2. There's still potential for upward movement before reaching overbought conditions.
Trading Strategy and Projections:
The chart includes a projected trading strategy with the following key points:
1. Current price: $170.83
2. Sell Point identified at the current price level
3. Projected price movement: A decline followed by a period of consolidation
4. Take Profits level: Around $155.12
Risk and Reward Scenario:
- Potential Reward: If the projected decline occurs, there's a potential for a 9.2% return from the current price to the Take Profits level.
- Risk: The asset is at all-time highs, which could lead to continued bullish momentum, invalidating the short-term bearish projection.
Trading Opportunities:
1. Short-term Short Position:
- Entry: Current price ($170.83)
- Stop Loss: Above recent high (e.g., $172.00)
- Take Profit: $155.12
- Risk-Reward Ratio: Approximately 1:3
2. Long-term Long Position:
- Entry: At support level ($163.60 or $155.12)
- Stop Loss: Below the entered support level
- Take Profit: New all-time highs above $171.00
Anomalies and Divergences:
The rapid price increase from May to June 2024 without a clear consolidation phase might indicate potential overextension of the bullish trend.
Conclusion:
ABBV shows a strong overall uptrend but appears to be at a critical juncture. The chart suggests a potential short-term bearish move, followed by consolidation. However, traders should be cautious of the overall bullish trend and the possibility of continued upward movement.
Risk Management:
Always use proper position sizing and stop-loss orders. The volatile nature of this asset, as evidenced by large price swings, necessitates strict risk management.
Note: This analysis is based solely on the technical aspects visible in the provided chart. Fundamental analysis and broader market conditions should also be considered before making any trading decisions.
ABBV trade ideas

ABBV Long IdeaAbbvie has an upside potential with a target to 194 in medium term.
4h timeframe its overbought, if the pullback is slower, it looks a great buy!

ABBV - Increase in Probability of ValuationAlignment and compression of fibo clouds within the 15min to Daily spectrum signal an entry of direction and strength towards the first target.
Proper management with partial achievement of the first target could authorize the search for the second target with reduced risk in the operation.
Follow us if you want to receive new analyses and updates on this and other markets, including cryptocurrencies in different time frames.
You can check out other recent studies by clicking on our profile.
Have a good week!

$ABBV major support NYSE:ABBV coming into some major support here:
A descending TL from ATH that was resistance before
2 year volume shelf starting at 155
200SMA on daily
waiting to see how it reacts
* long above 160 & hold on daily
* not willing to short it
key points:
* Humira sales declining further as more competition mounts
* Other drug sales increase compensating somewhat for the Humira decline

AbbVie Faces Humira Headwinds: Stock Dips 4.76%AbbVie Inc. ( NYSE:ABBV ) struggles with declining sales volumes of its blockbuster arthritis drug, Humira. Despite a positive outlook for its newer immunology treatments, Skyrizi and Rinvoq, concerns over the impact of biosimilar competition and shifting patient preferences have cast a shadow over the pharmaceutical giant's performance, leading to a dip in its stock price.
Humira Volume Erosion Worries Weigh on AbbVie
AbbVie's forecast of a 32% decline in U.S. Humira sales for the second quarter has sent ripples through the market, with investors expressing apprehension over the escalating erosion of the drug's market share. The introduction of biosimilars and changes by U.S. pharmacy benefit managers have contributed to the anticipated decline, prompting AbbVie ( NYSE:ABBV ) to brace for a challenging road ahead.
Navigating the Biosimilar Landscape
Despite the onslaught of biosimilar competition, AbbVie ( NYSE:ABBV ) remains steadfast in its efforts to retain market dominance, emphasizing its ability to retain the majority of the Humira market. However, concerns linger as health insurer Cigna's plans to offer biosimilar alternatives without out-of-pocket payments threaten to further impact Humira's volume, adding to the company's woes.
Focus on Skyrizi and Rinvoq
In light of the Humira sales decline, AbbVie ( NYSE:ABBV ) has intensified its focus on promoting its newer immunology treatments, Skyrizi and Rinvoq, as key drivers of future growth. The company's raised annual profit forecast reflects confidence in the performance of these drugs, which have demonstrated strong sales in the first quarter, surpassing analyst expectations.
Strategic Adjustments Amidst Uncertainty
AbbVie's proactive measures to address the challenges posed by Humira's erosion underscore its commitment to resilience and adaptability in the face of market headwinds. With a revised profit forecast and robust sales performance of Skyrizi and Rinvoq, AbbVie remains poised to weather the storm and emerge stronger, reaffirming its position as a leading player in the pharmaceutical industry.
Conclusion:
AbbVie's outlook amidst the backdrop of Humira volume erosion reflects the dynamic nature of the pharmaceutical landscape, where innovation and adaptability are essential for long-term success. As the company continues to navigate through challenges posed by biosimilar competition and shifting market dynamics, its strategic focus on newer treatments and proactive measures will be critical in shaping its trajectory in the months ahead.

ABBV idea ABBV NEEDS to start holding support now if it wants to continue higher. it is buyable as of now, BUT, if we start breaking the swing high (labeled with a red line) this will be in trouble and could see a drop down to sub $120.
AbbVie Poised to Expand in Neurobiology with Cerevel AcquisitionPharmaceutical giant AbbVie Inc. is considering enhancing its neurobiological portfolio as it finalises the acquisition of neurobiotech firm Cerevel Therapeutics. Initially announced in December 2023 for 8.7 billion USD, the acquisition was primarily focused on Cerevel's experimental schizophrenia drug, Emraclidine. This drug represents a new class of psychiatric medications that have recently sparked increased interest within the pharmaceutical industry.
The deal's prospects have been further boosted by promising clinical trial results from Cerevel's Parkinson's disease drug, reinforcing the strategic fit of this acquisition for AbbVie. The company's broad portfolio diversification, consistent dividend payments, and stable positive cash flow make AbbVie's securities attractive to investors.
Examining the technical analysis of AbbVie Inc. (NYSE: ABBV) for potential investment opportunities:
On the Daily (D1) timeframe, the stock has formed a support level at 161.50 USD and resistance at 170.55 USD. The stock is currently in a downtrend within a channel and is nearing the upper boundary of this trend. A breakout above the downtrend line could lead to a break of the resistance and initiate an uptrend. Conversely, if the stock breaks below the support level, the next target could be 151.50 USD.
For traders, purchasing the stock if it breaks the resistance at 170.55 USD could make sense, with a short-term price target set at 182.10 USD. For those looking at a medium-term investment, holding a long position with a target of up to 195.00 USD can be considered.
—
Ideas and other content presented on this page should not be considered as guidance for trading or an investment advice. RoboMarkets bears no responsibility for trading results based on trading opinions described in these analytical reviews.
The material presented and the information contained herein is for information purposes only and in no way should be considered as the provision of investment advice for the purposes of Investment Firms Law L. 87(I)/2017 of the Republic of Cyprus or any other form of personal advice or recommendation, which relates to certain types of transactions with certain types of financial instruments.
Risk Warning: CFDs are complex instruments and come with a high risk of losing money rapidly due to leverage. 69.88% of retail investor accounts lose money when trading CFDs with this provider. You should consider whether you understand how CFDs work and whether you can afford to take the high risk of losing your money.

ABBV - cautious with this dipNYSE:ABBV is a great company. It's part of my long-term portfolio and is one that I've been able to manage well with technical analysis.
I am not adding unless I see price fall to 155 or until we get to August/September where it hits its seasonal low. This drawdown has risk of continuation for a number of reasons:
Momentum was falling as price was rising. Drawdowns after this type of divergence usually have more challenging recoveries.
The candle body on 4/4 is the spread in price to go against the long term uptrend. These are strong warnings of a reversal.
It lost the YTD AVWAP and is struggling to hold the VWAP anchored to the November low. If this area fails we'll see investors begin to sell to protect profit.
There is a large airgap down to 155., which is the lowest that price can fall while remaining in a primary uptrend.
A fibonacci time zone drawn at momentum crossovers in April 2023 and June 2023 gives a view of an overall price cycle. The next time zone is August 2024, which aligns to a season

$ABBV bull flagABBV looks like it is bull flagging.
Calls for June look good, cover ER with stop on daily close below 176

☀️ABBV BUY☀️Entry Price (173.97) : Chosen based on Fibonacci retracement levels, suggesting a potential point to buy or enter the stock, expecting the price to increase from this level.
Take Profit (179.97) : Set near a Fibonacci extension or resistance level, indicating a target price to sell and secure profits before the stock might pull back.
Stop Loss (171.97) : Established to limit potential losses, placed below a key Fibonacci or support level, indicating where to exit the trade if the price unexpectedly drops.
Current Price (178.88) : The stock is presently above the entry point but hasn't reached the profit target, suggesting the possibility of a minor pullback before moving higher towards the target.
This strategy uses Fibonacci levels to identify strategic entry, exit, and profit-taking points, reflecting anticipated price movements based on historical patterns and market psychology.
☀️ABBV BUY☀️
💲Entry Price : 173.97
💰TP1 : 179.97
🏳️SL : 171.97

ABBV touch the upper zoneLow volume near resistance zone. There could be a break in the next few days

Abbvie Might Be About To Crack All Time HighsHey everyone!
Today we're taking a look at Abbvie, NYSE:ABBV a popular U.S. pharmaceutical stock.
In the chart above, we've combined a momentum view with a support & resistance framework to point out high points and low points of the recent range ABBV has been trading in.
In combination with the momentum indicator, it appears as though the chances of a break of all time highs is likely.
For reference, here's what the chart looks like without the momentum overlay:
For our part, we like the idea of buying this stock into highs, while trailing the daily 3/3 pivot points:
This should provide a solid amount of upside, while limiting risk significantly.
If you like ABBV from a fundamental standpoint, then trailing the larger weekly 10/10 pivots is also an option, down to $135:
That's 50 points of risk, but for a longer term hold it appears probable that a 1:1 kick scenario should pay out nicely.
Good luck out there!
Want more high-quality trade ideas? Follow us below. ⬇️⬇️

ABBV AbbVie Options Ahead of EarningsIf you haven`t bought the dip on ABBV:
Then analyzing the options chain and the chart patterns of ABBV AbbVie prior to the earnings report this week,
I would consider purchasing the 160usd strike price Calls with
an expiration date of 2024-3-15,
for a premium of approximately $7.55.
If these options prove to be profitable prior to the earnings release, I would sell at least half of them.

Abbvie Inc. LongCiao,
pretty distinguishable balance between supply and demand for Abbvie. Looking to trade in the range, stop losses below the potential stop hunt -levels.
Good luck with the shopping!

ABBV Bullish Flag SetupStrong bull flag continuation pattern forming here on ABBV. There's big gap fill potential above supply zone so expect resistance break to get us to 159 quickly. Gains after that should be slower but expecting an $8-9 move above current supply zone based on the height of the flag pole. Please see chart for more details.


ABBV long ideaHi Traders!
Let's take a look at ABBV on the daily timeframe. The price has been forming the descending channel pattern for the last months. The price is at the downsloping resistance line right now. We expect the price to fall from here down to the downsloping support line and bounce up from the strong horizontal support. We would enter long when the price reach the support.
What do you think? Let us know in the comments!

Abbvie Inc. (ABBV): Financial & Competitive AnalysisAbout Abbvie:
Abbvie Inc. (NYSE: ABBV) stands as a prominent player in the pharmaceutical industry, known for its diverse product portfolio and strategic market positioning. This analysis delves into AbbVie's financial health, growth projections, and its competitive landscape.
Financial Highlights:
With a robust revenue of $58.054 billion in 2022 and a consistent increase in gross profit, AbbVie showcases financial strength. The company maintains strong operational cash flows, indicating efficient management.
Growth Projections:
Over the next three years, AbbVie is expected to see a compounded annual growth rate (CAGR) of approximately 6-8%. This projection is based on the company's ongoing product development and market expansion strategies.
Competitive Positioning:
Johnson & Johnson (JNJ): A diversified healthcare giant with a broader range of products.
Pfizer Inc. (PFE): Known for its innovative drugs and recent success in vaccines.
Merck & Co Inc (MRK): Strong in oncology and vaccines.
Eli Lilly and Co (LLY): A leader in diabetes and cancer treatments.
Conclusion:
AbbVie, with its focus on research and development in high-demand therapeutic areas, is well-positioned to compete effectively in the dynamic pharmaceutical industry. The expected growth and strong financials make it an attractive consideration for investors.
Disclaimer:
This analysis is for informational purposes and should not be considered investment advice. Investors should conduct their own research or consult with a financial advisor before making investment decisions.

ABBVIE Short term buy signal.ABBV is on a bearish 1D technical outlook (RSI = 39.987, MACD = -1.990, ADX = 42.078) but is quite possibly forming a short term bottom as the 1D RSI rebounded from an oversold level (under 30.00), while the MACD is close to forming a Bullish Cross. Every time those two conditions were fulfilled simultaneously inside the 1 year Channel Down, the price was a buy. Go long and target a similar LH trendline to early 2023 (TP = 153.00).
## If you like our free content follow our profile to get more daily ideas. ##
## Comments and likes are greatly appreciated. ##

ABBV AbbVie Options Ahead of EarningsIf you haven`t bought the dip on ABBV here:
Then analyzing the options chain and the chart patterns of ABBV AbbVie prior to the earnings report this week,
I would consider purchasing the 147usd strike price Calls with
an expiration date of 2023-11-17,
for a premium of approximately $3.30.
If these options prove to be profitable prior to the earnings release, I would sell at least half of them.
Looking forward to read your opinion about it.

ABBV range 153-146ABBV is taking a nap
Above 153 we can see a bullish sentiment
Below 146 we can see a bearish trend
As I can see, there are more probability of going up
But, what do you think?

ABBV Long Entry We are in a bull flag, appropriate long entry would be at the bottom of the downward channel.

$ABBV: Huge reward to risk long entryNYSE:ABBV offers a very low risk daily trend signal entry, which can evolve into a weekly mean reversion move towards $153.80 by mid September or sooner.
Stop loss area should be a bit below the daily uptrend mode @ 135.35 (where buyers accumulated shares at between June 30th and July 13th), as this level should hold as support and prevent the stock from going much lower if retested.
Daily trend only anticipates a roughly 2 week long uptrend, but over time it might form new trend signals indicating continuation. If your original bottom entry at the reversal here is never stopped you could just let this run till mid September and land a huge reward to risk profit.
Best of luck!
Cheers,
Ivan Labrie.
