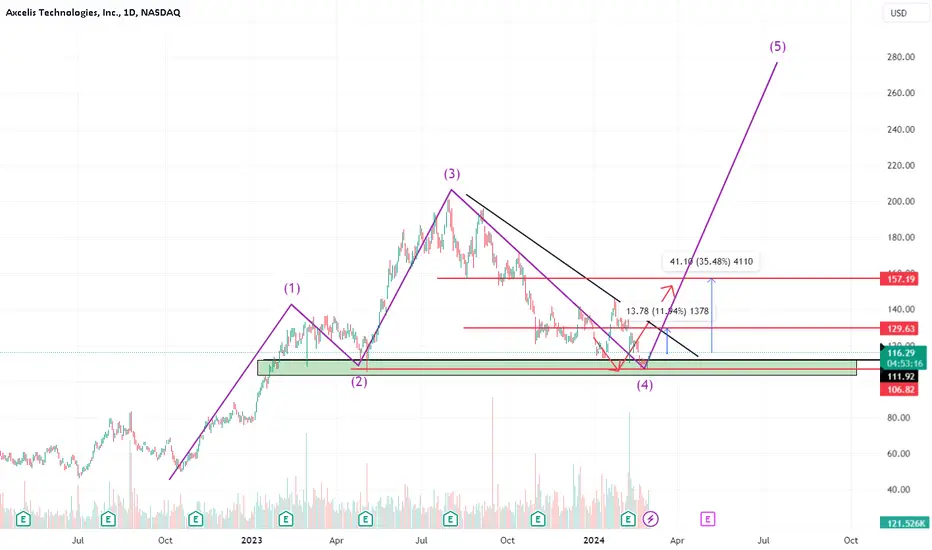
AXCELIS BUY OPPORTUNITY!!Time for its bull cycle to commence. I don't expect this stock to drop any further than this and the current demand level should hold strong
ACLS trade ideas

ACLS - too cheap to ignore20% Revenue CAGR
10% cash flow yield
P/E 10
Semis manufacturers are cyclical and markets front-run it a bit. Think cyclical correction is nearly over

ACLS huge upside potentialWatch that Stock carefully. Seasonality is on our side, too!
Find a good entry soon after break of the little trendline I drew into the chart or any candlestick pattern for buy you like.
Trade savem at your own risk and have fun.
leave a like or comment. Thanks.

Is ACLS a Hidden Gem in the Semiconductor Sell-Off?While the S&P 500, Dow, and Nasdaq are making or nearing all-time highs, many components of the Philadelphia Semiconductor Index (SOX) have been selling off for months. Historically, these levels have been great buying opportunities, but I can’t help wondering if there are issues we don’t know about yet that are already priced in.
I went shopping today and picked up some semiconductor stocks that have been beaten down. First on the list is ACLS. It’s down over 60% from its all-time high of $200 a share back in July 2023 and more than 50% off its 52-week high of $157 set back this July.
What’s interesting here is that this company has a consistent track record of beating earnings expectations for the past 26 quarters!! and its margins have been growing steadily over the last four years. So, the question is: is the stock price signaling some issues we’re not aware of, or is this a great buying opportunity?
I am in at $77.60 small size.

$ACLS, Long, Risk=1/5, TP>25%-35%NASDAQ:ACLS , Long, Risk=1/5, TP>25%-35%
Fundamentally the stock is good.
Choose an entry point and do not forget about a protective order if you are trading with leverage.
Don't risk it if you're not sure.
Good luck to everyone.

Clear path to bullish stance reversal likely, catalyst goodWith reasonable earnings, a better outlook, and crossover indicators, it seems like this is headed back into triple digits. The pattern formed here is resistance, where bulls do not give up without fighting back to some normalcy.

Head and Shoulders correction over?Large correction over from this classic head and shoulders pattern. Now price is trying to put in a bottom, large green volume candle today suggest this could be a great stock to buy if we continue in a risk on market.
Fundamental Analysis:
1. Strong Growth in Semiconductor Equipment Demand: ACLS is well-positioned to capitalize on the increasing global demand for semiconductor manufacturing equipment, particularly in areas like power devices, driven by electric vehicles (EVs), 5G, and renewable energy. This trend supports long-term growth potential.
2. Silicon Carbide (SiC) Opportunity: Axcelis is benefiting from the rising adoption of silicon carbide (SiC) technology, which is critical for high-efficiency power electronics used in electric vehicles, industrial applications, and renewable energy. The company's Purion platform is well-suited for SiC manufacturing, positioning it as a key supplier in this rapidly growing segment.
3. Expanding Margins and Profitability: ACLS has demonstrated strong operational execution, leading to expanding profit margins. With increasing demand for its high-margin Purion ion implantation systems, particularly in niche markets like SiC, ACLS is seeing enhanced profitability, which is expected to drive earnings growth and shareholder value over time.
Add this to your portfolio watchlist, not financial advice.

ACLS - Axcelis Technologies Stock #23-Monthly Chart: We are in a strong support area and have a good bullish rsi signal
Monthly Chart: We are already seeing a rejection at our support level and also have a clear target to the upside.
Long-term trade, where I expect a 50% push.

ACLS potential Buy setupReasons for bullish bias:
- Price gave resistance breakout
- XABCD pattern
- Playing DOW
- No divergence
Here are the recommended trading levels:
Entry Level(CMP): 141.43
Stop Loss Level: 104.54
Take Profit Level 1: 178.32
Take Profit Level 2: Open

Acts momentum break pointAs we can see on the weekly there is a resistance by the 150 ma line. There is also analyst support that the price will go up.(Blue line are the predictions of the analysts)

ACLS Long (Semiconductor) off 61.8 for 50% upside.The chart is perfect. We've pulled back to the 61.8 level and found a base. ACLS is in the semiconductor segment and has experienced a significant pullback. I see this is a very safe entry level.

Nice entry for ACLS - Demand + GP + VAL + divergencesThere is a very nice level to enter the trade on ACLS based on technical analysis on daily timeframe. I am currently waiting if it will bounce from this level or not. If it will bounce then it can be a really nice long.
You can see there some nice levels overlapping
Nice daily demand zones
Fibonacci retracement's golden pocket level
Value area low of this year
Nice divergences forming
Money flow starting to decrease
Also the fundamentals are looking very good for this company.

ACLS - Bottom buy !!!! will be making next wave now ... Buy ACLS and hold it for long term ... expect 100-200% growth in the share
RiskMastery's Red Flag Stocks - ACLS EditionWelcome to RiskMastery's Red Flag Stocks - Stocks with bearish potential.
In this edition, we'll be looking at NASDAQ:ACLS ...
I believe this code is at a point of potential volatility.
If price can hold below $131.29 ... Bearish potential may be unlocked.
My key downside targets include:
- $113.09 (Conservative)
- $93.95 (Medium)
- $78.27 (Aggressive)
If however price breaks above $143.82 ... Bullish potential may be unlocked.
(My key risk targets - C, M,& A - are as noted on the chart)
Enjoy, and I look forward to being of further service into the future.
If you'd like to connect, feel free to reach out and comment below.
Mr RM | Risk Mastery
Disclaimer:
This post is intended for educational purposes only - Publicly available RiskMastery information & content is not intended to be financial advice in any shape or form. Please do your own research and seek advice from a licensed professional before acting on any of the information contained within this post. This post is not a solicitation or recommendation to buy, sell or hold any positions in any financial instrument. All demonstrated trades are merely incidental to the educational training RiskMastery aims to provide. You are solely responsible for your own investment and trading decisions, of which should be made only according to your own opinion, knowledge and experience. You should not rely on any of the information contained on this site or contained in any RiskMastery material on any website or platform. You assume the sole risk of any trade or investment you elect to make. RiskMastery and affiliates shall not be liable to you for any monetary losses or any other damages incurred directly or indirectly, from your use, reliance or reference of RiskMastery materials, content and educational information. Thank you for your understanding and cooperation - We look forward to working with you into the future to navigate the fine line of trading and investment success.


🟩 ACLS - +25% WINI posted the entry on 1st of January.
2 weeks later I am posting an exit to the trade idea
Click below to see the entry post as evidence

🟨 2023 WATCHLIST: ACLS2023 WATCHLIST
A series of stocks that i will be monitoring at the beginning of 2023
Here is a new issue from the Semiconductor Industry.
Relative Strength (IBD): 95
IPO: 2000
Sales acceleration:
Jun-22: 50%
Sep-22: 30%
Funds acceleration:
Jun-22: 499
Sep-22: 496

Selling Idea practicing trading manually using my indicatorThis is for educational or entertainment purposes.

ACLS shortAxcelis Technologies Inc. produces components for the semiconductor industries. I assume the stock price will drop to $56.50.
My trade levels
Entry: $74.34
Take profit: $56.50
Stop loss: $80.32
Risk/reward: 2.98

Head and shoulder on the weekly chartSeveral bearish signs are visible on the weekly chart.
Let's take the Head and Shoulder pattern as our first example.
We are touching its base (52.6) for the third time and did not bounce, meanwhile, the overall market rebounds (a bit).
Second, the support-line (March 2020) broke and acts now as a resistance.
The price even touched it once, and was rejected (31 May, 64.08).
Besides, the RSI indicator is constantly decreasing and is far from oversold.
Taking this information into account, the next support could be either the S1 weekly Pivot (43.23) or the volume shelf (40.12).
However, please note that a bullish divergence is starting to play out.
Bullish divergence is when the price makes a lower low, but a higher high appears on an indicator (MACD).


ACLS - Axcelis TechnologiesWould like a pullback into the 50-day line to get long ACLS.
Just had a beat and raise report and has ran up on huge volume since. The growth estimates are very good and the company operates in what may be the best area of the market, semiconductors.

ACLSif price reach to support area look for buy setup.
Please follow and like the idea for Support and More ideas like this and share your ideas and charts in Comments Section..!!
Thanks for Your Love :)
