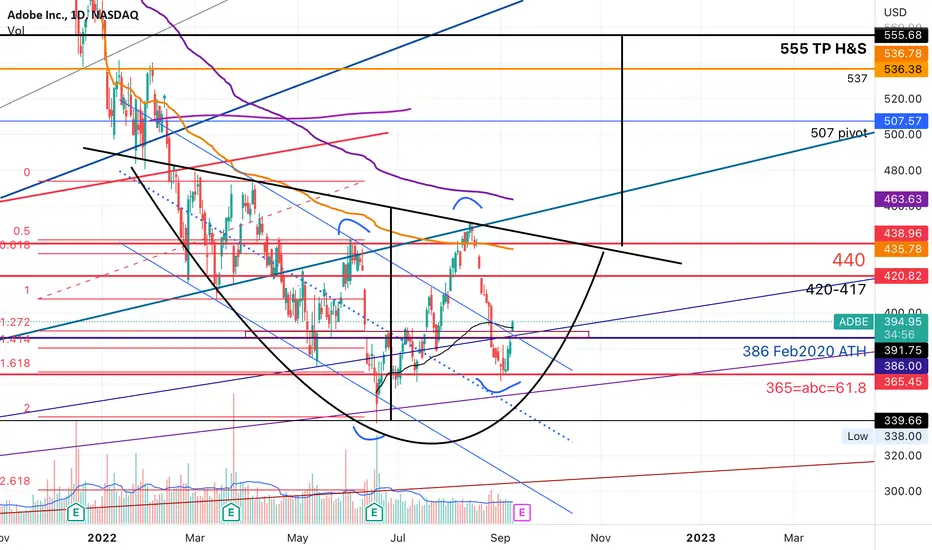
ADBE higher high higher low; Target of Inv H&S id 555ADBE just broke above some resistance lines as shown in the chart. Here I used GANN lines.
It broke above a small resistance zone & the downward channel. If the huge inverse H&S pattern plays out, there
Will be a huge upside with TP at 555.
A fundamental very good company with a lot of moat.
Not trading advice
ADBE trade ideas
ADBE Long term strategy Just an Idea,
Long term Buy zone in Golden Pocket, ... always count subwaves and wait for RSI konvergence at least on 1D TF (best would be 3D-1W Timeframe).
Enjoy the ride.

Feeling Flashy...not really much to say here other than bottoms in and it looks like a good long - could argue some decent fundamentals behind this also.

Adobe zoomed outAdobe took a big hit this week and is now down 58% from all time highs. Looking at this chart I can draw a very long term up trend for this stock and can see things look pretty bearish with price trading below the lower segment of this channel. There is volume support area around the 260 level.

$ADBE (Adobe) Short Setup after earnings & Figma acquisition$ADBE possibly breaking down from a broadening wedge.
Short buy trigger under yesterdays low of $305,00.
Possible targets:
1. $291
2. $255
3. $208

ADBE Can we see a pull back above 335 level todayI have been following the parabola for some time, lets see if it is able to pull back above 335 today to mark critical support at weekly close.

ADBENasty day today but now down at the weekly demand zone from the Covid crash with a potential bullish RSI divergence forming. Not a name I'm looking to rush into but could get a relief bounce over the next few weeks/months if this area holds.

ADBENot financial advice.
The essence of investing & trading is the intelligent and patient preying on the greed, fear, impatience, addiction and ignorance of the majority. It's definitionally Darwinian.

Bottom Fishing/Earnings AMC TodayHoly Cow!
Bad news event and earnings AMC today.
Price is below the band which also indicates an oversold status. Securities can remain oversold or overbought for extended periods of time.
Watching for now, but big drop and is close to a key support level.
Analysts do not seem bullish on an earnings beat for the most part,
No recommendation.
Even dirt can get cheaper but worth putting it on my watch list.

[16 Sep] ADBE plummets on $20 Billion Figma TakeoverA 15% descend for a blue chip ticker like ADBE in a day is, well, simply crazy. Sure, ADBE fell short in their recent earnings report in terms of revenue and their fourth quarter forecast, but the huge gap down was largely driven by ADBE's expensive deal to acquire FIGMA.
Personally, the clear victor of the deal was FIGMA. Even with FIGMA's expectations of 2022 revenue to double to $400m, ADBE is essentially paying 50x for what FIGMA is worth now. As of writing, ADBE market capitalisation stands at $173Bn, which means that they are using >10% of their market cap to purchase FIGMA. THAT is a huge bet.
Comparing their P/E to MSFT (albeit not a perfect competitor), ADBE's valuation still looks expensive (36.28) vs MSFT (26.15). While there are more research to be done, there is cause to believe that the short term outlook for ADBE will remain bearish. However, based on the technical assessment there are no swing setups for me yet. ADBE will remain in my watchlist for a potential short setup, awaiting a potential consolidation/retracement to determine new support and resistance levels before deciding if the risk to reward in this case is favourable.

Disastrous purchase20B dollars for THIS? In the current economic climate? Well, Adobe is already losing users and the competition is only increasing, so I guess it was only a matter of time. The company's future earnings reports will confirm this. Technical analysis also indicates a strong decline, very similar to the chart of NVIDIA. I already posted one idea and it worked almost perfectly, but due to the latest news, I would be happy to avg. down my short position @ $320-360. I might also buy some puts if the price rises to at least $350. News-Adjusted global targets now $100-150. This is my second biggest short position after NVIDIA.

ADOBE INC - BULLISH SCENARIOA new bullish opportunity comes from Adobe Inc.
Higher lows and higher highs are forming an uptrend price channel with a reasonable risk-reward ratio.
1st resistance is 0.236 Fibo level located in the middle of the channel at $425.
2nd resistance is located at $ 460.
Risk Disclosure: Trading Foreign Exchange (Forex) and Contracts of Difference (CFD's) carries a high level of risk. By registering and signing up, any client affirms their understanding of their own personal accountability for all transactions performed within their account and recognizes the risks associated with trading on such markets and on such sites. Furthermore, one understands that the company carries zero influence over transactions, markets, and trading signals, therefore, cannot be held liable nor guarantee any profits or losses.

ADBE ADD TO WATCHLIST!🔸️Ticker Symbol: ADBE🔸️Timeframe: 4 Hour🔸️Investment Strategy: Long
TECHNICAL ANALYSIS: ADBE on the 4H timeframe is setting up nice to see an increase in value if we can stay in this current trend. Our white line representing money momentum on the bottom dashboard indicator is shifting to the upside and we also have a green middle band illuminated meaning bull market momentum. The final confirmation that I want to be looking out for is a green dot meaning a key ema crossover to the upside which would just give me added confirmation that taking a long position on ADBE could result in some nice gains. Thanks for following!
🔔 Follow for daily stock, crypto and forex technical analysis.
⚠️ Trading is risky and I understand nothing is guaranteed. Proper risk management should be in place at all times to minimize losses. Please consult a financial advisor before trading. All Inclusive Trading LLC is not a financial advisor and may not be held liable for any losses which may occur.

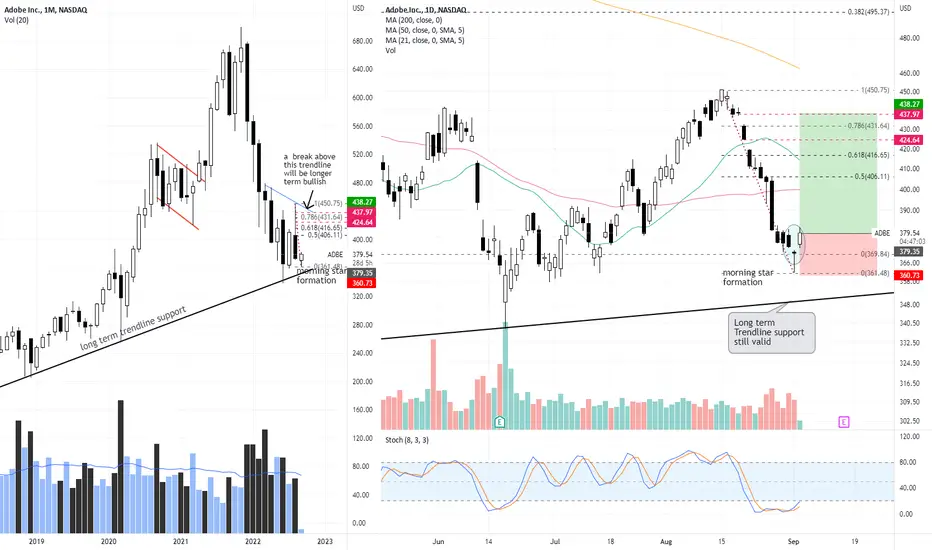
ADBE - Bullish morning starADBE has strong support on a long term trendline (black line on monthly chart) and any test near there would be a lower risk buying opportunity (with stop loss several ticks below this trendline).
The recent pullback brought it back near to the long term trendline support and with the formation of a bullish morning star pattern, one can consider to long now for a short term swing trade. The initial stop loss will be just below the bullish pin bar yesterday. And trailing stops up should trade goes our way.
There is a trendline resistence (blue line on the monthly chart) that should it be able to break above eventually (probably not anytime soon though), wold mean a longer term uptrend is probably underway.
Disclaimer: Just my 2 cents and not a trade advice. Kindly do your own due diligence and trade according to your own risk tolerance and don't forget that money management is important! Take care and Good Luck!
Adobe USA SSI Live Trading Series
Sun Storm Investment Trading Desk & NexGen Wealth Management Service Present's
Focus: Worldwide
By Sun Storm Investment Research & NexGen Wealth Management Service
A Profit & Solutions Strategy & Research
Trading | Investment | Stocks | ETF | Mutual Funds | Crypto | Bonds | Options | Dividend | Futures |
USA | Canada | UK | Germany | France | Italy | Rest of Europe | Mexico | India
Disclaimer: Sun Storm Investment and NexGen are not registered financial advisors, so please do your own research before trading & investing anything. This is information is for only research purposes not for actual trading & investing decision.
#debadipb #profitsolutions

ADBE: TRENDSI ATS CONFIRMATION; ADBE IS TO REACH 415Ticker Symbol: $ADBE
️Timeframe: 4H
️REJECTION OF 200SMA
️Investment Strategy: LONG
TECHNICAL ANALYSIS:
TRENDSI ATS MONEY MOVEMENT SHIFTING UP : BULLISH
LINEAR REGRESSION + TRENDSI: AT THE BOTTOM, WHICH IS AT THE SUPPORT
REJECTION OF 200SMA ON 4HR AND REJECTION OF 50SMA ON DAILY TF
RSI OVERSOLD AND STOCHASTIC SHOWING BULLISH MOVEMENT.
CONFIRMATION I AM WAITING: TRENDSI ATS GREEN LINE WITH GREEN DOT
Follow for daily stock, crypto and forex technical analysis.
Trading is risky, and I understand nothing is guaranteed. Proper risk management should be in place at all times to minimize losses. Please consult a financial advisor before trading. All Inclusive Trading LLC is not a financial advisor and may not be held liable for any losses which may occur.

Adobe goes from bullish to bearishAdobe has emerged from a bullish ascending broadening wedge pattern only to now find itself in a bearish ascending broadening wedge pattern. There is support around to 400 level so watch out for a breakdown below that.

ADBE - Can we see 760-780 by May-July 2022?Adobe corrected a lot from the previous high close to 700. Can it make a new high from here?

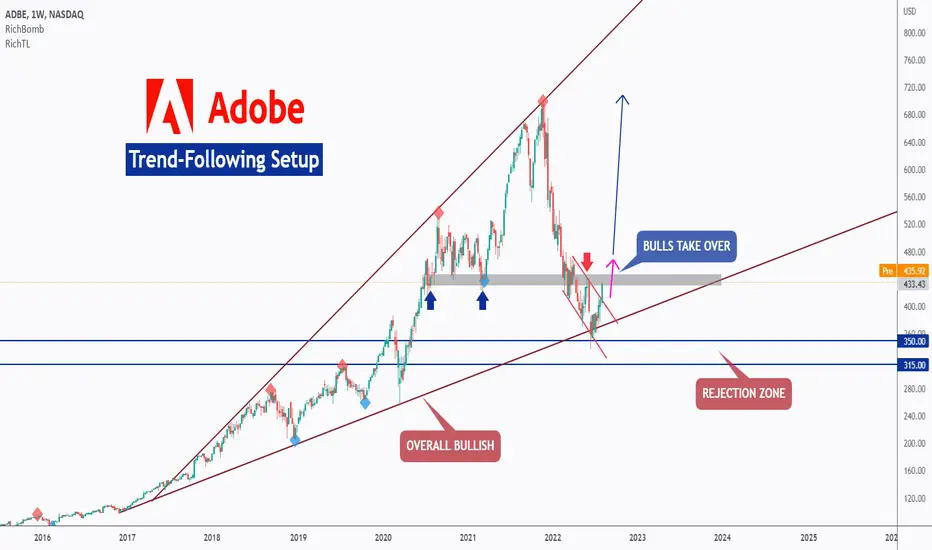
Adobe - Trend-Following Setup!Hello TradingView Family / Fellow Traders. This is Richard, as known as theSignalyst.
ADBE is overall bullish trading inside our brown rising broadening wedge and it is currently sitting around the lower bound so we will be looking for trend-following buy setups.
For the bulls to take over, we need a break above the gray minor support/resistance zone.
Meanwhile, ADBE can still trade lower and dive inside the blue rejection zone.
Always follow your trading plan regarding entry, risk management, and trade management.
Good luck!
All Strategies Are Good; If Managed Properly!
~Rich
My friends question me for saying I am a portfolio manager:Notice where we are coming from, Nigeria if not Greenwich trust limited who happen my registration of who I am as in maumau-trend
Nigeria stock exchange listing index have caused me missing or absence of my relationship with fxpro
My investment with Ecobank Transnational incorporated shares opportunity is given asset allocation and me that owns it they portfolio manager
Not much about us
Thanks.

Adobe Inc. support bounceADBE rejected 88.6% Fibonacci support after the price broke above the resistance trendline. This might be a good entry point for buyers.

ADBE 200 week MA ADBE is right at 200 week MA. Forming a cup and handle on 60min right underneath it. can be a gap fill trade above 415
AUG 5 420C can work

Channel Down // Price is at Top TrendlineIt depends on your bullishness right now whether ADBE has hit bottom.
Price is at the top trendline of the channel.
Targets above channel are targets to the upside.
Below are to the downside.
On weekly this looks like a Bullish Shark which lands at the .886 or the 1.113.
ADBE hit the .786 which would be the .786 OF xc which looks like a Cypher. Support was found very close to this level but the 2nd leg did not pull to the .382 as required by a Cypher pattern.
You would need to look on a weekly chart if you are in to Harmonic patterns. Many are not. I find them to be useful and I am not a wave counter. But I need to learn (o: I just doubt I would use waves anyway as I am an impatient type person but I do like to look at chartists who count waves. I just let them count them. I guess you have to know yourself sometimes.
If we have a few ,more bullish days in the possible bear rally, this may break that top trendline. Anyway, at this point, I would suppose you would go with your gut.
No recommendation.
This channel does not seem to be narrowing (falling wedge) nor does it seem to be broadening (megaphone). When a channel spreads out or narrows as of late there can be a price reaction so beware.
