It's been a bad week for ADI, but that's what makes it tastyLong today after the close at 210.40.
Historically, ADI has been a top 20 performer for my trading system, so a 1 week slump doesn't faze (NOT phase) me a bit. Long term, it has a dazzling track record for what I do, so short term struggles just look like an opportunity for me.
Historically, this particular setup is 359-1 (the one would be a trade from late February that would be down about 12% right now. Including that loser, the median trade in ADI has produced a return of 1.9% and taken 2 trading days. Some of these trades CAN take a very long time. Included in that data are 2 trades that would have taken over 15 YEARS to become profitable after the dot.com crash. But those are EXTREME anomalies. 90% of the trades closed in 3 weeks or less, and 77% closed in one week or less. That covers every trade going all the way back to 1970.
I don't anticipate the signal occurring multiple times before the trade closes, but it does happen occasionally. If it does, I will add to the position. I will generally close the trade at the first profitable close, as long as the profit is > 0.10%.
As always - this is intended as "edutainment" and my perspective on what I am or would be doing, not a recommendation for you to buy or sell. Act accordingly and invest at your own risk. DYOR and only make investments that make good financial sense for you in your current situation.
ADI trade ideas

Chapter 1: The Voltage War Begins — Shadows in the Fab (Long)Beneath the glowing lattice of ultraviolet light and high-frequency static, the war between the Bulls and the Bears raged in silence. The battlefield was not one of mud and blood, but of silicon and plasma—etched into the very wafers of ADI’s semiconductor plant. Here, in the long, white, clean rooms of technological purity, where dust was the enemy and every particle was cataloged, warriors wore static-proof armor and spoke in the language of electrons.
The Bulls had once reigned supreme. Their flag flew high above $236, etched in shining silver atop the upper corridor of the photolithography tower. They danced across copper interconnects, skipping through microvolts and voltage differentials, celebrating a long march of gains. The Bears had been driven deep into the subfloors of the plasma etching chambers, cloaked in shadows and insulated by loss.
But on the 22nd, the Bears struck back.
A catastrophic downturn slashed through the order books like a hot argon laser, slicing through resistance. The Bulls, caught mid-celebration, were flung downward, their progress shattered. The price broke through the crimson barrier of $212 like a wafer under duress—fractured and fragile. Panic rippled through the fabrication halls. The Bears moved in silence, using darkness and inertia as their allies. Hidden within the yellow-lit corridors of the metrology room, they sabotaged optimism with whispers of macroeconomic doom and chip shortages.
Yet all was not lost.
Deep in the logic synthesis vaults, below the active CMOS trenches, a Bull general—codename: Tau—prepared a comeback. His hoofsteps echoed faintly against the white tile floors as he paced beneath the flickering readouts of RSI patterns and liquidity zones. His plan? An ambush at $205. With the support of a returning wave of institutional orders, he would rise from the mid-channel lows and ascend again. The bulls weren’t defeated—they were regrouping.
The volume spike at the lower support trench spoke of silent allies. Dark pools began to churn, liquidity orders whispered in binary—there was movement. Eyes turned toward the ceiling where the sacred $240 ceiling stood like a holy gate, the top white barrier in the upper fab line, unreachable... until now.
But as Tau rallied his Bulls, something stirred in the shadows.
A cloaked figure within the plasma cleaning bay—a rogue AI unit long thought decommissioned—had begun awakening dormant short circuits. A Bear king, long exiled from the core memory zones, was building an empire of decay. Rumors spread that he had tapped into the ancient EEPROM archives, learning how to crash entire resistive bands with just a whisper of fear and sell-side pressure.
The Bulls must rise before the system reboots. The gate at $212 must be reclaimed. Because beyond that threshold lies not just victory—but $240... and the chance to rewrite the firmware of fate.
To be continued... NASDAQ:ADI

No Tech Stock Should Trade at a Higher PE Than Apple or NvidiaWhy No Tech Stock Should Trade at a Higher PE Than Apple or Nvidia — A Case for Shorting Analog Devices (ADI)
No technology company should be trading at a higher price-to-earnings (PE) ratio than industry giants like Nvidia or Apple. That principle applies directly to Analog Devices (ADI), which is currently overvalued relative to its peers.
As long as ADI's price stays below $216, I believe it presents a compelling short opportunity. My short targets are as follows:
- Target 1: $190
- Target 2: $168
- Target 3: $146
These price levels not only offer solid exit points for short positions but also serve as attractive long-term entry points for those looking to hold ADI shares at more reasonable valuations. For traders, these levels can be leveraged effectively through option strategies to maximize risk-reward potential.

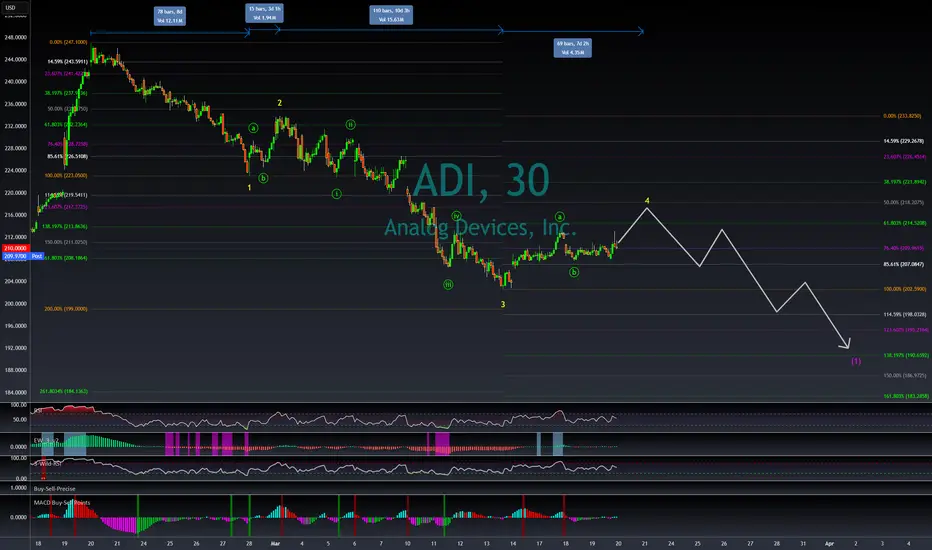
ADI rally slowing already?My overall thesis is we are in the very early stages of a multi-year decline ultimately with the S&P 500 below 3500. I have been wrong many times before so I will just take this thing in stages and see if it plays out. After this massive decline, we should be in for a great market rally of many decades. I am expecting the market to end its recent rally this week. The current rarely would be about a week in length depending when it began for individual stocks. The rally has done a few important things with its slow and prolonged upward movement, mainly prevents a wave 3 signal from occurring during the next decline.
My wave 3 indicator tends to signal wave 3s and 3 of 3s. See my scripts for the specifics of the indicator. If the market had a short wave 4 up and then a sharp or prolonged drop during wave 5, a new wave 3 signal would occur which violates the currently placed Minor wave 3 (yellow 3). Allowing separation from the current wave 3 signal enables wave 5 to drop quick or slow.
This chart applies select movement extensions based on wave 1's movement on the left and then another based on wave 3's movement on the right. I keep the values between 0%-100% on the chart for wave 2s and 4s retracements of the preceding wave's movement for reference even though the retracement values would be inverted.
Specifically for ADI, Minor wave 3 was longer than wave 1, which does not place a maximum length on wave 5. Assuming wave 4 ends on Thursday or Friday, Minor wave 5 could be a week or longer. Wave 4 does not need to gain too much more to meet completion criteria, but the sideways movement of the past few days could place the top below 218. During Minor wave 5, at the very least it should drop below wave 3's bottom of 202.59. Using some basic movement extensions, it will likely go lower. The 5 wave lower pattern for this fifth wave is hypothetical, but a bottom could occur between 186-195. Once we bottom, we should see another rally over a few weeks. I will forecast what that could look like as Intermediate wave 1 nears its end.
Share Price of Analog Devices (ADI) Soars by Approximately 10%Share Price of Analog Devices (ADI) Soars by Approximately 10% in a Day
The S&P 500 Index (US SPX 500 mini on FXOpen) set a new record yesterday, following the release of minutes from the latest Federal Reserve monetary policy meeting. As it became known, committee members would like to see inflation decline further; however, in their view, potential changes in trade and immigration policies could "complicate" the disinflation process.
Analog Devices (ADI) Shares Among Top Gainers
Amid predominantly bullish sentiment in the current US stock market, Analog Devices (ADI) shares surged by approximately 10% in a single day following the release of quarterly results. The company exceeded analysts' expectations on earnings per share by 5.5%, while gross revenue came in 2.68% above forecasts.
According to MarketWatch:
→ Analog Devices has increased its dividend by 8% and expanded its share buyback programme by $10 billion.
→ CEO Vincent Roche stated that "we have moved past the cyclical downturn, and the situation has turned in our favour," giving an optimistic outlook for the second half of 2025.
Technical Analysis of Analog Devices (ADI) Shares
The ADI stock chart shows that the price is forming a long-term upward trend (illustrated by the blue channel), with the following key observations:
→ The ongoing rise suggests a major breakout of the Bull Flag pattern, indicating a resumption of long-term growth following a correction.
→ The psychological level of $200 has shifted from resistance to support—a similar development could occur at the $240 level, where the current all-time high is located.
Analog Devices (ADI) Share Price Forecast
Analysts are mostly optimistic. According to Yahoo Finance:
→ 18 out of 29 surveyed analysts recommend buying ADI shares.
→ The average 12-month price target for ADI shares stands at $257.
Trade on TradingView with FXOpen. Consider opening an account and access over 700 markets with tight spreads from 0.0 pips and low commissions from $1.50 per lot.
This article represents the opinion of the Companies operating under the FXOpen brand only. It is not to be construed as an offer, solicitation, or recommendation with respect to products and services provided by the Companies operating under the FXOpen brand, nor is it to be considered financial advice.

Adidas Moving with Momentum. ADIConverging Elliott triangle and three soldiers on price action. MIDAS line cross plus supportive, upgoing vWAP/US combo is reassuring. BB%PCT flip present, plus simultaneous, recent signal throw off by VZO/EshlersStochRSI combo. All of this paints a high likelihood of continued motion to the upside. We may find resistance at the upper triangle trendlines, or establish it as a support and keep moving further up from there.

Analog Devices, Inc. | Chart & Forecast SummaryRight Here You Can See Analog Devices, Inc. Registered As (ADI) On The New York Stock Exchange, Analog Devices Is An American Multinational Semiconductor Company Specializing In Data Conversion, Signal Processing, And Power Management Technology, Headquartered In Wilmington, Massachusetts
The Following Chart & Forecast Summary On Analog Devices, Inc. Has been Subject On
Key Indicators on A Trade Set Up in General Like A
1. A Push Set Up
2. A Range Set up
3. And A Break & Retest Set Up
Overall Conclusion | Like The Trade Plan Execution & Risk Management on Demand It Tells Us
"Neutral Bias For Now"

ADI234 Trendline breakout possible
237/240/244 initial target ,
if sustain above 244 then 260 can test

Analog Devices, Inc. (ADI) | Chart & Forecast SummaryKey Indicators on Trade Set Up in General
1. Push Set Up
2. Range Set up
3. Break & Retest Set Up
Active Sessions on Relevant Range & Elemented Probabilities;
* Asian(Ranging) - London(Upwards) - NYC(Downwards)
* Weekend Crypto Session
# Trend | Time Frame Conductive | Weekly Time Frame
- General Trend
- Measurement on Session
* Support & Resistance
* Trade Area | Focus & Motion Ahead
# Position & Risk Reward | Daily Time Frame
- Measurement on Session
* Retracement | 0.5 & 0.618
* Extension | 0.786 & 1
Conclusion | Trade Plan Execution & Risk Management on Demand;
Overall Consensus | Buy

ADI All Time HighsOh my, NASDAQ:ADI is just about to trade into all time highs! This one possibly has much more upside as long as the market environment remains strong.

Short term predictionOverall chip stocks been pushed upward extensively and seems not decisive last trading days. Correction and ranging price actions are expected. Lets see what happens!

Analog Devices Surges 10% as it Beat Profit and Sales EstimatesAnalog Devices ( NASDAQ:ADI ), a semiconductor manufacturer, has reported better-than-expected results and guidance as inventory backlogs eased. The company's fiscal second-quarter adjusted earnings per share (EPS) of $1.40 beat estimates, while revenue slumped 34% year-over-year to $2.16 billion, but that was above forecasts. CEO Vincent Roche explained that revenue exceeded the midpoint of its outlook despite continued macro and inventory headwinds. However, he pointed out that inventory rationalization across the broad customer base is stabilizing, clearing a path for the company to return to sequential growth in the third quarter.
Analog Devices ( NASDAQ:ADI ) sees current-quarter adjusted EPS of $1.50, plus or minus $0.10, with revenue of $2.27 billion, plus or minus $100 million. Both midpoints were higher than anticipated.
Analog Devices ( NASDAQ:ADI ) forecasts robust quarterly revenue on chip market recovery, thanks to a rise in demand for its industrial chips after a prolonged slump. The upbeat forecast signals that clients are placing new orders amid signs of an easing economy. The company expects revenue of $2.27 billion, plus or minus $100 million, for the third quarter, compared with estimates of $2.16 billion, according to LSEG data.
Analog Devices ( NASDAQ:ADI ) also touted its artificial intelligence efforts and expects to drive "record revenues" for its chip testing segment in the near to mid-term due to strong demand for high-bandwidth memory chips. The company's results follow a strong forecast from chipmaker Texas Instruments, fanning optimism for a rise in analog chip demand.
Technical Outlook
Analog Devices ( NASDAQ:ADI ) stock is currently overbought with a Relative Strength Index (RSI) of 82. The stock is up 10.87% as of the time of writing and up 18% since the start of 2024.

ADI - 15 months HEAD & SHOULDERS (slope-up) + 5 months RECTANGLE══════════════════════════════
Since 2014, my markets approach is to spot
trading opportunities based solely on the
development of
CLASSICAL CHART PATTERNS
🤝Let’s learn and grow together 🤝
══════════════════════════════
Hello Traders ✌
After a careful consideration I came to the conclusion that:
- it is crucial to be quick in alerting you with all the opportunities I spot and often I don't post a good pattern because I don't have the opportunity to write down a proper didactical comment;
- since my parameters to identify a Classical Pattern and its scenario are very well defined, many of my comments were and would be redundant;
- the information that I think is important is very simple and can easily be understood just by looking at charts;
For these reasons and hoping to give you a better help, I decided to write comments only when something very specific or interesting shows up, otherwise all the information is shown on the chart.
Thank you all for your support
🔎🔎🔎 ALWAYS REMEMBER
"A pattern IS NOT a Pattern until the breakout is completed. Before that moment it is just a bunch of colorful candlesticks on a chart of your watchlist"
═════════════════════════════
⚠ DISCLAIMER ⚠
The content is The Art Of Charting's personal opinion and it is posted purely for educational purpose and therefore it must not be taken as a direct or indirect investing recommendations or advices. Any action taken upon these information is at your own risk.

ADI TRADING IDEASAnalog Devices, Inc. designs, manufactures, tests, and markets integrated circuits (ICs), software, and subsystems products in the United States, rest of North and South America, Europe, Japan, China, and rest of Asia. The company provides data converter products, which translate real-world analog signals into digital data, as well as translates digital data into analog signals; power management and reference products for power conversion, driver monitoring, sequencing, and energy management applications in the automotive, communications, industrial, and consumer markets; and power ICs that include performance, integration, and software design simulation tools for accurate power supply designs.

220 Next Price Target for me on ADIJust analyzing. Caught this bad boy around 201, looking for 220. Likely before mid may. ALL IMO

ADI Analog Devices Options Ahead of EarningsAnalyzing the options chain and the chart patterns of ADI Analog Devices prior to the earnings report this week,
I would consider purchasing the 195usd strike price Calls with
an expiration date of 2024-3-15,
for a premium of approximately $3.50.
If these options prove to be profitable prior to the earnings release, I would sell at least half of them.

ADI: Possible Buy AreaQuite perfect entry for another long would be on the marked gap. Final target around 226 USD.

Breakout from consolidation.I’m just waiting for the stock exchange to open to check the possibility of entering on the breakout of consolidation.
The worst part is that the market can open with a gap. Then my scenario will be cancelled.

ADI: 1h TechnicalsCurrently trading in a clear downward channel, breakout above is expected if we hold longer term trend line.

Analog Devices Inc LONGADI long position.
Market get to a lower Lin Reg and below MACD on H4.
Confirmation on H1 and M15 !!! - BUT.... I STILL DON'T LIKE THE RISK/REWARD RATIO!!
Small position on buy - I said small!!!
Suggested TP: Tp1 at $189.30(close 50% of the position) and 2nd at $194.55(green arrows).
or Main TP at level $192.61(blue arrow).
Suggested SL: Always follow the Risk/Reward Ratio - min 1:3(that's what I meant!!!! - that's why only small position).
Suggested SL: $167.75(Risk/Reward Ratio 1:1
Warning!!!!
This content should not be interpreted as financial advice.

$ADI with a bullish outlook following its earnings #StocksThe PEAD projected a bullish outlook for NASDAQ:ADI after a negative over reaction following its earnings release placing the stock in drift C with an expected accuracy of 71.43%.

Breakout Watch on Monthly Cup & Handlemonitor for a breakout of the monthly chart. There is a bullish cup and handle set up. This is another Nanotechnology stock. firm primarily produces integrated circuits, power management products, and other microelectromechanical systems (MEMS)

ADI Short Swing Head N Shoulders- Wyckoff Distribution on top edge
Limit order on the previous support of the distribution area
Stop Loss on top of resistance
Take Profit on the other edge
