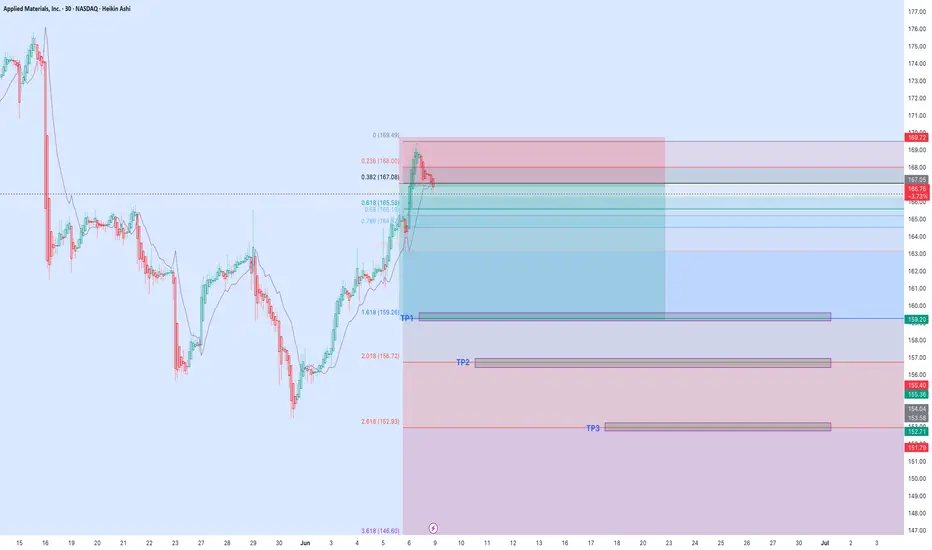
Applied Materials | AMAT | Long at $169.75Republican Ashley Moody recently dropped $200k-$500k on Applied Materials $NASDAQ:AMAT. The semiconductor boom may not be over...
Price-to-earnings: 21.68x (great in comparison to others...)
Debt-to-equity: 0.34x (low)
Cash flow: $10.4 billion (FY2024)
Insiders awarded options recently
Unless NASDAQ:NVDA brings the market down, NASDAQ:AMAT is in a personal buy zone at $169.75. While the price may dip in the near-term to the $140s, bullish until the semi boom dies...
Targets:
$195.00
$215.00
$240.00
AMAT trade ideas

$AMAT, Long, TP>10-15%NASDAQ:AMAT , Long, TP>10-15%
Fundamentally the stock is good.
Choose an entry point and do not forget about a protective order if you are trading with leverage.
Don't risk it if you're not sure.
Good luck to everyone.

AMAT on WatchLooking for a break above $176.50 and retest before entering.
Why:
Broke out of long term channel
Made a strong recovery after shakeout on May 30th
Above all major EMAs on daily and weekly


Correction or continuation of short trendAMAT and other AI stocks made a jump at the end of last week .
This big jump to me was to liquidate the short order and now the wave came to an end with a rejection on 0.236.
Never forget SL
Trade Safe

Quick View: $AMAT
Daily -> Pullback with Bullish EMAs
Hourly-> Still bearish with slow pullback
Watching for a #TopSwing Setup on the Daily Chart
Area of $166 as key resistance.
Support → $153

$AMAT BUY BABY BUY AI BOOM NASDAQ:AMAT – The Pick & Shovel AI Play Nobody’s Talking About
📈 In this video, I break down why Applied Materials ( NASDAQ:AMAT ) is one of the smartest plays in the AI infrastructure race — and why hedge funds are quietly building positions while everyone else chases hype.
🔍 Key Takeaways:
NASDAQ:AMAT makes the machines that MAKE the chips powering AI.
Profitable, undervalued, and essential to every major fab worldwide.
Benefiting directly from the CHIPS Act, global fab expansion, and multi-trillion dollar AI growth.
High margins, strong free cash flow, and consistent buybacks.
A compounder play disguised as an industrial.
🧠 Forget the hype. This is the real AI backbone play — and the market hasn’t fully priced it in yet.
👇 Drop your thoughts in the comments. Are you sleeping on AMAT, or loading up before the crowd?
📺 Watch now and subscribe for more deep-dive plays Wall Street doesn’t want you to notice.
#AMAT #AIStocks #Semiconductors #AppliedMaterials #NVIDIA #TechStocks #TradingViewIdeas #AIInvesting #SmartMoneyMoves

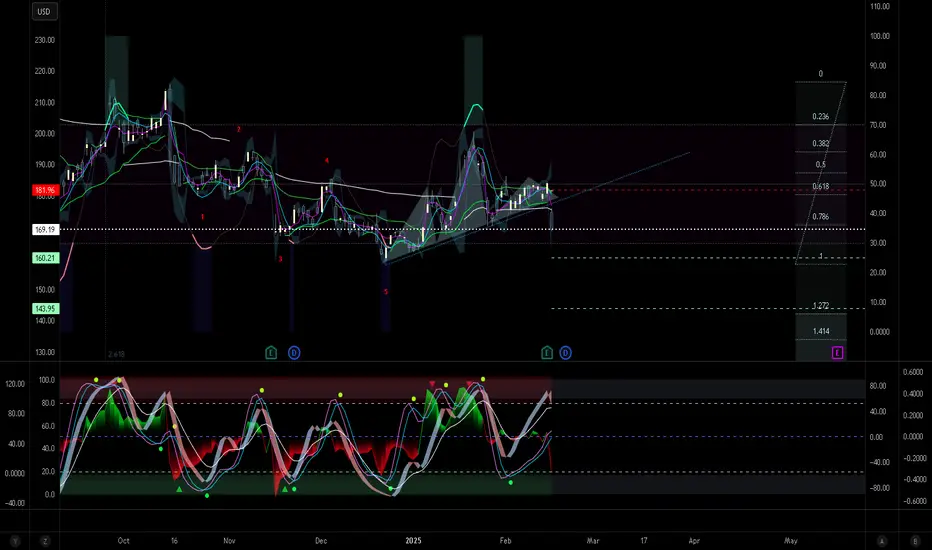
Applied Materials Stock Chart Fibonacci Analysis 050925Trading Idea
1) Find a FIBO slingshot
2) Check FIBO 61.80% level
3) Entry Point > 148/61.80%
Chart time frame: D
A) 15 min(1W-3M)
B) 1 hr(3M-6M)
C) 4 hr(6M-1year)
D) 1 day(1-3years)
Stock progress: A
A) Keep rising over 61.80% resistance
B) 61.80% resistance
C) 61.80% support
D) Hit the bottom
E) Hit the top
Stocks rise as they rise from support and fall from resistance. Our goal is to find a low support point and enter. It can be referred to as buying at the pullback point. The pullback point can be found with a Fibonacci extension of 61.80%. This is a step to find entry level. 1) Find a triangle (Fibonacci Speed Fan Line) that connects the high (resistance) and low (support) points of the stock in progress, where it is continuously expressed as a Slingshot, 2) and create a Fibonacci extension level for the first rising wave from the start point of slingshot pattern.
When the current price goes over 61.80% level , that can be a good entry point, especially if the SMA 100 and 200 curves are gathered together at 61.80%, it is a very good entry point.
As a great help, tradingview provides these Fibonacci speed fan lines and extension levels with ease. So if you use the Fibonacci fan line, the extension level, and the SMA 100/200 curve well, you can find an entry point for the stock market. At least you have to enter at this low point to avoid trading failure, and if you are skilled at entering this low point, with fibonacci6180 technique, your reading skill to chart will be greatly improved.
If you want to do day trading, please set the time frame to 5 minutes or 15 minutes, and you will see many of the low point of rising stocks.
If want to prefer long term range trading, you can set the time frame to 1 hr or 1 day.

AMAT watch $159.46 above 154.74 below: Golden Fibs to BreakAMAT moving somewhat independent of the market.
Currently osculating between two major Golden Fibs.
Golden Genesis at $159.46, Golden Covid at $154.74

Amat droppingExpecting AMAT to drop to orange line
price is weak. testing out new strategy lets see how it goes Phi

Applied Materials (AMAT) Stock Analysis ReportApplied Materials, Inc. (NASDAQ: AMAT) is a global leader in materials engineering solutions for semiconductor manufacturing. The company provides equipment, software, and services to help produce advanced chips used in various high-tech applications, including AI, 5G, and automotive industries. As a key player in the semiconductor equipment sector, AMAT competes with companies like ASML (ASML), KLA Corporation (KLAC), Lam Research (LRCX), Teradyne (TER), and Tokyo Electron.
Financial Performance Analysis
Profitability Metrics
Gross Margin:
47.46% (AMAT) vs. KLAC (61.19%), ASML (49.82%), Teradyne (54.83%)
Operating Margin:
28.95% (AMAT) vs. ASML (31.92%), KLAC (39.03%), Teradyne (19.46%)
AMAT maintains a strong gross margin but lags behind KLAC and ASML. However, its operating margin of 28.95% demonstrates effective cost control and efficient operations.
Return on Equity & Capital Efficiency
Return on Equity (ROE):
40.61% (AMAT) vs. KLAC (87.85%), ASML (48.19%), Teradyne (20.29%)
Cash-to-Debt Ratio: 1.43
While AMAT’s ROE is strong, KLAC significantly outperforms. AMAT’s cash-to-debt ratio of 1.43 suggests a manageable debt level, ensuring financial flexibility.
R&D Investment Efficiency
R&D-to-Revenue Ratio :
11.9% (AMAT) vs. ASML (13.95%), KLAC (13.06%)
A lower R&D-to-revenue ratio indicates AMAT is able to generate high revenue with relatively lower R&D spending, signaling operational efficiency and competitive advantages in innovation management. While ASML and KLAC invest more heavily, AMAT’s ability to maintain growth with a lower R&D ratio demonstrates strong execution.
Cash Flow
Free Cash Flow Margin : 27.55%
With a free cash flow margin of 27.55%, AMAT generates solid cash, supporting dividends and buybacks.
Industry Outlook & Growth Potential
The semiconductor industry is poised for strong growth due to increasing demand for AI chips, high-performance computing, and electric vehicles. However, the U.S. government’s new tariffs on Chinese semiconductor-related imports may impact AMAT’s global sales, particularly if China retaliates.
Despite this, AMAT remains well-positioned due to:
Its strong presence in leading-edge chip manufacturing.
Expansion in AI-related semiconductor production.
High free cash flow generation, allowing for reinvestment and shareholder returns.
Risks & Challenges
Impact of U.S.-China Trade Tensions
New U.S. tariffs on semiconductor equipment could reduce AMAT’s revenue from Chinese customers. If China restricts access to key materials, AMAT may face supply chain disruptions.
Competitive Pressure
ASML dominates the lithography equipment market, while KLAC and Lam Research lead in process diagnostics and wafer fabrication. AMAT must continue innovating to defend its market position.
Semiconductor Industry Cyclicality
Downturns in semiconductor demand could hurt AMAT’s revenue, as seen in previous industry cycles.
Investment Outlook & Valuation
Current Price: $155.68
Intrinsic Value: $207.38 (Safety Margin 24.93%)
Earnings Yield: 4.91%
Dividend Yield: 0.81%
AMAT’s intrinsic value suggests the stock is undervalued by 24.93%, making it an attractive long-term investment.
Bullish Case
Strong profitability and efficiency despite lower R&D spending.
High cash flow generation supporting shareholder returns.
Undervalued stock with strong upside potential.
Bearish Case
U.S. tariffs could impact sales in China.
Competition from ASML, KLAC, and Lam Research remains intense.
Semiconductor demand cycles may cause short-term volatility.
Final Verdict: Buy, Hold, or Sell?
Given AMAT’s undervaluation, strong margins, and efficient R&D spending, the stock presents a Buy opportunity for long-term investors. However, geopolitical risks should be monitored closely.
Investment Strategy:
Accumulate AMAT on dips, targeting a price range of $190-$210 over the next 12-18 months.

AMAT IDEACurrent demand level is a weak one and we can expect that this level will induce early buyers which can get wiped out when we set another bearish leg down to the next demand level where we can look to buy from.

AMATLooking like an ABCDE wave pattern, h/s formed on last leg up to D. Target for that is around 144$, TL touch coming in around 150$ depending on how long it takes to get there. I'm looking to buy at E, presumably around the 150$ area. Target is measured move of the pattern/, potential retest of all time highs, 230$-250$ area. If trendline @ E breaks south and price hangs out, the trade is bad. If you play it get as close to TL as possible to minimize risk. Not financial advice u do u, GL.

Downtrend in Applied Materials?Applied Materials has struggled since the summer and some traders may see further downside in the provider of chip equipment.
The first pattern on today’s chart is the series of higher lows between late December and mid-February. Earnings beat estimates on February 13, but conservative guidance pushed the stock below that line. The result is a potential bear-flag breakdown.
Second, short- and long-term moving averages may show bearish trends. The 50-day simple moving average (SMA) crossed under the 100-day and 200-day SMAs in September. Two months later, the 100-day SMA slid below the 200-day SMA.
The 8-day exponential moving average (EMA) crossed under the 21-day EMA two weeks ago. MACD has also been negative.
Finally, you have the big event of NASDAQ:NVDA Nvidia earnings tomorrow afternoon. Given its importance to the entire semiconductor industry, AMAT could be especially volatile around the news.
TradeStation has, for decades, advanced the trading industry, providing access to stocks, options and futures. If you're born to trade, we could be for you. See our Overview for more.
Past performance, whether actual or indicated by historical tests of strategies, is no guarantee of future performance or success. There is a possibility that you may sustain a loss equal to or greater than your entire investment regardless of which asset class you trade (equities, options or futures); therefore, you should not invest or risk money that you cannot afford to lose. Online trading is not suitable for all investors. View the document titled Characteristics and Risks of Standardized Options at www.TradeStation.com . Before trading any asset class, customers must read the relevant risk disclosure statements on www.TradeStation.com . System access and trade placement and execution may be delayed or fail due to market volatility and volume, quote delays, system and software errors, Internet traffic, outages and other factors.
Securities and futures trading is offered to self-directed customers by TradeStation Securities, Inc., a broker-dealer registered with the Securities and Exchange Commission and a futures commission merchant licensed with the Commodity Futures Trading Commission). TradeStation Securities is a member of the Financial Industry Regulatory Authority, the National Futures Association, and a number of exchanges.
TradeStation Securities, Inc. and TradeStation Technologies, Inc. are each wholly owned subsidiaries of TradeStation Group, Inc., both operating, and providing products and services, under the TradeStation brand and trademark. When applying for, or purchasing, accounts, subscriptions, products and services, it is important that you know which company you will be dealing with. Visit www.TradeStation.com for further important information explaining what this means.

$AMAT with a neutral outlook following its earnings #StocksThe PEAD projected a neutral outlook for NASDAQ:AMAT after a negative under reaction following its earnings release placing the stock in drift D with an expected accuracy of 87.5%.

Pivot on Applied Materials. AMATMy last take on applied materials was dead wrong, but you get that - this is trading. We are still proud to boast around 65% profitable takes overall. This is a good number for retail and institutional trader alike. Brett Connelly boast a stable 54% track record in his book "Alpha Trader."
But back to the idea.
Head and shoulder neckline break with gap and bearish price action. Technically, a congruent flip on VZO, BB%PCT with crosses of the MIDAS line. More bearish moves likely to follow.
Applied Materials Stock Tumbles 5% in Premarket TradingApplied Materials Inc (NASDAQ:AMAT) experienced a significant 5% drop in premarket trading on Friday, despite reporting first-quarter earnings that surpassed analyst expectations. The decline was primarily driven by the company's flattish second-quarter guidance, which fell short of market expectations.
Earnings and Revenue Performance
Applied Materials reported adjusted earnings per share (EPS) of $2.38 for the first quarter, beating the consensus estimate of $2.28. Revenue came in at $7.17 billion, slightly above the expected $7.15 billion and marking a 7% year-over-year increase. Despite these strong results, the company's guidance for the second quarter disappointed investors. AMAT forecasted revenue of $7.1 billion, plus or minus $400 million, below the $7.198 billion analysts anticipated. The projected adjusted EPS of $2.30, plus or minus $0.18, was also in line with the $2.29 consensus estimate but failed to excite the market.
Segment Performance and Market Trends
The company's Semiconductor Systems segment, which accounts for about 75% of total revenue, saw a 9% year-over-year increase to $5.36 billion. However, AMAT expects softness in its ICAPS segment, particularly in China, with a low-to-mid teens quarter-over-quarter decline.
Analyst Sentiment
Despite the disappointing guidance, analysts remain bullish on AMAT. Stifel analysts noted that the ICAPS/China decline is expected to moderate, and strength in leading-edge segments could support mid-to-upper single-digit year-over-year growth. They believe AMAT should not trade at a 3-5 turn forward discount to peers and recommend buying the shares. Mizuho analysts also shared a positive outlook, highlighting AMAT as the #1 global SemiCap Equipment supplier and a key technology enabler with strong AI spend tailwinds.
Technical Analysis
As of the time of writing, AMAT stock is down 5.2% in premarket trading. This significant drop has brought the stock to a critical technical juncture.
Fibonacci Levels
The 78.6% Fibonacci level is identified as a key support zone. In the case of an extreme pullback, this level could serve as a bounce zone for further gains. Conversely, the 38.2% Fibonacci level is acting as a resistance point. A break above this level could spark a bullish reversal, potentially leading to a recovery in the stock price.
Conclusion
Applied Materials' strong first-quarter performance was overshadowed by its cautious second-quarter guidance, leading to a significant premarket drop. However, the company's robust fundamentals and positive analyst sentiment suggest that the current weakness may be a buying opportunity. From a technical perspective, key Fibonacci levels provide critical support and resistance points that could dictate the stock's short-term trajectory.

AMAT Applied Materials Options Ahead of EarningsAnalyzing the options chain and the chart patterns of AMAT Applied Materials prior to the earnings report this week,
I would consider purchasing the 180usd strike price Calls with
an expiration date of 2025-2-21,
for a premium of approximately $6.75.
If these options prove to be profitable prior to the earnings release, I would sell at least half of them.

AMAT bullish breakoutAMAT is has just borken a long term bearish trend and it looks like its on its way to recovery
This breakout can be a fakeout so lets wait till it breaks above 200 EMA and that will be confirmation of the reversal
Check on Daily and Weekly
Entry at 200 + would be great as it will confirm the recovery
210+ will confirm the golden pocket as well
Stop loss @175 is good

Applied Materials Inc. Technical and Fundamental Aspects.Applied Materials, Inc. is an American corporation that supplies equipment, services and software for the manufacture of semiconductor (integrated circuit) chips for electronics, flat panel displays for computers, smartphones, televisions, and solar products.
The company also supplies equipment to produce coatings for flexible electronics, packaging and other applications.
U.S. chip stocks rise on Thursday, January 16th, after Taiwan Semiconductor Manufacturing Co NYSE:TSM , the world's largest contract chipmaker, reported record quarterly profit today.
In technical terms, Applied Materials stock was not among hyped and scorching-hot Trump-a-Rally assets in November, 2024.
However the most important thing is that in December, 2024 AMAT stocks has been supported by 100-week SMA and now is forming breakthrough of descending top/ flat bottom technical figure, trying to print the biggest over past twelve months 4-weeks upside swing.
In fundamental terms, Applied Materials NASDAQ:AMAT is presently being traded at a Forward P/E ratio of 22.12. This signifies a discount in comparison to the average Forward P/E of more than 25 for Semiconductors industry peers.
Another Semiconductors industry peers are being trading as follow - a Forward P/E ratio for Nvidia Corp NASDAQ:NVDA is presently 53.30; for Taiwan Semiconductor Manufacturing NYSE:TSM is 34.92; for Broadcom Inc NASDAQ:AVGO is 191.80; for Asml Holding NV NASDAQ:ASML is 40.08; and for Advanced Micro Devices Inc NASDAQ:AMD is 106.63.
The main technical graph for Applied Materials Inc. NASDAQ:AMAT indicates on a forming breakthrough of descending top/ flat bottom technical figure.
The nearest upside target is considered by our team as a 6-month highs near $ 215 a share, and the far target is considered as a Double Top technical figure around $ 250 a share, that can be achieved over next 6 months.

Bullish Shark PatternI did a post on this before, but I am reposting because it got a confirmation back-test double-bottom. This is especially good because the local low backtested the high from January 2022. The shark harmonic with a 1.13 fib retrace.

Downtrends Finding Support for the Next Uptrend: AMAT ExampleNASDAQ:AMAT was over-speculated in 2023 and then had a top formation that trended down starting in July 2024. This is still considered technically to be an intermediate-term trend correction. The selling started at an all-time high.
HFTs are constantly in the mix, selling down. However, the shift of sentiment has started and there are gaps up recently.
It is NOT in a buyback mode but the stock is finding support from the 2021 highs, which is strong support. This should provide the basis for the beginning of a bottom formation.
