AMCI find the price was walking in a descending channel and broke it and retested the break. I find the price is now at an important level 22.18. If it manages to adapt above it, it means more upside for the market. The levels expected to reach it, provided the above is achieved.
24.97
29.04
32.07
35.73
AMC trade ideas


AMC is on track for massive gainsThe move today lacks volume, but will for sure lore some investors in the play. If we see consistend increase in volume in following days, we will easily tag $20+ in a matter of weeks

After a Break, there shall be Light. The APE dividend is coming as a 1:1 non-dilutive "split". Every single one of the roughly 500million shares will receive 1 $APE, priced at 0.01$.
What if, let's say YOU hold 1000 shares of AMC. Later this month the dividend will be distributed and you surprisingly only receive 300 $APE.
Where are the remaining 700 $APE shares? Is it possible that you only held fugazi shares that looked like real ones? Where would the missing $APE shares come from?
Would your broker buy them back at market price to provide for the missing shares? What would that mean for the price of $APE? Who would be accountable of such a mess?
And what if they try to provide those missing shares, only to realise that the price of $APE has exceeded the thousands?
What if someone already knows about this and decides to cover the shorts before the dividend is distributed to avoid being proven guilty?
What if?

History always repeats!Back when I posted the 'accumulation on AMC' I though the fractal between January 2021 and June 2021 was just slanted.
This would mean a clockwise rotation of the fractal. basically a skewed version of the fractal.
Downward moves would be more extreme and sharp.
Upwards move would look more like a consolidation.
Consolidation would look like a slight down trend, following the angle at which the fractal is rotated.
I was early when I thought August 3rd 2022 was may 26th 2021 on the fractal.
It seems to me that today August 5th 2022 was May 13th 2021 on the fractal.


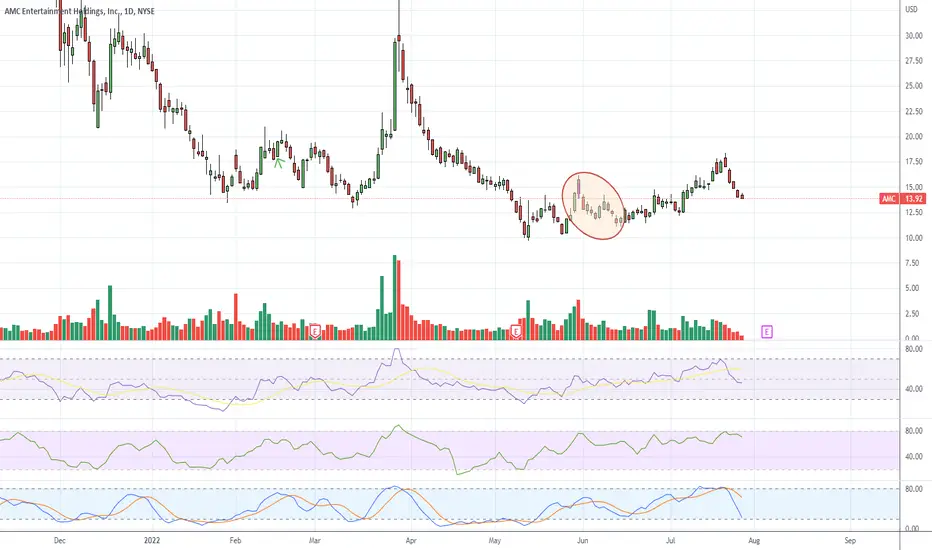
AMC hasn't looked this good in 8 months The CM Slingshot Indicator for AMC has finally turned green. The last time it was green was November 29, 2021 (about eight months ago). The stock also closed above the 200 MA , which hasn't happened since Dec 8, 2021 (also about 8 months ago). I'm looking for AMC to close above around $23-$25 to signal a breakout of the macro descending channel. Also looking to see increasing volume.
The next few weeks should be interesting....Not financial advice.

AMC - APE stock splitSo AMC decided to do a clever trick and take advantage of the hype coming back into stocks and even meme stocks. Retail traders have taken a hit, with many retail-heavy companies like Gamestop, Coinbase and Robinhood, etc., taking massive hits. However, GME has been doing well, COIN doubled off its lows, and HOOD looks decent.
As stocks are bouncing and the bull could be back, AMC decided to do an intelligent stock split by issuing new preferred stock they can sell. They named it APE, like the Apecoin, a popular NFT-related token, which could create a lot of hype around it. Essentially, it is a trap for retail to go and buy APE without hurting the price of AMC as much and allowing the company to raise the cash it needs. Last year, AMC dumped all of the company shares onto retail on the way up and raised 2B dollars that it has essentially spent and needs fresh cash as it still has a lot of debt. At the same time, they made this look like an airdrop, and it is like an airdrop, but one in which the company controls the majority of the shares.
The company's price looks pretty good regarding TA, as it bottomed nicely. First, it had an 86% correction, which means the entire bubble popped, and there is no froth in the market. It retested some key levels and then reclaimed some key support levels. Since May, it has essentially been in accumulation mode, and today we had the confirmation of the breakout, as the market initially gapped down and then had a massive rally. In my opinion, this rally could last for a while, with the price increasing to 50-60$ before it goes back down again. It wouldn't be surprising if we saw the market go up for the next two weeks and top close to the date of the airdrop/split (22nd of August).

AMC Potential Breakout ScenarioAMC has been trading within this macro falling wedge for a while now and has also formed a smaller symmetrical wedge on the daily timeframe. Price is attempting to breakout from both patterns and if it does we could see a huge move to the FIB golden pocket as seen in late march. PT 26.78- 30 usd. A rejection would send the price back to the bottom of the pattern for another cycle.
Not financial advice :).

AMC - Where do we go from here???Bull trap or bear trap??? Where do we go from here? Gamma or accumulation?

AMC UpdateLooks to me like we're due for a 2 day kick here, but I'm staying out unless we see $12.25
AMC has a tendency to fill gaps, if it doesn;t fill that gap above by earnings then I'm going long.
AMC: Potential Breakout, testing resistance as supportAMC breaking out of its downward channel and looking for daily support green candle on the upper resistance trend line, some volume confirmation and green open on monday could confirm a move higher.
First target $24 if breakout is sustained based on fibonacci retracements.

AMC Breakout $ Target we going to confirm if this not a fake out if we hold above the 16$, or above the breakout triangle , first resistant we going to test is around the 20.50$, and the second one , which is the squeeze level as well if we broke it and hold above , which is above the 29$+.
NYSE:AMC

AMC AUGUST 2022 AMC testing Fib level $19.10 and currently sitting on support. Need to test HOD 19.75 to ultimately test and break Jan 2021 ATH 20.36 and reach the March run of 34.33.

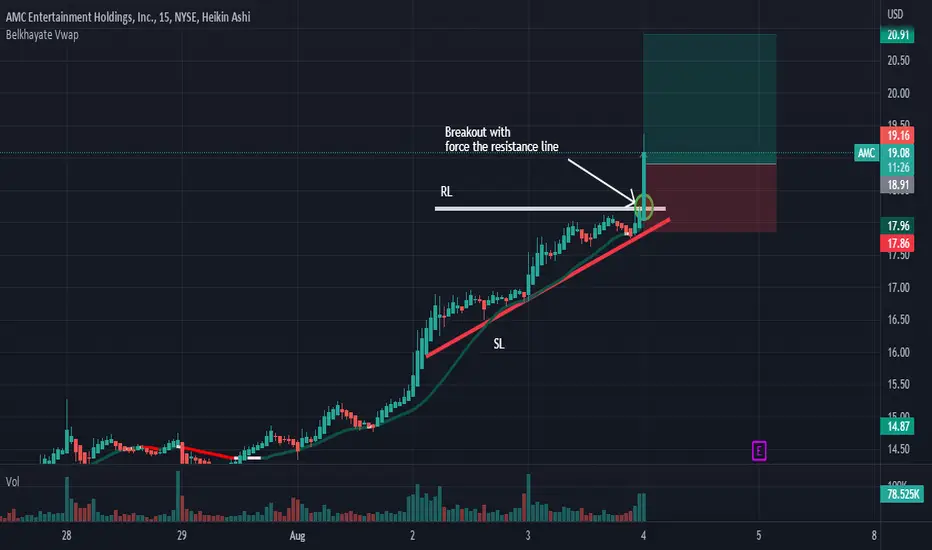
Analysis-uptrendGood morning! As you see on the chart the buyers are there. We have the breakout with force the resistance line by a big green candle. So we will have a big probability of an upttrend. Thanks.

AMC Rising has 20 % near-term upside heading into earnings; Prior earnings
are all beats. Breaking out of a wedge on the weekly chart.
Is this the next moonshot setting up for launch?
Nice price action today with volume.
What do you think?

AMC is Clearly Tracking ETH Classic The chart speaks for itself. If AMC continues to follow ETH Classic, I would expect a continuation to the upside. NOT FINANCIAL ADVICE

AMC IS STRONGNice Volume came in today. I expect the continuation in the coming 2 weeks. Tomorrows earnings report will hopefully be a catalyst to new ATHs


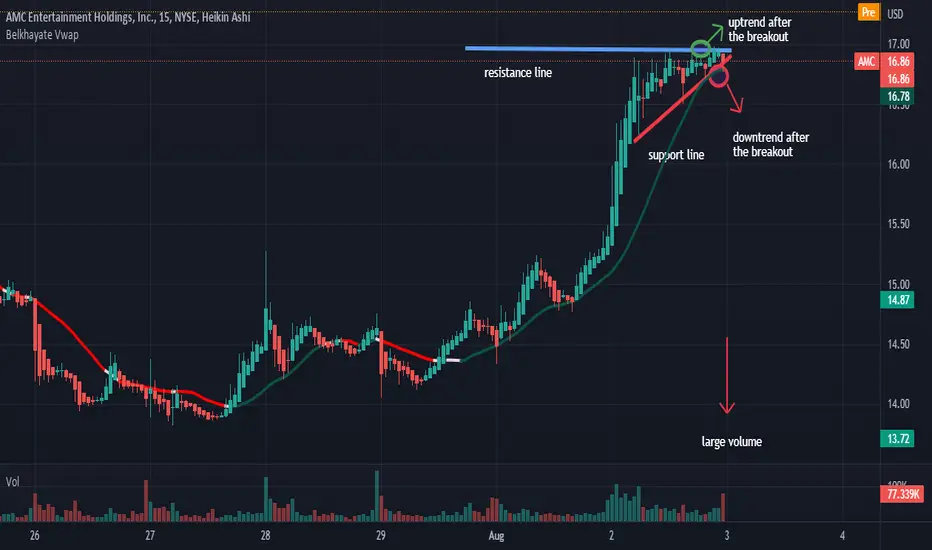
AnalysisOn AMC we have had a very nice trend over the past few days. Two conditions are to be seen for our analysis today. On the one hand, as you see on the chart if the resistance line is forcefully broken by a large green candle and followed by a large green volume, this means that we would have trend continuity. On the other hand, if the vwap indicator as well as the support line are forcefully broken by a large red candle and accompanied by a large red volume it implies that we would have a high probability that the market will fall.Thanks.
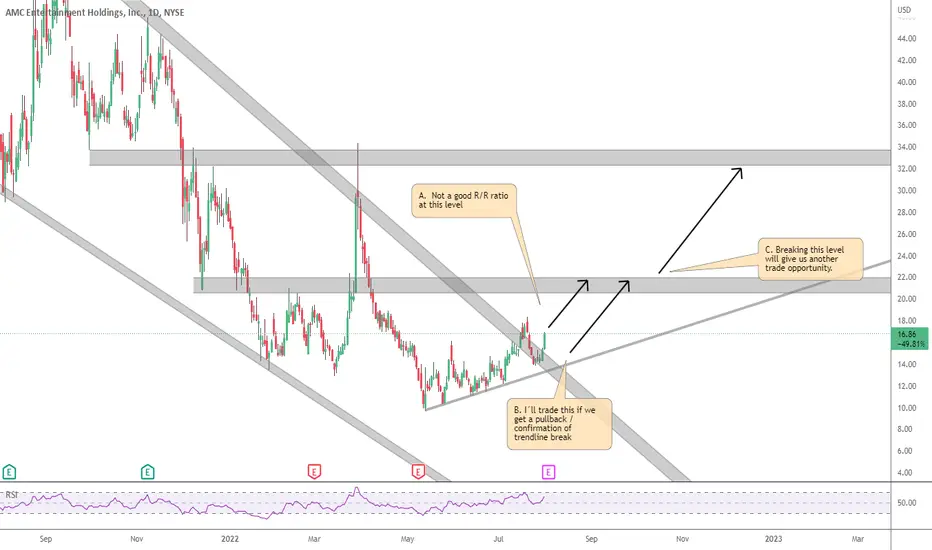
AMC - Attempting a trendline breakAMC has been falling in a clear wedge, and is currently attempting another breakout to the upside.
We have 2 important resistance levels: 20-22 and 32-34.
My trade plan is:
A. At current levels (16.86 as I write this), the R/R ratio is not good enough for me, considering 20-22 resistance.
B. If we get a pullback to 12-14, I may take a long trade depending on price action, with first target at 20-22.
C. If I don´t get a trade in this zone, I´ll wait for a break of 20-22 resistance, targeting next key level at 32-34.
Don't be late to the BIG PARTYThis looks very good. Earnings from AMC and HYMC are ahead. Price looks primed to go above 20$ this or next week. More bullish every day. This will not take long and I believe we have reached endgame.
